 Open Access Article
High performance ozone decomposition over MnAl-based mixed oxide catalysts derived from layered double hydroxides†
Mingpan Shao,
Wei Hong,
Tianle Zhu ,
Xinxin Jiang,
Ye Sun* and
Shiyu Hou
School of Space and Environment, Beihang University, Beijing 100191, China. E-mail: suny@buaa.edu.cn
First published on 21st September 2022
Abstract
Mesoporous and dispersed MnAl-based mixed metal oxide catalysts (MnxAlO) were fabricated via the calcination of layered double hydroxide (LDH) precursors prepared by the coprecipitation method. Their physiochemical properties were characterized and their catalytic activities for ozone decomposition were evaluated. The results indicate that the prepared MnxAlO catalysts have excellent catalytic activity owing to their large specific surface area, abundant surface oxygen vacancies and lower average Mn oxidation states. The Mn/Al atomic ratio and calcination temperature are found to significantly affect the textural properties and catalytic activity for ozone decomposition. The Mn2AlO-400 catalyst (Mn/Al = 2, calcined at 400 °C) exhibited 84.8% ozone conversion after 8 h reaction under an initial ozone concentration of 45 ± 2 ppm, 30 ± 1 °C, a relative humidity of 50% ± 3%, and a space velocity of 550![[thin space (1/6-em)]](https://www.rsc.org/images/entities/char_2009.gif) 000 h−1. The results also show that the catalytic activity of Mn2AlO-400, which was deactivated owing to the accumulation of oxygen-related intermediates, was recovered by calcination at 400 °C under a N2 atmosphere for 1 h. A possible reason for catalyst deactivation and regeneration is proposed. This work provides a facile method for fabricating MnxAlO catalysts with excellent characteristics to achieve better catalytic activity, which are promising candidates for practical ozone decomposition.
000 h−1. The results also show that the catalytic activity of Mn2AlO-400, which was deactivated owing to the accumulation of oxygen-related intermediates, was recovered by calcination at 400 °C under a N2 atmosphere for 1 h. A possible reason for catalyst deactivation and regeneration is proposed. This work provides a facile method for fabricating MnxAlO catalysts with excellent characteristics to achieve better catalytic activity, which are promising candidates for practical ozone decomposition.
1. Introduction
The ozone layer in the stratosphere protects against short-wavelength ultraviolet radiation from sunlight, but is also a source of air pollution in the troposphere. Ozone (O3) is a critical air pollutant in both indoor and outdoor environments. In outdoor environments, ozone is a secondary air pollutant that results from photochemical reactions among volatile organic compounds (VOCs) and nitrogen oxides (NOx) under sunlight irradiation.1 In indoor environments ozone can be generated from electric appliances (e.g., photocopiers, air purifiers, and laser printers), which may lead to considerable ozone emissions.2 Additionally, natural or mechanical ventilation can introduce ozone to the indoor environment. Ozone participates in reactions with organic pollutants present in indoor environments and generates a series of oxidation products (e.g., unsaturated hydrocarbons, VOCs, and secondary organic aerosols), which have a severely detrimental effect on the environment and human health over long-term exposure.3,4 Ozone has a resonant structure that makes it highly stable, with a half-life of 160 h at room temperature and atmospheric pressure,5 and its spontaneous decomposition at room temperature is negligible. The development of effective zone elimination techniques has thus become an urgent task to protect the environment and human health.Several promising methods to eliminate ozone have been explored, including activated carbon adsorption, thermal decomposition, photocatalytic decomposition and catalytic decomposition.4 As a cheap and conventional adsorbent, activated carbons are commonly used to remove ozone. The ozone removal efficiency depends on the strength of the chemical bonds and specific area.6,7 However, activated carbon needs to be regenerated or replaced frequently because it is easily deactivated, and the removal efficiency is greatly affected by humidity. Thermal decomposition requires heating the gas to about 400 °C, which has good removal efficiency for high-concentration O3.8 For the photocatalytic decomposition, the removal efficiency is relatively low in the environment of natural light.9 The conversion of ozone on bare TiO2 is low, needs adding noble metals (such as Ag, Pt, Pd, Au) or transition metals (such as Mn, Cu, Fe) to promote charge transfer.10–12 Compared with above methods, catalytic decomposition is considered an effective technique to safely, economically, and efficiently remove gaseous ozone.13,14 Catalysts mainly includes noble metal catalysts (e.g., Ag, Au, Pt, Pd)15–18 and transition metal catalysts (e.g., Mn, Co, Ni, Fe).3,19–23 Noble metal catalysts have excellent activity for O3 decomposition, as well as excellent moisture resistance, and have attracted the attention of many researchers, but the high cost limits their wide applications.24 Manganese oxides (MnOx) are commonly used as the active components for ozone decomposition due to their economic and environmental benefits, diverse structures, simple preparation, and excellent physicochemical properties.20,24–27 Several studies have shown that Mn3+ (oxygen vacancy) is the active site in MnOx for the catalytic decomposition of ozone.
Recent studies have reported oxygen vacancies with different properties and effects on performance. Li et al.28 reported two different kinds of structural oxygen vacancies (sp2-Ovac and sp3-Ovac) in α-MnO2, its different adsorption energies for O3, O2, and H2O, resulted in different catalytic activities. These findings are indicative of the strong sensitivity of catalytic reactions to oxygen vacancy properties. Hong et al.14 showed that Li+ ions on α-MnO2 surface can influence oxygen vacancies by promoting the adsorption of O3 and desorption of H2O and O2, thus improving the ozone decomposition performance. The content and species of various ions in the channels of the MnOx structure can be regulated to increase oxygen vacancy contents. High content of oxygen vacancies is beneficial to the ozone decomposition performance. Therefore, it is necessary to adjust the oxygen vacancies at the micro-scale of the manganese oxides. However, the low yield and low specific surface areas of MnOx catalysts prepared by the hydrothermal method. Relatively low specific surface areas tend to limit the catalytic efficiency of MnOx and supporters are required. The key challenge in the preparation of supported manganese oxides is the active phase MnOx to uniformly dispersed to maximum extent, while simultaneously stabilizing it against thermal degradation resulting from sintering and solid state reactions with the support and within the active phase itself.29 All these limits its practical applications.
Numerous recent reports have contributed to the synthesis, characterization, and catalytic applications of mixed metal oxides (MMO) produced by the thermal decomposition of layered double hydroxides (LDHs) (e.g., Co–Al,30 Co–Mn–Al,31,32 Pd/Co–Mn–Al,33,34 Cu–Co–Al35,36), which are two-dimensional layered materials with a general chemical formula of [M1−x2+Mx3+(OH)2]x+[Ax/n]n−·mH2O, where M2+ and M3+ are di- and trivalent metal cations, respectively, An− is a counter anion, and x = 0.17–0.33. With their adjustable cations, interlayer anions, and particular structure characteristics (e.g., long-range order, topological transformation, confined effects), LDHs have been proven to have many potential applications as catalysts,37 catalyst supports, or catalyst precursors.38,39 Mixed metal oxides are formed by the calcination of LDHs, which possess unique properties such as high surface area and porosity, good thermal stability, homogeneously mixed oxides, and high metal cation dispersion. These features motivated this study to construct MnOx catalysts derived from LDHs for ozone decomposition, which are expected to exhibit the following strengths. (1) A 2D lamellar structure with a large surface area can provides more active sites for ozone decomposition, and facilitates the adsorption and desorption of gas molecules. (2) Excellent thermal stability and high homogeneous dispersion of active components on the MnxAlO would accelerate the ozone decomposition performances. (3) The valence state of Mn can be tuned without changing the 2D structure and create more redox couples, which would further improve the catalytic activity.
In this work, we report the fabrication of MnxAlO powdered catalysts derived from a MnxAl-LDH precursor, and investigate their catalytic activity for ozone decomposition. The results indicate that Mn2AlO-400 catalysts had the highest catalytic activity. Measurements of the BET, H2-TPR, NH3-TPD and XPS demonstrate that the prepared Mn2AlO-400 possessed a large surface area, low temperature reducibility, stronger acid sites and the high Mn3+/Mn4+ and OII/OI values, which account for its significantly enhanced activity. The Mn2AlO-400 catalyst was further investigated to the deactivation mechanism and regeneration method by in situ DFT-IR.
2. Materials and methods
2.1 Catalysts preparation
The MnxAl-LDH precursors were prepared by the coprecipitation method. A mixed solution of 0.5 M Mn(NO3)2 and Al(NO3)3 (Mn2+/Al3+ molar ratio = 1, 2, 3, 4) was added dropwise to 0.5 M NaCl solution with stirring. The solution pH was adjusted to 9–10 by the dropwise addition of 2 M NaOH solution, and the temperature was held in a thermostat set at 313 K. N2 atmosphere and decarbonated water were applied throughout the procedure to prevent the over-oxidation of Mn and generation of MnCO3. The resulting precipitate was aged for 1 h in the mother liquor solution and collected by filtration. The solid product was filtrated and washed completely with deionized water to pH = 7. The sample was also washed with ethanol several times and then filtered. The precipitate was dried in air at 60 °C.MnxAlO catalysts were obtained by calcinating the products of the MnxAl-LDH precursors in air at 400 °C for 4 h using a heating rate of 2 °C min−1 (denoted as MnxAlO-400). The effect of calcination temperatures (300, 400, 500, 600, and 700 °C) on the catalyst performance was also investigated. The resulting samples are denoted as MnxAlO-300, MnxAlO-400, MnxAlO-500, MnxAlO-600, and MnxAlO-700, respectively.
2.2 Catalysts characterization
Crystal structure analyses of the samples were systemically performed using X-ray powder diffraction (XRD, Bruker, USA) over a 2θ range of 5–80° and scanning speed of 4° min−1. The pore size, pore volume, and surface area of the samples were measured on an ASAP 2020 instrument (BET, Micromeritics, USA) using N2 adsorption/desorption. The samples were pretreated at 200 °C in a vacuum for 3 h prior to testing, and their microstructures were observed using a Zeiss Sigma 500 field emission scanning electron microscopic (SEM; Carl Zeiss AG, Oberkochen, Germany) at a voltage of 5 kV. The chemical compositions were measured by inductively coupled plasma-atomic emission spectrometry (ICP-OES, Agilent, USA). The surface chemical compositions and chemical states of Mn and O in the catalysts were obtained using an Escalab 250xi X-ray photoelectron spectrometer (Thermo Fisher Scientific Inc., USA), which was calibrated by referencing the C 1s signal at 284.8 eV. H2-TPR, NH3-TPD and CO2-TPD experiments were conducted on a Micromeritics AutoChem II 2920 chemisorption analyzer equipped with a TCD detector (Micromeritics Instrument Corp). The related reaction intermediates, which reduced the ozone decomposition activity, were investigated by in situ diffused Fourier transform infrared spectroscopy (in situ DFT-IR) using a Nicolet 6700 FTIR spectrometer (Nicolet Instrument Corp., USA).2.3 Evaluation of ozone decomposition activity
The ozone decomposition activity was evaluated by dynamic testing at 30 ± 1 °C in a fixed-bed continuous flow quartz reactor (inner diameter = 5 mm) under atmospheric pressure conditions. In each run, 0.15 g of catalyst sample of 40–60 mesh was loaded into a quartz reactor and pretreated at a heating rate of 5 °C min−1 to 120 °C for 1 h in a N2 atmosphere to eliminate adsorbed water on the catalyst surfaces. Ozone was generated by flowing 1.0% O2/N2 compressed gas through an HTU-500E ozone generator (Azco Industries Ltd., Canada). The relative humidity was adjusted from 0% to 99% with an accuracy of ±3% by passing compressed dry air (80% N2 + 20% O2) through a water bath bubbler. The total gas flow rate passing through the quartz reactor was controlled at 2 L min−1, which contained 40 ± 2 ppm O3. The gas hour space velocity was maintained at 550![[thin space (1/6-em)]](https://www.rsc.org/images/entities/char_2009.gif) 000 h−1. The ozone concentrations at the inlet and outlet were detected using a 106-L ozone online analyzer (2B Technologies, USA). The relative humidity was measured using a 7116-CP thermos hygrometer (Cole Parmer, USA). The ozone conversion was calculated according to:
000 h−1. The ozone concentrations at the inlet and outlet were detected using a 106-L ozone online analyzer (2B Technologies, USA). The relative humidity was measured using a 7116-CP thermos hygrometer (Cole Parmer, USA). The ozone conversion was calculated according to:
 | (1) |
3. Results and discussion
3.1 Structure and composition of catalysts
Fig. 1a shows that the XRD patterns of the prepared LDHs exhibit four typical (003), (006), (012), and (110) diffraction peaks,40,41 which indicate the generation of a well-crystallized layered structure with R![[3 with combining macron]](https://www.rsc.org/images/entities/char_0033_0304.gif) m symmetry.42 The lattice parameter a = 2d (113) around 2θ = 59.4° coincides with the closest M-M distance within the layers, whereas c = 3d (003) around 2θ = 11.3° is as a function of the interlayer distance. These values are calculated and summarized in Table 1. The results suggest that the lattice parameter a decreases with increasing Mn/Al molar ratio, whereas c increases. It should be noted that Mn2Al-LDH had the best crystallinity, while Mn4Al-LDH had the worst. Diffraction peaks of Mn3O4 were also observed in Mn4Al-LDH sample, because of the oxidation of the sample during preparation.41 The color of the sample was found to change gradually from white to light yellow upon drying in air, showing that the Mn2+ in the LDHs is partially oxidized.40 The metal compositions of the LDHs were determined by ICP-OES (Table 1). The Mn contents are slightly higher than those in the feed materials, except for Mn3Al-LDH.
m symmetry.42 The lattice parameter a = 2d (113) around 2θ = 59.4° coincides with the closest M-M distance within the layers, whereas c = 3d (003) around 2θ = 11.3° is as a function of the interlayer distance. These values are calculated and summarized in Table 1. The results suggest that the lattice parameter a decreases with increasing Mn/Al molar ratio, whereas c increases. It should be noted that Mn2Al-LDH had the best crystallinity, while Mn4Al-LDH had the worst. Diffraction peaks of Mn3O4 were also observed in Mn4Al-LDH sample, because of the oxidation of the sample during preparation.41 The color of the sample was found to change gradually from white to light yellow upon drying in air, showing that the Mn2+ in the LDHs is partially oxidized.40 The metal compositions of the LDHs were determined by ICP-OES (Table 1). The Mn contents are slightly higher than those in the feed materials, except for Mn3Al-LDH.
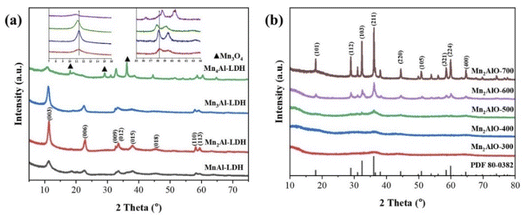 | ||
| Fig. 1 (a) XRD patterns of MnxAl-LDH; (b) XRD patterns of Mn2AlO calcined at different temperatures. | ||
| LDH | a (Å) | c (Å) | Mn/Al |
|---|---|---|---|
| MnAl-LDH | 3.19 | 23.37 | 1.12 |
| Mn2Al-LDH | 3.19 | 23.40 | 2.09 |
| Mn3Al-LDH | 3.12 | 23.89 | 2.76 |
| Mn4Al-LDH | 3.06 | 23.99 | 4.11 |
Fig. 1b shows the XRD pattens of the prepared Mn2AlO samples at different calcination temperatures. The LDH precursors are found to have been completely transformed into a mixture of oxide and spinel oxide phases. The peak intensities increase with increasing calcination temperature, and the lower-crystalline MnOx changed to a Mn3O4 spinel phase. The strongest reflection (2θ = 36.5°) corresponds to the (211) plane of the Mn3O4 spinel phase (PDF card no. 80-0382). Other diffraction peaks located at 18.1°, 28.9°, 32.4°, and 60.4° are observed, which correspond to the (101), (112), (103), and (224) planes, respectively. The average crystallite sizes calculated using the Scherrer equation are listed in Table 2. The grain size of the crystallites significantly increased with increasing Mn/Al molar ratio. The size of the Mn2AlO-400 grains decreased to 16.8 nm with increasing calcination temperature, which is the smallest among all of the prepared samples. Small-sized particles will produce more crystal defects, which are beneficial to catalytic activity. The amorphous Al2O3 matrix in mixed oxides can also play a supporting role in stabilizing and dispersing MnOx, which is favorable to high catalytic activity.
| Samples | BET surface area (m2 g−1) | Total pore volume (cm3 g−1) | Pore diameter (nm) | Particle size (nm) |
|---|---|---|---|---|
| MnAlO-400 | 216.6 | 0.508 | 8.33 | 11.5 |
| Mn2AlO-400 | 153.3 | 0.404 | 9.71 | 16.8 |
| Mn3AlO-400 | 131.3 | 0.471 | 12.94 | 17.7 |
| Mn4AlO-400 | 73.6 | 0.344 | 19.63 | 20.7 |
| Mn2AlO-300 | 135.1 | 0.417 | 13.42 | 42.3 |
| Mn2AlO-500 | 106.8 | 0.388 | 14.00 | 21.1 |
| Mn2AlO-600 | 74.7 | 0.318 | 16.63 | 22.6 |
| Mn2AlO-700 | 53.1 | 0.322 | 24.88 | 19.7 |
3.2 Characterization of catalysts
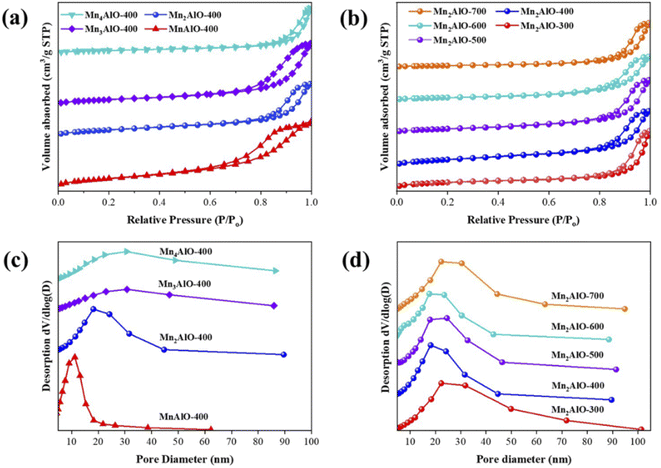
Fig. 2 displays the N2 adsorption–desorption isotherm and corresponding pore size distribution curve for the MnxAlO catalysts. All of the samples exhibit a typical IV isotherm with a H2-type hysteresis loop (P/Po > 0.4), which is associated with the occurrence of capillary condensation in the mesopores and confirmed by the pore size distribution shown in Fig. 2(c and d). This is commonly observed with aggregates of plate-like particles of LDH precursor materials that remain in the calcined mixture, giving rise to slit-shaped pores.43 Table 2 lists the specific surface area, pore volume, and pore diameter of all samples. The specific surface area of MnxAlO-400 catalysts decreases with increasing Mn/Al ratio, from 216.6 m2 g−1 for Mn/Al = 1 to 73.6 m2 g−1 for Mn/Al = 4, and the average pore diameter increased from 8.33 to 19.63 nm over the same range.The effect of calcination temperature on the Mn2AlO samples was also examined. The specific surface area of the Mn2AlO catalyst initially increased with calcination temperature, from 135.1 m2 g−1 at 300 °C to 153.3 m2 g−1 at 400 °C, and then decreased upon further increasing the calcination temperature to 53.1 m2 g−1 at 700 °C (Table 2), together with increased pore size distribution.
SEM and TEM were employed to study the morphology and surface structure of the samples. Fig. 3a–d show SEM images of the obtained MnxAl-LDH particles. All of the LDHs indicate a uniform and randomly oriented, thin, hexagonal lamellar structure with dimensions ranging from 80 to 300 nm. The Mn2Al-LDH samples are of higher quality in terms of morphology, size, uniformity, and crystallinity, which are far superior to the other prepared MnxAl-LDH samples. These results are consistent with the X-ray diffraction peak intensities among the MnxAl-LDH samples. The SEM images of Mn2AlO after calcination in air at different temperatures are shown in Fig. 3e–g. The morphology of Mn2AlO can maintain a relatively complete shape after calcination in air at 300 °C to 500 °C, while the structures of the other higher-temperature samples (700 °C) decomposed to many fine particles.
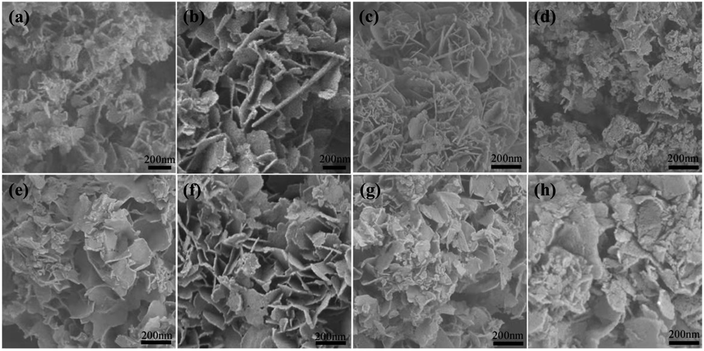 | ||
| Fig. 3 SEM of (a) MnAl-LDH, (b) Mn2Al-LDH, (c) Mn3Al-LDH, (d) Mn4Al-LDH, (e) Mn2AlO-300, (f) Mn2AlO-400, (g) Mn2AlO-500, (h) Mn2AlO-700. | ||
Fig. 4(a1–d1) show the MnxAlO show a hierarchical frizzy nanoflake shape composed of a randomly aggregated structure of numerous ultrathin platelet-like, which is well agreement with the SEM images in Fig. 3. In addition, many plates have been broken into smaller pieces. It also can be observed that the MnOx particles dispersed among plates, and the particles size increase with increasing Mn/Al ratio and the calcination temperature which might be due to an increase of agglomeration and particularly to segregation of spinel phases Mn3O4 observed by XRD. The particle sizes were 20–70 nm of MnxAlO-400 and 100–450 nm of Mn2AlO-700, respectively. From high-resolution transmission electron microscopy (HRTEM) images (Fig. 4(a2–d2)) of MnxAlO-400, the surface lattice spacing was measured to be 0.31 nm corresponding to the (112) crystal plane of Mn3O4 spinel phase with poor crystallization. The HRTEM image (Fig. 4(d2) of Mn2AlO-700 catalyst exposed the identified fringes with lattice spacings of about 0.28 nm, rather close to the (200) crystal phase of the Mn3O4 phase with slightly good crystallization. The microstructures of MnxAlO catalysts are in agreement with XRD results. Therefore, the calcination temperature has a great impact on the prepared catalysts.
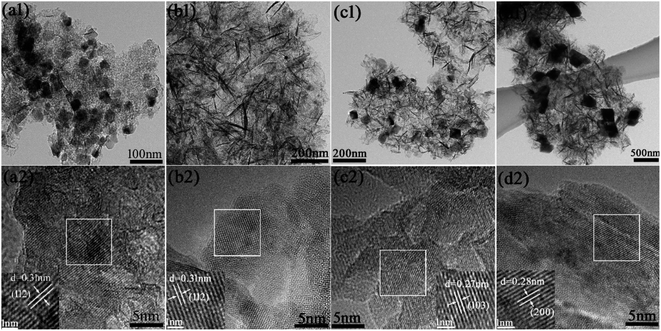 | ||
| Fig. 4 TEM images and HRTEM images of (a) MnAlO-400; (b) Mn2AlO-400; (c) Mn3AlO-400; (d) Mn2AlO-700. | ||
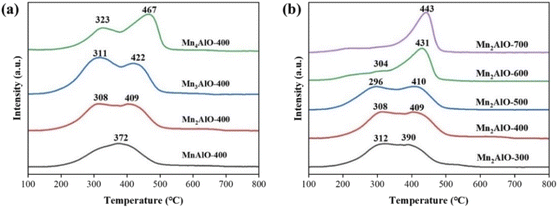
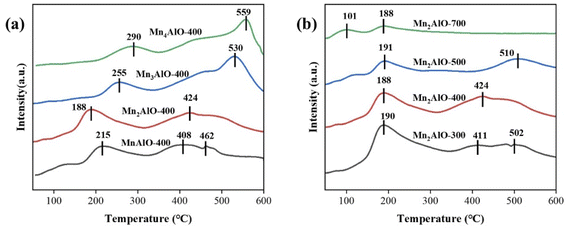
To assess the redox properties of the MnxAlO catalyst series, H2-TPR analyses of all catalysts were carried out, as shown in Fig. 5. The MnxAlO samples were reduced in two main temperature regions. The reduction of manganese oxides can be described by the successive reduction processes: MnO2 → Mn2O3 → Mn3O4 → MnO.19 The first reduction peak (200–350 °C) is attributed to the reduction of MnO2 to Mn3O4. The second reduction peak (350–500 °C) is ascribed to the reduction of Mn3O4 to MnO. For the Mn2AlO-400 catalyst, the maximum H2 consumption occurs at 308 °C and 409 °C. Increasing the Mn/Al molar ratio shifts the reduction peaks toward higher temperature. The reduction peak appears to widen and the intensity increases in Fig. 5a.
Fig. 5b shows the influence of calcination temperature on the catalyst reduction performance. For catalyst Mn2AlO-300, the first reduction peak occurred at 312 °C and the second peak appeared at 390 °C. The reduction pattern of Mn2AlO-500 was similar, but the first peak position shifted to lower temperature (296 °C) and the second peak position shifted to higher temperature (410 °C). In contrast, catalysts Mn2AlO-600 and Mn2AlO-700 only showed a single reduction peak at 431 °C and 443 °C, respectively. This supports that the reduction performance of the Mn2AlO catalysts is indeed sensitive to calcination temperature. The low-temperature reduction ability of Mn2AlO obtained at higher calcination temperature is poor, and low-temperature calcination is more beneficial to Mn2AlO reduction than high-temperature calcination.
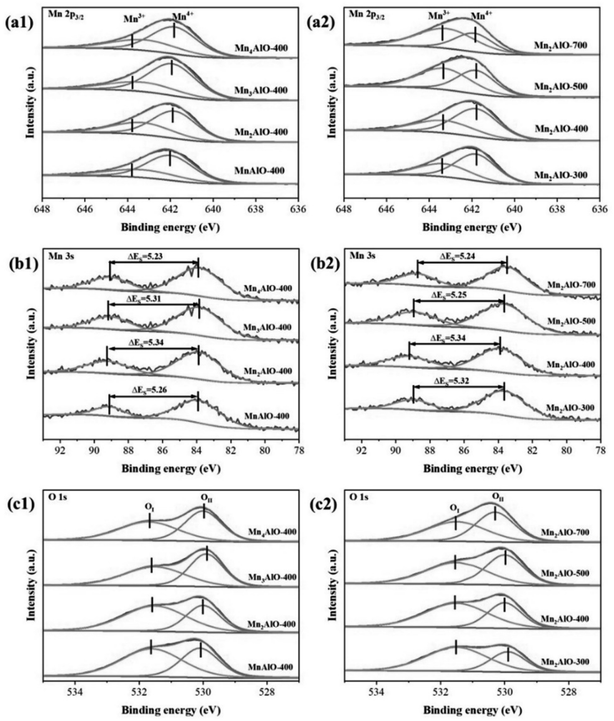
The valence state of Mn also has a strong effect on catalytic ozone decomposition because the mechanism of ozone catalytic decomposition mainly consists of redox steps. The redox activity of Mn-based catalysts is associated with the presence of Mn2+, Mn3+, and Mn4+ ions. Fig. 6 shows the XPS results, which are used to characterize the chemical valence in the catalysts. As shown in Fig. 6a, the Mn 2p3/2 spectra deconvoluted into two peaks with binding energies of 641.8 and 643.2 eV ascribed to Mn3+ and Mn4+, respectively.26,44,45 Previous studies have confirmed that high Mn3+ (oxygen vacancies) content is the key factor to the excellent activity of manganese oxide catalysts.14,20,24,46 When Mn3+ forms on manganese dioxide, an oxygen vacancy will be generated to maintain charge balance, thus an oxygen vacancy and Mn3+ are essentially the same.
A quantitative analysis of the molar ratios of surface Mn3+/Mn4+ is summarized in Table 3. The Mn/Al molar ratios of the precursor and calcination temperature have a remarkable influence on the surface Mn3+/Mn4+ molar ratio, which decreased in the following order: Mn2AlO-400 > Mn3AlO-400 > MnAlO-400 > Mn4AlO-400 and Mn2AlO-400 > Mn2AlO-300 > Mn2AlO-500 > Mn2AlO-700. The average oxidation state (AOS) of Mn was calculated according to:
| AOS = 8.956 − 1.126 × ΔEs | (2) |
| Catalyst | H2-TPR | XPS | ||||||
|---|---|---|---|---|---|---|---|---|
| Mn 2p3/2 | Mn 3s | O 1s | ||||||
| H2 consumption (mmol g−1) | Mn3+ (%) | Mn4+ (%) | Mn3+/Mn4+ | AOS of Mn | OI (%) | OII (%) | OII/OI | |
| MnAlO-400 | 29.26 | 67.59 | 32.41 | 2.09 | 3.03 | 39.42 | 60.58 | 1.54 |
| Mn2AlO-400 | 41.70 | 71.50 | 28.50 | 2.51 | 2.94 | 36.29 | 63.71 | 1.76 |
| Mn3AlO-400 | 50.35 | 69.75 | 30.25 | 2.31 | 2.98 | 48.89 | 51.11 | 1.05 |
| Mn4AlO-400 | 43.24 | 67.24 | 32.76 | 2.05 | 3.07 | 50.15 | 49.85 | 0.99 |
| Mn2AlO-300 | 36.44 | 61.47 | 38.53 | 1.60 | 2.97 | 32.47 | 67.53 | 2.08 |
| Mn2AlO-500 | 36.87 | 44.08 | 55.92 | 0.79 | 3.04 | 45.92 | 54.08 | 1.18 |
| Mn2AlO-700 | 28.59 | 37.77 | 62.23 | 0.61 | 3.06 | 49.77 | 50.23 | 1.01 |
The asymmetric O 1s peaks for the MnxAlO samples can be deconvoluted into two contributions centered at 530 and 531.6 eV, which are attributed to the lattice oxygen (OI) and surface adsorbed oxygen(OII), respectively.46 The surface molar percent of OI and OII and the OII/OI ratios are summarized in Table 3. The OII/OI ratio initially increases with increasing Mn/Al molar ratio, from 1.54 for MnAlO-400 to 1.74 for Mn2AlO-400, then drastically decreases to 1.05 for Mn3AlO-400 and 0.99 for Mn4AlO-400. This implies that the most abundant surface-adsorbed oxygen occurs when the Mn/Al molar ratio in the precursor is 2. This may be owing to the higher surface specific area and narrower pore size, which create more vacancies and unsaturated chemical bonds, thus increasing the adsorbed oxygen ratio on the surface. The calcination temperature also affects the OII/OI molar ratios on the oxide surface. The OII/OI ratio is found to decrease with increasing calcination temperature, from 2.08 for Mn2AlO-300 to 1.01 for Mn2AlO-700. This may be due to the reduced amount of adsorbed oxygen species on the catalyst surface owing to the increased calcination temperature, increased crystallinity of the oxide, the reduction of the specific surface area, and surface defects.
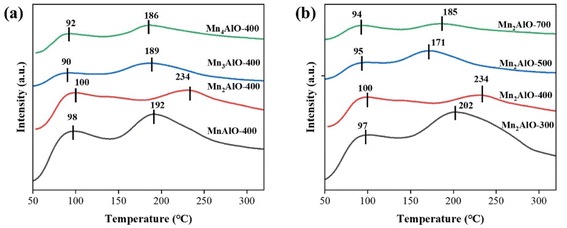
The surface acidity and basicity of MnxAlO were investigated by NH3-TPD (Fig. 7) and CO2-TPD (Fig. 8), respectively. The binding strength between acid sites and NH3 molecules or base sites and CO2 was positively correlated to the desorption temperature. Generally, the acid sites are classified into the weak (<150 °C), medium (150–350 °C) and strong (>350 °C) acid sites.47 In Fig. 7, there are two NH3 desorption peaks near 100 °C and 200 °C, respectively. This indicates that the MnxAlO catalysts possess the weak and medium acid sites distributions on surface. The desorption peak <150 °C is assigned to the physically adsorbed NH3, and the peaks at 150–300 °C correspond to the desorption of NH3 on L-acid and B-acid sites, respectively. B-acid sites, which are weaker than L-acid ones, are attributed to surface protons, whereas L-acid sites are assigned to Al–O–Mn species and containing Al3+ cations predominantly in octahedral sites.48 Fig. 7 shows the Mn/Al molar ratio and calcination temperature affecting on the catalyst surface medium acid sites. The most intensive peak was 234 °C of the Mn2AlO-400 sample, significantly higher than other samples, so it has the strongest acid sites.
Fig. 8 was the CO2-TPD profiles of catalysts. The desorption of CO2 from the all samples, which begins at 150 °C, after reaching maximum at 400–550 °C. The low-temperature desorption peak is assigned to the CO2 adsorbed on OH groups, the intermediate-temperature desorption peak corresponds to the CO2 adsorbed on Mn–O or Al–O pairs, and the high-temperature desorption peak conforms to the desorption of CO2 on O2− anions.48,49 Fig. 8 shows the MnxAlO samples possess the medium and strong basic centers on surface. The strength of basicity increased with increasing Mn/Al molar ratio, and higher temperature calcination weakened the strong basic centers. Ozone was easy to be adsorbed on weak L-acid site and decomposes to form atom oxygen on strong L-acid site.50 The strongest acid site and weaker base site on the surface of Mn2AlO-400 are beneficial to ozone decompose catalytic activity.
3.3 Catalytic activity for ozone decomposition
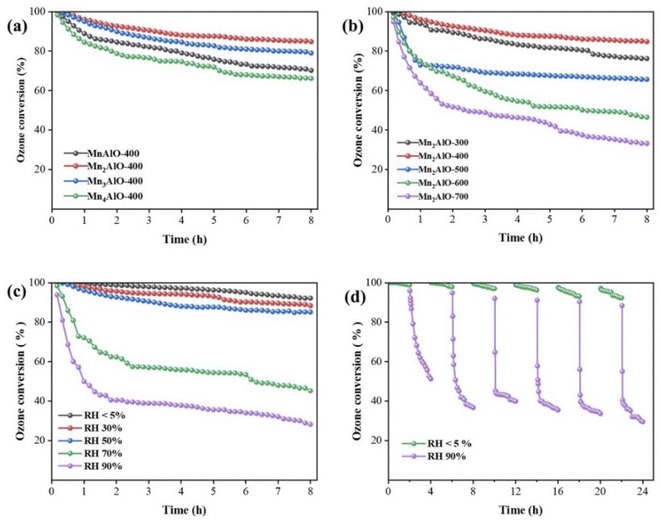
The ozone decomposition activity was evaluated at 30 ± 1 °C, a relative humidity (RH) of 50%, inlet ozone concentration of 40 ± 2 ppm, and space velocity of 550![[thin space (1/6-em)]](https://www.rsc.org/images/entities/char_2009.gif) 000 h−1, the results are shown in Fig. 9. The initial catalytic activity of all prepared catalysts was 100% and the ozone conversion decreased as the reaction continued. The ozone catalytic decomposition performance of the oxides calcinated at 400 °C is demonstrated to be sensitive to Mn/Al molar ratios, as shown in Fig. 9a. The ozone conversion of Mn2AlO-400 after 8 h is 84.8%, followed by Mn3AlO-400 (79.0%), MnAlO-400 (70.2%), and Mn4AlO-400 (66.2%). After calcination at different temperatures, Mn2AlO-400 still has the best catalytic activity, as shown in Fig. 9b. This is related to lager specific surface area, abundant surface oxygen vacancy and adsorbed oxygen species.
000 h−1, the results are shown in Fig. 9. The initial catalytic activity of all prepared catalysts was 100% and the ozone conversion decreased as the reaction continued. The ozone catalytic decomposition performance of the oxides calcinated at 400 °C is demonstrated to be sensitive to Mn/Al molar ratios, as shown in Fig. 9a. The ozone conversion of Mn2AlO-400 after 8 h is 84.8%, followed by Mn3AlO-400 (79.0%), MnAlO-400 (70.2%), and Mn4AlO-400 (66.2%). After calcination at different temperatures, Mn2AlO-400 still has the best catalytic activity, as shown in Fig. 9b. This is related to lager specific surface area, abundant surface oxygen vacancy and adsorbed oxygen species.
We also investigated the ozone decomposition of Mn2AlO-400 under different RH, as shown in Fig. 9c. With increasing RH, the ozone conversion decreases from 92.2% for RH < 5% to 28.2% for RH = 90%. When RH ≤ 50%, the ozone conversion remains above 85% after 8 h. Water is known to inhibit the ozone decomposition of catalysts. To examine the stability and effect of water vapor on the catalytic performance of the Mn2AlO-400 catalyst, onstream reactions at 30 ± 1 °C were carried out in the absence and presence of RH = 90% water vapor, as shown in Fig. 9d. When RH = 90%, the water was introduced into the stream and the ozone conversion decreased sharply from 98.8% to 51.2% within 4 h. When the water vapor was cut off, the ozone conversion nearly recovered. The onstream reaction then continued. This operation cycle was repeated six times and the ozone conversion remained unchanged with or without water vapor. These findings demonstrate that the competitive adsorption of water molecules on the oxygen vacancies block ozone adsorption and decomposition during the reaction process, and that the effect of water on the active site is reversible.46,51
3.4 Catalyst deactivation and regeneration
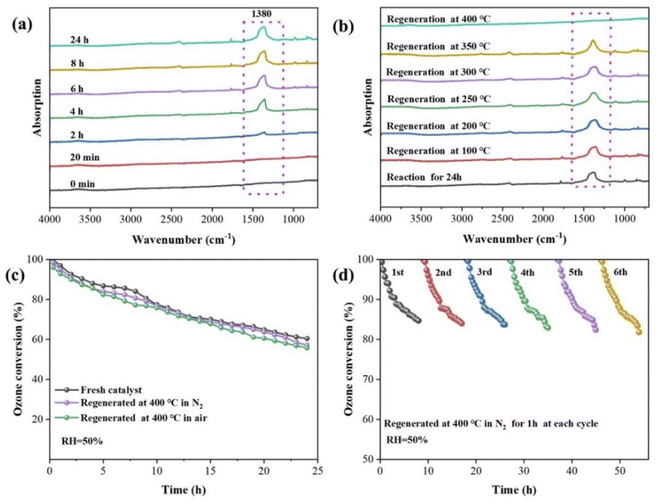
Catalyst deactivation after a period of reaction time can affect practical engineering applications. To investigate the reason for catalyst deactivation and devise a method for catalyst regeneration, the intermediates depositing on the catalyst surface were analyzed via in situ DFT-IR, as shown in Fig. 10. A new peak formed around 1380 cm−1 and gradually increased with ongoing reaction time (Fig. 10a). Combined with previous studies,3,20,52 this peak can be assigned to the generated oxygen-related intermediates (corresponding to peroxide species O22−) on oxygen vacancies, which are highly stable. The enrichment of O22− on oxygen vacancies is therefore the main reason for catalyst deactivation.The regeneration of the deactivated Mn2AlO-400 catalyst was investigated by increasing the temperature in N2 atmosphere (Fig. 10b). The peak at 1380 cm−1 remained basically unchanged when the regeneration temperature was increased from 100 °C to 300 °C, but the peak area gradually decreased when the reaction temperature was increased from 300 °C to 400 °C, and completely disappeared at 400 °C, indicating that the intermediate was stable and desorption was not easy at low temperatures. The ozone conversion performance of the Mn2AlO-400 catalyst before and after regeneration at 400 °C in a N2 and air atmosphere were also investigated, as shown in Fig. 10c. The findings show that the catalytic activity regenerated at 400 °C in N2 could be nearly completely recovered, the catalytic activity is slightly lower in air.
A comparison of the XPS spectra of the Mn2AlO-400 catalysts before and after reaction with ozone, and after regeneration is shown in Fig. 11. After 24 h of reaction, the Mn3+/Mn4+ molar ratio decreased from 2.51 to 1.21, accompanied by an increase of the AOS of Mn from 2.94 to 3.31. In contrast, the OII/OI molar ratio decreased from 1.76 to 0.85, which indicates that the generated oxygen-related intermediates had accumulated on the catalyst surface during the reactions, and that the partial oxygen-related intermediates converted surface lattice oxygen over the oxygen vacancies, resulting in catalyst deactivation.3,20 OIII appeared after 24 h of reaction, which is likely related to the hydroxyl species of surface-adsorbed water molecules because the reaction was carried out at RH = 50%. After thermal regeneration at 400 °C under N2 atmosphere for 2 h, the Mn3+/Mn4+ molar ratio was 2.43, the AOS of Mn was 2.99, and the OII/OI molar ratio was 1.51. The catalyst was almost completely restored to its original state after regeneration at 400 °C, indicating that the generated oxygen intermediates accumulated on the catalyst surfaces were effectively removed. At the same time, a comparison of Al 2p3/2 XPS spectra of Mn2AlO-400 catalysts before and after reaction with ozone, and after regeneration is shown in Fig. 11d. The valence state of Al did not change after reaction 24 h, which indicates that the amorphous Al2O3 has no ozone removal ability at room temperature. The amorphous Al2O3 matrix in mixed oxides plays a supporting role in stabilizing and dispersing MnOx, which is consistent with those reported in the literature.16,53
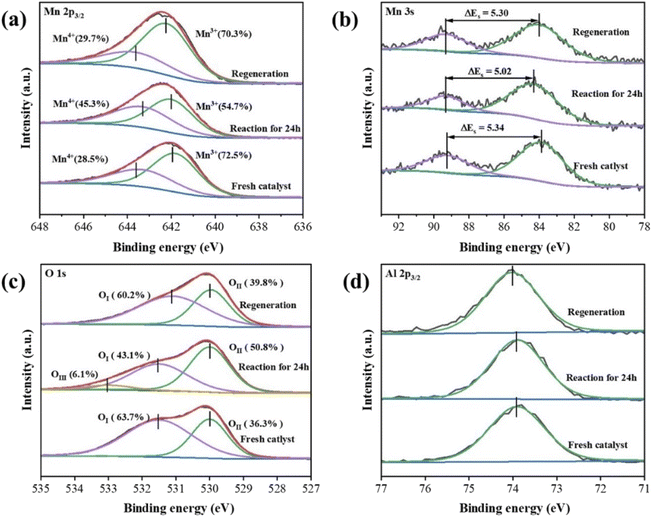 | ||
| Fig. 11 Mn 2p3/2 (a), Mn 3s (b), O 1s(c) and Al (2p3/2) (d) XPS spectra of the Mn2AlO-400 catalyst before and after reaction, and after regeneration at 400 °C under N2 atmosphere for 2 h. | ||
The cycling performances of Mn2AlO-400 for ozone decomposition were further investigated to demonstrate its recoverability and stability. Fig. 11d shows that for Mn2AlO-400, the ozone decomposition performance remained sustainable and similar to that of a fresh catalyst after six cycles. The ozone conversion of the Mn2AlO-400 catalyst remained nearly 81% after six cycles with a total reaction time of 54 h, further suggesting that the catalyst has excellent chemical and structural stability. The promising reuse ability presented during the cycling experiments confirms the potential of the Mn2AlO-400 catalyst for wide industrial applications.
4. Conclusions
A series of mesoporous and dispersed MnxAlO mixed metal oxide catalysts were successfully fabricated on LDH precursors. The morphology, textural properties, and surface chemistry of the as-prepared catalysts were characterized. The Mn/Al atomic ratios and calcination temperature were found to significantly affect the textural properties and catalytic activity for ozone decomposition. The Mn2AlO-400 catalyst showed a substantially better performance than the other catalysts for ozone decomposition, which possibly benefited from a larger surface area, stronger acid sites, more abundant surface oxygen vacancies and surface-adsorbed oxygen species, lower Mn AOS, and temperature reducibility. The in situ DFT-IR and XPS spectra show that generated oxygen-related intermediates accumulate on the catalyst surface during the reactions, and partial oxygen-related intermediates convert surface lattice oxygen over oxygen vacancies, thus resulting in catalyst deactivation. Nevertheless, the deactivated catalyst can be regenerated at 400 °C in air atmosphere. These results provide a new perspective for catalysts applied for ozone decomposition.Conflicts of interest
There are no conflicts to declare.Acknowledgements
This research was supported by the National Key R&D Program of China (No. 2017YFC0211800) and Natural Science Foundation of China (No. 52070010).References
- L. Zhang, S. Wang, C. Ni, M. Wang and S. Wang, Chem. Eng. Sci., 2021, 229, 116011 CrossRef CAS.
- C. Guo, Z. Gao and J. Shen, Build. Environ., 2019, 158, 302–318 CrossRef.
- X. Liang, L. Wang, T. Wen, H. Liu, J. Zhang, Z. Liu, C. Zhu and C. Long, Sci. Total Environ., 2022, 804, 150161 CrossRef CAS PubMed.
- M. Namdari, C.-S. Lee and F. Haghighat, Build. Environ., 2021, 187, 107370 CrossRef.
- S. Oyama, Catal. Rev., 2000, 42, 279–322 CrossRef CAS.
- S. Yang, Z. Zhu, F. Wei and X. Yang, Build. Environ., 2017, 125, 60–66 CrossRef.
- M. Ondarts, J. Outin, L. Reinert, E. Gonze and L. Duclaux, Eur. Phys. J-Spec. Top., 2015, 224, 1995–1999 CrossRef CAS.
- H. Helln, P. Kuronen and H. Hakola, Atmos. Environ., 2012, 57, 35–40 CrossRef.
- W. Yang, J. Ren, J. Li, H. Zhang, K. Ma, Q. Wang, Z. Gao, C. Wu and I. D. Gates, J. Hazard. Mater., 2022, 421, 126639 CrossRef CAS.
- L. Wang, J. Guan, H. Han, M. Yao, J. Kang, M. Peng, D. Wang, J. Xu and J. Hao, Appl. Catal., B, 2022, 306, 121130 CrossRef CAS.
- W. Smith, S. Mao, G. Lu, A. Catlett, J. Chen and Y. Zhao, Chem. Phys. Lett., 2010, 485, 171–175 CrossRef CAS.
- Y. Lin and C. Lin, Environ. Prog., 2008, 27, 496–502 CrossRef CAS.
- W. Hong, J. Ma, T. Zhu, H. He, H. Wang, Y. Sun, F. Shen and X. Li, Appl. Catal., B, 2021, 297, 120466 CrossRef CAS.
- W. Hong, M. Shao, T. Zhu, H. Wang, Y. Sun, F. Shen and X. Li, Appl. Catal., B, 2020, 274, 119088 CrossRef CAS.
- N. Kumar, P. Konova, A. Naydenov, T. Heikilla, T. Salmi and D. Murzin, Catal. Lett., 2004, 98, 57–60 CrossRef CAS.
- X. Shao, X. Li, J. Ma, R. Zhang and H. He, ACS Omega, 2021, 6, 10715–10722 CrossRef CAS PubMed.
- L. Yang, J. Ma, X. Li, G. He, C. Zhang and H. He, Catal. Sci. Technol., 2020, 10, 7671–7680 RSC.
- Z. Hao, D. Cheng, Y. Guo and Y. Liang, Appl. Catal., B, 2001, 33, 217–222 CrossRef CAS.
- L. Zhang, J. Yang, A. Wang, S. Chai, J. Guan, L. Nie, G. Fan, N. Han and Y. Chen, Appl. Catal., B, 2022, 303, 120927 CrossRef CAS.
- W. Hong, T. Zhu, Y. Sun, H. Wang, X. Li and F. Shen, Environ. Sci. Technol., 2019, 53, 13332–13343 CrossRef.
- J. Jia, W. Yang, P. Zhang and J. Zhang, Appl. Catal., A, 2017, 546, 79–86 CrossRef CAS.
- A. Wang, J. Guan, L. Zhang, H. Wang, G. Ma, G. Fan, W. Tang, N. Han and Y. Chen, J. Phys. Chem. C, 2022, 126, 317–325 CrossRef CAS.
- S. Gong, A. Wang, Y. Wang, H. Liu, N. Han and Y. Chen, ACS Appl. Nano Mater., 2020, 3, 597–607 CrossRef CAS.
- X. Li, J. Ma and H. He, J. Environ. Sci., 2020, 94, 14–31 CrossRef PubMed.
- Y. Liu and P. Zhang, J. Phys. Chem. C, 2017, 121, 23488–23497 CrossRef CAS.
- J. Jia, P. Zhang and L. Chen, Appl. Catal., B, 2016, 189, 210–218 CrossRef CAS.
- C. Wang, J. Ma, F. Liu, H. He and R. Zhang, J. Phys. Chem. C, 2015, 119, 23119–23126 CrossRef CAS.
- X. Li, J. Ma, C. Zhang, R. Zhang and H. He, J. Environ. Sci., 2020, 91, 43–53 CrossRef PubMed.
- B. Napruszewska, A. Michalik-Zym, R. Dula, E. Bielanska, W. Rojek, T. Machej, R. Socha, L. Litynska-Dobrzynska, K. Bahranowski and E. Serwicka, Appl. Catal., B, 2017, 211, 46–56 CrossRef CAS.
- Q. Zhao, Q. Liu, C. Song, N. Ji, D. Ma and X. Lu, Chemosphere, 2019, 218, 895–906 CrossRef CAS.
- S. Mo, Q. Zhang, Q. Ren, J. Xiong, M. Zhang, Z. Feng, D. Yan, M. Fu, J. Wu, L. Chen and D. Ye, J. Hazard. Mater., 2019, 364, 571–580 CrossRef CAS.
- M. Castano, R. Molina and S. Moreno, Appl. Catal., A, 2015, 492, 48–59 CrossRef CAS.
- N. Li, J. Cheng, X. Xing, P. Li and Z. P. Hao, Catal. Today, 2019, 327, 382–388 CrossRef CAS.
- S. Zhao, F. Hu and J. Li, ACS Catal., 2016, 6, 3433–3441 CrossRef CAS.
- S. Li, H. Wang, W. Li, X. Wu, W. Tang and Y. Chen, Appl. Catal., B, 2015, 166, 260–269 CrossRef.
- R. Xie, G. Fan, L. Yang and F. Li, Chem. Eng. J., 2016, 288, 169–178 CrossRef CAS.
- M. Sui, B. Duan, L. Sheng, S. Huang and L. She, Chinese J. Catal., 2012, 33, 1284–1289 CrossRef CAS.
- R. Dula, R. Janik, T. Machej, J. Stoch, R. Grabowski and E. M. Serwicka, Catal. Today, 2007, 119, 327–331 CrossRef CAS.
- L. Li, L. Dou and H. Zhang, Nanoscale, 2014, 6, 3753–3763 RSC.
- S. Aisawa, H. Hirahara, H. Uchiyama, S. Takahashi and E. Narita, J. Solid State Chem., 2002, 167, 152–159 CrossRef.
- J. Villegas, O. Giraldo, K. Laubernds and S. Suib, Inorg. Chem., 2003, 42, 5621–5631 CrossRef CAS.
- S. Mo, S. Li, W. Li, J. Li, J. Chen and Y. Chen, J. Mater. Chem. A, 2016, 4, 8113–8122 RSC.
- L. Zou, F. Li, X. Xiang, D. Evans and X. Duan, Chem. Mater., 2006, 18, 5852–5859 CrossRef CAS.
- R. Cao, L. Li and P. Zhang, J. Hazard. Mater., 2021, 407, 124793 CrossRef CAS PubMed.
- A. Ramirez, P. Hillebrand, D. Stellmach, M. May, P. Bogdanoff and S. Fiechter, J. Phys. Chem. C, 2014, 118, 14073–14081 CrossRef CAS.
- G. Zhu, J. Zhu, W. Jiang, Z. Zhang, J. Wang, Y. Zhu and Q. Zhang, Appl. Catal., B, 2017, 209, 729–737 CrossRef CAS.
- Y. Liu, W. J. Yang, P. Zhang and J. Zhang, Appl. Surf. Sci., 2018, 442, 640–649 CrossRef CAS.
- P. Kuśtrowski, L. Chmielarz and E. Bożek, Mater. Res. Bull., 2004, 39, 263–281 CrossRef.
- J. Shen, M. Tu and C. Hu, J. Solid State Chem., 1998, 137, 295–301 CrossRef CAS.
- L. Wei, H. Chen, Y. Wei, J. Jia and R. Zhang, J. Environ. Sci., 2021, 103, 219–228 CrossRef CAS PubMed.
- Y. Yang, J. Jia, Y. Liu and P. Zhang, Appl. Catal., A, 2018, 562, 132–141 CrossRef CAS.
- J. Roscoe and J. D. Abbatt, J. Phys. Chem. A, 2005, 109, 9028–9034 CrossRef CAS PubMed.
- R. Radhakrishnan, S. Oyama, J. G. Chen and K. Asakura, J. Phys. Chem. B, 2001, 105, 4245–4253 CrossRef CAS.
Footnote |
| † Electronic supplementary information (ESI) available. See https://doi.org/10.1039/d2ra04308d |
| This journal is © The Royal Society of Chemistry 2022 |

