 Open Access Article
High-efficiency reduction of p-nitrophenol on green-synthesized gold nanoparticles decorated on ceria nanorods
Thanh Gia-Thien Hoa,
Ba Long Doa,
Bao Van Phamb,
Thi Thuy Van Nguyena,
Hong Phuong Phancd,
Hoang Bao Nguyencd,
Pham Phuong Trang Vob and
Nguyen Tri *ae
*ae
aInstitute of Chemical Technology, Vietnam Academy of Science and Technology, No. 1A, TL29 Str., Thanh Loc Ward, Dist. 12, Ho Chi Minh City, Vietnam. E-mail: ntri@ict.vast.vn
bHo Chi Minh City University of Food Industry, 140 Le Trong Tan Str., Ho Chi Minh City, Vietnam
cVietnam National University Ho Chi Minh City, Linh Trung Ward, Thu Duc Dist., Ho Chi Minh City, Vietnam
dFaculty of Chemical Engineering, Ho Chi Minh City University of Technology (HCMUT), 268 Ly Thuong Kiet Str., Dist. 10, Ho Chi Minh City, Vietnam
eHo Chi Minh City Open University, 97 Vo Van Tan Str., Ho Chi Minh City, Vietnam
First published on 9th September 2022
Abstract
A green synthesis using extract from Citrus maxima peel was developed to fabricate Au–Ce catalysts for the reduction of p-nitrophenol (PNP). Au nanoparticles with a diameter of 6.6 ± 2.5 nm were deposited onto the surface of CeO2 nanorods with a length of 33.1 ± 15.0 nm and a diameter of 7.1 ± 2.1 nm. The mesoporous and non-porous capillary structures of these materials were observed. The interaction between Au and CeO2 increased the specific surface area, pore diameter, and pore volume compared with pure CeO2 (90 m2 g−1, 23.8 Å, and 0.110 cm3 g−1 versus 72 m2 g−1, 23.0 Å, and 0.089 cm3 g−1). The splitting peaks of the surface oxygen and their shifting at lower temperatures compared with CeO2 nanorods were found thanks to the Au–CeO2 interaction, suggesting that their reduction occurred more easily. The synthesized Au–Ce catalysts exhibited excellent activity in the reduction of PNP to p-aminophenol. The 0.2Au–Ce catalyst was the most efficient one for PNP reduction, enabling the conversion of PNP in 30 minutes with a catalyst concentration of 20 mg L−1 and a PNP/NaBH4 molar ratio of 1/200. Moreover, the 0.2Au–Ce catalyst could be reused for at least five consecutive cycles without considerable loss of its activity.
Introduction
In recent years, the applications of nanomaterials have gained several achievements in physical and chemical technologies. Due to the unique properties of nanomaterials, scientists and researchers in different fields have paid much attention to the exploration of their advanced use for important issues in the modern world, such as medicine,1,2 antibacterial,3,4 electronics,5 batteries,6 and remediation.7 Despite the influence in numerous areas, water and wastewater treatments are always a primary concern for humanity. Thanks to nanomaterials, polluted water from rapid industrialization and massive growth in population has been purified, including the elimination, inactivation, or transformation processes of heavy metal and toxic pollutants.8–11 Among these contaminants, p-nitrophenol (PNP) is considered to be the most common organic compound present in wastewater of pharmaceutical, paper, pesticides, and plastic industries. Since PNP is able to cause diverse health problems, like inflammation, coughing, burning, rapid heartbeat, etc., as well as having a huge impact on the environment, scientists have been developing novel techniques for PNP treatment. Among them, using catalysts to convert PNP to less problematic and more useful compounds is a continuing focus.Noble metal-based catalysts (Pd, Pt, Au) have outstanding performance in the catalysis of specific reactions, including hydrogenation and water splitting.12 In addition, their redox potential makes them valuable in the applied multifunctional materials field, especially in the hydrogenation reaction of PNP.13,14 Among them, Au-based catalysts have played an effective role in PNP reduction.13,15 Nevertheless, synthesis of Au nanoparticles (AuNPs) involves huge consumption of chemicals. In contrast, the evolution of green chemistry has been pushing scientists to further approaches to decrease hazardous waste discharged into the environment. In the way of seeking alternatives, using plant species is emerging as a promising solution. Due to some benefits including simple implementation, eco-friendliness to the environment, affordable cost, and abundant supply, taking advantage of plant extracts to reduce metal ions is the next movement in bringing helpful things to human life, particularly the extracts from by-products or waste of these plants.16–18
Citrus maximum (CM) is a Rutaceae family member that is extensively distributed in Southeast Asia, notably in Vietnam. The peel of CM was traditionally regarded as agricultural waste for further treatments.19 It has been proved that numerous flavonoids are found in the peels such as narirutin, naringin, hesperidin, eriocitrin, and neohesperidin.20 These substances are also known to have analgesic, antiviral, anticancer, anti-inflammatory, and antiallergenic properties.21 It is possible to synthesize AuNPs using the peel extract of CM as reducing and capping agent.22 In addition, the growth of plants is usually affected by geographic regions and climatic conditions. For practical uses and scaling-up of phytobiosynthesis techniques, another crucial challenge is how to cheaply extract and store the biomass. Peels of CM may be easily harvested, dried, and preserved for a long time. Because of the characteristics of CM, the proposed approach is more viable and practical. The ability to synthesize AuNPs using CM peel not only offers us a simple biosynthesis approach but is also useful for the beneficial utilization of agricultural waste. Furthermore, as previously reported, our research group successfully manufactured nanosilver using CM peel extract as a reducing and stabilizing agent.23
The discovery of various new supports results in the improvement of many catalysts. In recent decades, ceria (CeO2) has been applied in different areas, such as CO oxidation,24 water–gas-shift reaction,25 oxygen sensors,26 and fuel cells.27 As a consequence of its oxygen storage capacity, CeO2 can transform between oxidizing and reducing form, leading to oxygen mobility, enhancement of the metal-support interaction, and high dispersion of metallic sites. In addition, the shape-dependent property makes CeO2 distinctive in terms of specific surface area and particle size.28 Among different morphologies, the nanorod form is a promising structure on which to load metallic species. The arrangement of lattice fringes is displayed with 3 planes, involving (111), (200), and (220). Among them, the (111) plane is the most stable, the following then are (220) and (200) planes, respectively. It has been reported that the more stable a plane is, the less reactive it is.29,30
In this work, a series of Au-based catalysts supported on CeO2 with various metal loading contents were synthesized by a green and eco-friendly process, using an extract from Pomelo peel (CMP) as a reducing agent for the transformation of Au ions to AuNPs. These samples were used to catalyze PNP hydrogenation to p-aminophenol (PAP) – an important compound in pharmaceutical, cosmetic, and textile industries. The physicochemical characteristics of the catalysts were examined to elucidate the effect of different factors on their performance in the reaction.
Results and discussion
Characterization of catalysts
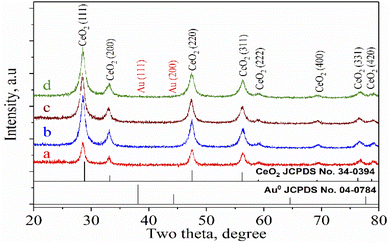
The XRD patterns of CeO2 nanorods and Au–Ce samples are shown in Fig. 1. The XRD results showed the appearance of diffraction peaks of CeO2 nanorods in all samples at 2θ = 28.7, 33.4, 47.7, 56.5, 59.4, 69.7, and 77.1°, corresponding to the face-centered cubic structure of CeO2 (JCPDS no. 34-0394). The CeO2 crystal structure did not change after the Au loading. In addition, no peak of Au0 nanoparticles was observed in the patterns of Au-loaded samples with 0.1 to 0.2 wt% Au. However, Fig. 1 clearly shows that the 0.3Au–CeO2 catalyst has two very weak peaks at 2θ = 38.4° and 43.1° (JCPDS no. 04-0784). These peaks may have resulted from the (111) and (200) facets of Au.31 But, because of the extremely low gold loading (only 0.3 wt%), the gold diffraction peaks are not clearly defined, which is also consistent with previous reports.31,32 The small Au particles estimated by the Debye–Scherrer equation33,34 with sizes of around 1 nm are considered to be below the XRD detection limit,32 which suggests that Au nanoparticles were well dispersed on the surface as well as in the internal structure of the CeO2 nanorods.35 The XRD results also showed no interaction between AuNPs and CeO2 to form a new phase. Based on the highest peak at 2θ = 28.7° of the (111) CeO2 plane, the average crystallite size of samples was determined following the Scherrer equation (eqn (1)),36 being 20.1, 19.7, 19.5, and 19.8 nm for rCe, 0.1Au–Ce, 0.2Au–Ce, and 0.3Au–Ce samples, respectively.
 | (1) |
| Sample | Au,a wt% | SBET,b m2 g−1 | dpore,b Å | Vpore,b cm3 g−1 | Tmax,c °C | Hc,c mmol g−1 |
|---|---|---|---|---|---|---|
| a The quantitative ratio of Au in the three composite samples was analyzed by the ICP-MS method.b BET surface area (SBET), average pore diameter (dpore), and total pore volume (Vpore) were obtained from N2 adsorption isotherm analysis.c The maximal reduction temperature (Tmax) and the hydrogen consumption (Hc) were obtained from H2-TPR results. | ||||||
| r-Ce | — | 72 | 23.0 | 0.089 | 450; 820 | 0.118 |
| 0.1Au–Ce | 0.09 | — | — | — | — | — |
| 0.2Au–Ce | 0.17 | 90 | 23.8 | 0.110 | 380; 450; 730 | 0.149 |
| 0.3Au–Ce | 0.23 | — | — | — | — | — |
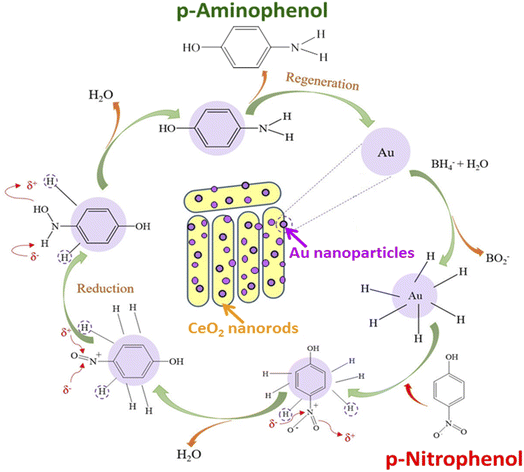
Fig. 2a shows the FT-IR spectra of pure CeO2 nanorods and 0.2Au–Ce nanoparticles. The pure CeO2 spectrum revealed the presence of some absorption bands at 452 cm−1, 1628 cm−1, and 3435 cm−1 (broad) corresponding to CeO2 stretching vibration,37 the molecular H2O (H–O–H) bending,38 and the O–H stretching vibration of hydroxyl functional groups,39,40 respectively. However, the FT-IR spectrum of 0.2Au–Ce sample showed higher signal intensity, proving that Au crystallites were inserted into the CeO2 lattice and highly dispersed on the CeO2 support.10 Besides that, it is possible that organic compounds left in the green-synthesized Au–rCe sample led to this difference. Organic compounds, typically flavonoids, are the main component in the CMP extract, reducing Au3+ and capping the AuNPs on the surface of ceria nanorods to enhance their stability. The mechanism to form green-synthesized gold nanoparticles (Au0) decorated on ceria nanorods (rCe) can be described as in Fig. 3.
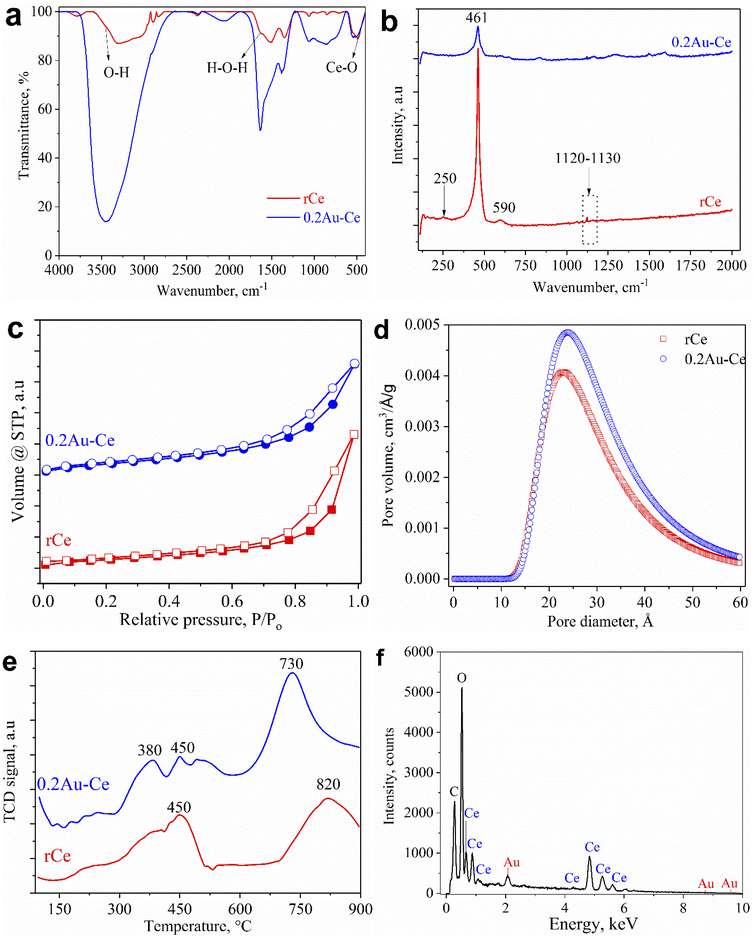 | ||
| Fig. 2 FT-IR (a) and Raman (b) spectra, N2 adsorption/desorption isotherms (c), BJH pore diameter distributions (d), H2-TPR patterns (e), and EDS spectrum (f) of samples. | ||
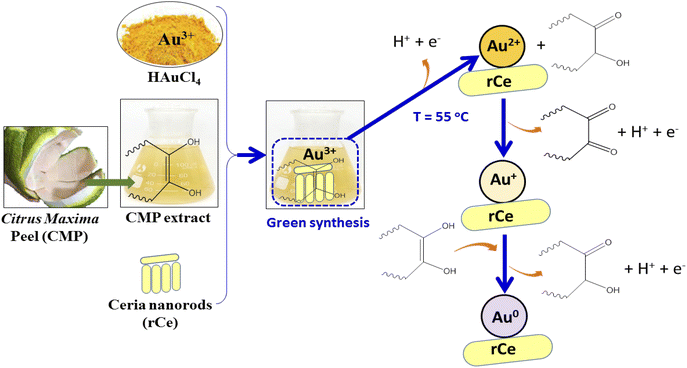 | ||
| Fig. 3 The mechanism to form green-synthesized gold nanoparticles (Au0) decorated on ceria nanorods (r-Ce). | ||
Raman spectra are illustrated in Fig. 2b to examine the structure of rCe and 0.2Au–Ce. Obviously, the sharp and symmetric peak at 461 cm−1 was related to the F2g vibration mode of the fluorite structure of CeO2, which characterized the stretching of the Ce–O bond.41 For pure CeO2, a weak peak located around 250 cm−1 might be attributed to the (111) CeO2 surface,42 which disappeared after Au-loading. On the other hand, a small peak at 590 cm−1 could be detected, being related to the formation of oxygen vacancies in the CeO2 nanorod structure. Two bands in the range of 830–840 cm−1 and 1120–1130 cm−1 were assigned to the stretching vibration of the O–O bond,43 which contributed to the oxygen storage capacity. However, the peak in the first range could not be seen in the spectrum of the rCe sample; this indicated that the presence of Au had a significant impact on CeO2 nanorod structure. Typically, the interaction between Au and CeO2 led to formation of oxygen vacancies and transformation between different Ce oxidation states promoting the catalytic activity.
The porosity of pure CeO2 and as-prepared 0.2 wt% Au sample was analyzed using the N2 adsorption–desorption BET isotherm method. Fig. 2c shows that all samples exhibited type IV isotherms with the H3 class of the IUPAC classification, demonstrating a typical mesoporous structure of the material.42 The adsorption–desorption isotherms almost had no obvious change, showing that the CeO2 nanorod structure was well maintained after Au doping. Fig. 2d illustrates the BJH pore size distribution of the samples in the range of 10–60 Å, hitting a peak at 23–24 Å, conforming to the structural feature obtained from isotherm models. Loading of Au on CeO2 nanorods caused a slight change in pore size, from 23.0 Å of the support to 23.8 Å of 0.2Au–Ce. The textural and structural characteristics of the samples are presented in Table 1. The pure CeO2 possessed a specific surface area of 72 m2 g−1 and pore volume of 0.089 cm3 g−1. Moreover, it could be asserted that adding of Au on CeO2 nanorods led to an increase of the BET surface area and pore volume, to 90 m2 g−1 and 0.110 cm3 g−1, respectively.
The H2-TPR curves of CeO2 nanorods and 0.2Au–Ce are shown in Fig. 2e. For the CeO2 sample, two main peaks were observed, with the highest temperature peak at 820 °C and the other at 450 °C, corresponding to the reduction of lattice oxygen ions of CeO2 and the surface oxygen ions.43 For the Au–Ce catalyst, an additional peak at a lower temperature (380 °C) was observed because of the splitting of the surface oxygen peak, due to the Au–CeO2 interaction. The temperature shift and splitting of the surface oxygen peak have been also reported in previous publications.44 Compared with the pure CeO2 nanorods, the reduction peak of interfacial oxygen of the 0.2Au–CeO2 catalyst appeared at a lower temperature, indicating that the reduction happened more easily. On the other hand, the hydrogen consumption for the reduction of 0.2AuCe catalyst is 1.3 times higher than that for pure CeO2 (Table 1).
The elemental composition of a typical sample, 0.2Au–Ce, was determined by EDS analysis, as shown in Fig. 2f, from which major peaks of elemental Ce, O, C, and Au with a mass percentage ratio of 80.03![[thin space (1/6-em)]](https://www.rsc.org/images/entities/char_2009.gif) :
:![[thin space (1/6-em)]](https://www.rsc.org/images/entities/char_2009.gif) 15.97
15.97![[thin space (1/6-em)]](https://www.rsc.org/images/entities/char_2009.gif) :
:![[thin space (1/6-em)]](https://www.rsc.org/images/entities/char_2009.gif) 3.76
3.76![[thin space (1/6-em)]](https://www.rsc.org/images/entities/char_2009.gif) :
:![[thin space (1/6-em)]](https://www.rsc.org/images/entities/char_2009.gif) 0.24 could be seen. The C composition (3.76 wt%) was detected due to the carbon tape covering the sample or organic compounds remaining in the green-synthesized Au–CeO2 sample (as mentioned in the discussion of FT-IR results). Through the XRD and EDS results, it could be concluded that the AuNPs were present and were well dispersed on the CeO2 nanorod support. However, the Au content determined through the EDS spectrum is higher than the theoretical calculated value (0.2 wt%) and the ICP-MS result (0.17 wt%); this may indicate that Au is more dispersed on the outer surface of the ceria support.
0.24 could be seen. The C composition (3.76 wt%) was detected due to the carbon tape covering the sample or organic compounds remaining in the green-synthesized Au–CeO2 sample (as mentioned in the discussion of FT-IR results). Through the XRD and EDS results, it could be concluded that the AuNPs were present and were well dispersed on the CeO2 nanorod support. However, the Au content determined through the EDS spectrum is higher than the theoretical calculated value (0.2 wt%) and the ICP-MS result (0.17 wt%); this may indicate that Au is more dispersed on the outer surface of the ceria support.
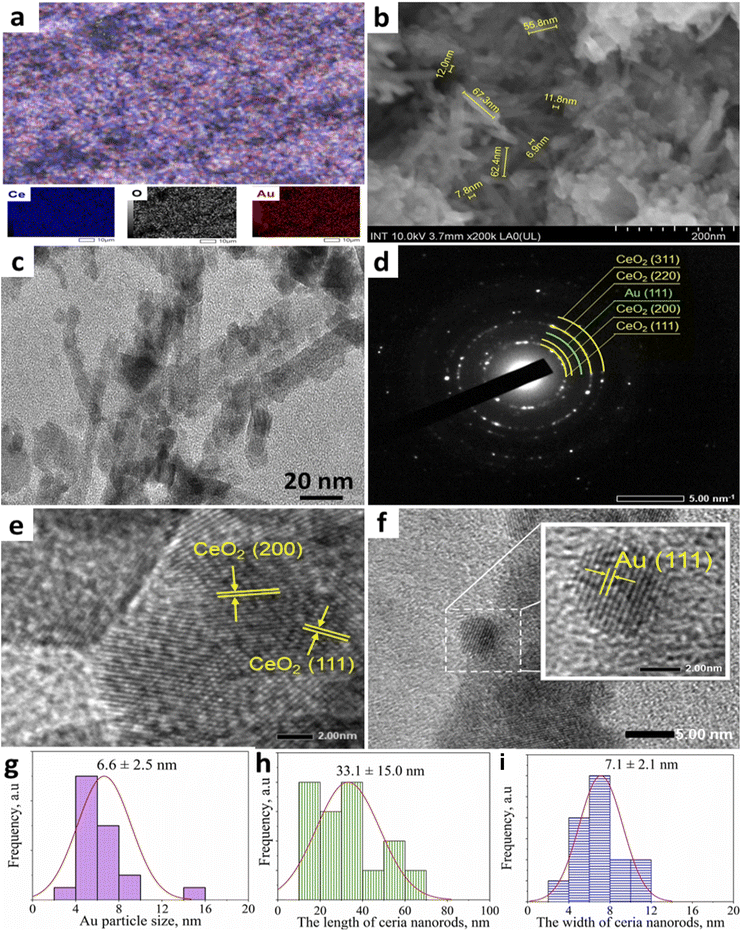
The EDS mapping (Fig. 4a) showed the appearance of Au, Ce, and O elements. Particularly, Au element with bright red spots was uniformly well distributed with Ce (blue) and O (white). FESEM image of the surface of 0.2Au–Ce sample (Fig. 4b) showed that short nanorods with a length of 18–50 nm and a width of 5–10 nm are interspersed with particles of size 5–20 nm; these nanoparticles may be broken CeO2 nanorods or formed AuNPs. The microstructural characteristics of the typical sample 0.2Au–Ce were investigated by HRTEM analysis.35 The bright-field image evidenced that CeO2 consists of three or four closely linked planes next to AuNPs with small size (Fig. 4c). The synthesized CeO2 nanorods could be observed with a length of 50–70 nm and a diameter of 15–20 nm. The SAED image (Fig. 4d) demonstrated that CeO2 nanorods had exposed (111), (200), (220), and (311) planes of structured CeO2 and (111) plane of Au0. In addition, there are certain fringes confirming the characteristic CeO2 lattice and its most stable crystal planes with d-spacings of 0.31 and 0.27 nm corresponding to (111) and (200) planes (Fig. 4e). Moreover, the presence of Au(111) plane with a d-spacing of 0.24 nm has been detected (Fig. 4f), similar to a previous study.45 Besides, the AuNP size distribution observed from the HRTEM image indicated that the spherical AuNPs were spread in a nanosize of 6.6 ± 2.5 nm (Fig. 4g). Also, the length and width of ceria nanorods were demonstrated to be concentrated at 33.1 ± 15.0 nm and 7.1 ± 2.1 nm, respectively (Fig. 4h and k). This result was entirely consistent with the XRD analysis and FESEM image of the sample.
Activity of catalysts
The catalytic performance of selected Au–Ce samples was tested in the hydrogenation of PNP. The effect of the Au concentration loaded on CeO2 nanorods is shown in Fig. 5. The addition of NaBH4 shifted the absorption peak of PNP from 318 to 400 nm due to the formation of p-nitrophenolate ions (O2NC6H4O−) (Fig. 5a). It could be observed that this absorption peak reduced when CeO2 nanorods were added to the PNP solution after 30 minutes of reaction. Meanwhile, the absorption peaks of p-nitrophenolate ions decreased strongly when Au was loaded onto CeO2 nanorods, resulting in a significant increase of PNP conversion into PAP. The C/C0 plot (Fig. 5b), where C and C0 represent the PNP absorbance during the reaction progress and the PNP initial absorbance, respectively, showed that the PNP conversion increased over time for all Au–Ce catalysts. The PNP conversion reached 68, 72, and 99% for 0.1Au–Ce, 0.2Au–Ce, and 0.3Au–Ce catalysts, respectively. The plots of ln(C/C0) revealed that degradation followed first-order kinetics for all catalysts used (Fig. 5c).46 From this plot, the rate constant (k) values were found to be 0.030, 0.150, and 0.033 min−1 for the 0.1Au–Ce, 0.2Au–Ce, and 0.3Au–Ce catalysts, respectively. Hence, the increasing order of catalyst efficiency in PNP reduction was as follows: 0.1Au–Ce < 0.3Au–Ce < 0.2Au–Ce. Therefore, the 0.2Au–Ce sample was chosen as the best catalyst for subsequent investigations. A comparison was attempted to show how other catalysts differed from ours (Table 2). It was clearly evident that the green Au–Ce nanocatalyst could be used as an efficient alternative catalyst for reducing PNP to PAP at room temperature.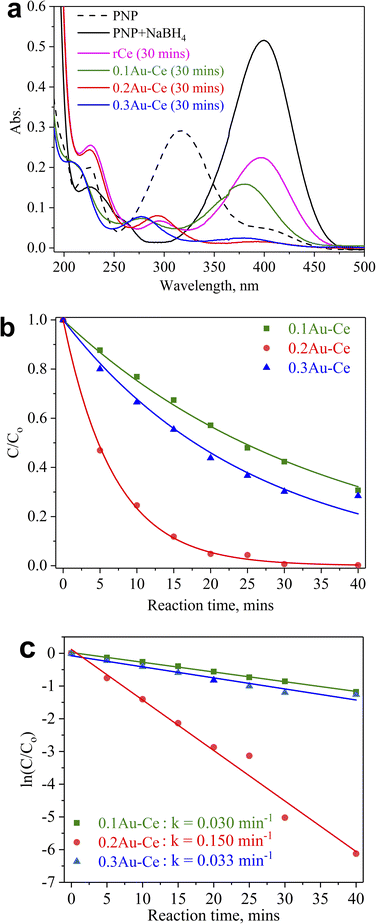 | ||
| Fig. 5 Effect of Au loading on the catalytic activity of the as-prepared Au–Ce samples in PNP hydrogenation. | ||
| Support | PNP conc., mmol L−1 | Catalyst dosage, g L−1 | k, min−1 | Ref. |
|---|---|---|---|---|
| Ceria nanorods | 0.014 | 0.7 | 0.150 | This work |
| Magnetic porous carbon | 0.0003 | 1.0 | 0.600 | 47 |
| Mung bean starch | 0.050 | 2.0 | 0.033 | 48 |
| Olive biomass | 0.029 | 0.25 | 0.080 | 49 |
| Layered double hydroxide (Mg–A–OH) | 0.0003 | 50 | 0.060 | 50 |
| Amino-modified Fe3O4 microspheres | 0.0006 | 1.0 | 0.225 | 51 |
| Cotton fibres | 0.010 | 3.636 | 0.204 | 52 |
| Electroactive polyamic acid | 0.003 | 0.167 | 0.840 | 53 |
Fig. 6a shows the effect of catalyst concentration on catalytic performance. The conversion of PNP increased significantly when the catalyst concentration was raised from 0.3 to 0.7 g L−1, and the complete removal of PNP was observed at a catalyst concentration of 0.7 g L−1. The PNP conversion declined if the catalyst concentration was further increased to 1.0 g L−1. The higher the catalyst content, the larger the contact surface of the catalyst, leading to favorable conditions for PNP to diffuse and adsorb quickly on the catalyst. However, competitive adsorption could occur if the catalyst content was too high, reducing process efficiency. So, 0.7 g L−1 was chosen as the most suitable catalyst concentration for the PNP treatment. Besides, the effect of the PNP/NaBH4 molar ratio on the catalytic activity is exhibited in Fig. 6b. In the presence of NaBH4, the catalytic hydrogenation of PNP into PAP could be described as in Fig. 7.
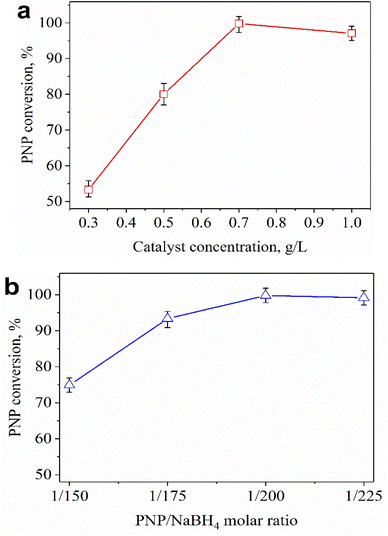 | ||
| Fig. 6 Effect of catalyst concentration (a) and PNP/NaBH4 molar ratio (b) on the catalytic activity of 0.2Au–Ce sample after 30 min. | ||
The highest PNP conversion was achieved with a PNP/NaBH4 molar ratio of 1/200 (Fig. 6b). Raising the PNP/NaBH4 ratio (1/150 → 1/200) led to increased formation of H2 and O2NC6H4O−, which was beneficial for PNP hydrogenation. However, high concentrations of NaBH4 (1/225) could increase the appearance of H2 that competed with the active sites of O2NC6H4O−, reducing the efficiency of the process. Therefore, a suitable PNP/NaBH4 molar ratio for the PNP hydrogenation was 1/200.
It is evident from Fig. 8a that the PNP conversion increased sharply as the reaction time was raised from 1 to 20 minutes, and the conversion was almost complete just after 30 minutes of reaction. Therefore, it could be concluded that the Au addition on CeO2 nanorods brought about high efficiency with a short reaction time in PNP hydrogenation. Also, the catalytic activity was stable in 5 consecutive batches of reaction. The results from the XRD pattern and HRTEM image (Fig. 8b and c) of spent catalyst showed that its phase composition and surface morphology were almost unchanged compared to the fresh one. From there, use of green-synthesized AuNPs supported on CeO2 nanorods could be a promising approach towards efficient PNP hydrogenation.
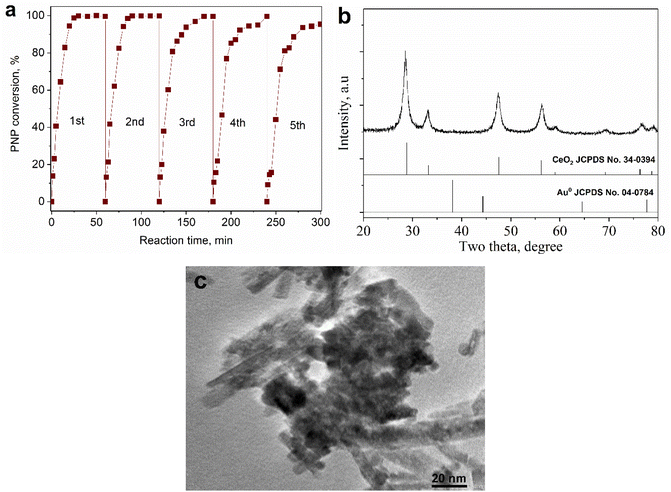 | ||
| Fig. 8 The stability of 0.2Au–Ce catalyst in PNP hydrogenation for 5 cycles (a). XRD pattern (b) and HRTEM image (c) of spent Au–Ce sample. | ||
Experimental
Materials
CMP was collected from Ho Chi Minh City in Vietnam. 50 grams of CM was shredded and dried to constant weight. Then, the sample was mixed with 1000 mL of deionized water and heated to 80 °C for 2 hours under stirring to perform the extraction process. Finally, the CM extract solution was filtered and kept at 4 °C. All chemicals, including HAuCl4·3H2O (≥99.9%), Ce(NO3)3·6H2O (99%), NaOH (≥98%), and NaBH4 (99%), were purchased from Merck and used directly without further purification.Ceria nanorods were synthesized using the hydrothermal method based on our previous publication.29 Firstly, 2.17 grams of Ce(NO3)3·6H2O was dissolved separately in 20 mL of distilled water. Then, 55 mL of 7 M NaOH solution was added drop by drop into the Ce(NO3)3 solution under stirring at 600 rpm within 1 hour. The mixture was transferred into a Teflon autoclave and treated hydrothermally at 130 °C for 5 hours. The obtained precipitate was then separated, washed, and centrifuged with distilled water to remove Na+ ions until neutral. The solid was dried at 80, 100, and 120 °C for 2 hours at each temperature to obtain ceria nanorods (rCe).
AuNP catalysts supported on CeO2 nanorods with different AuNP concentrations (0.1–0.3 wt%) were biosynthesized using CMP extract solution as a reducing agent for Au3+ ions. CeO2 nanorods were added to 4 mL of 1 mM HAuCl4, and the mixture was then sonicated for 15 minutes to increase the HAuCl4 dispersion into the pore and capillary system of CeO2. Next, 1 mL of CMP extract solution was added to the mixture and continuously sonicated for 15 minutes. After that, the mixture was transferred to a heated magnetic stirrer at 300 rpm and kept at 55 °C for 2 hours. Then, the mixture was kept at room temperature for 24 hours before being centrifuged with distilled water to neutral pH. Finally, the solid was dried at 60 °C for 12 hours to obtain the designed catalyst. AuNPs supported on CeO2 nanorods are symbolized by xAu–Ce, representing x wt% Au loaded on rCe as determined by theoretical calculation.
Instrumental measurements
The physicochemical characteristics of as-prepared Au–Ce catalysts were studied by several methods,54 including X-ray diffraction (XRD) using a Bruker D2 Phaser X-ray diffractometer with CuKα radiation and recorded in 2θ = 10–80° using step scan mode with a step size of 0.03°; field emission scanning electron microscopy (SEM) with a Hitachi S4800 instrument; high-resolution transmission electron microscopy (HRTEM) with a JEOL JEM2100 instrument; Fourier-transform infrared (FT-IR) spectroscopy with a Tensor 27 (Bruker) spectrometer in the range 400–4000 cm−1; nitrogen adsorption–desorption isotherms at −196 °C using a Nova 2200e instrument with the sample pre-treated in a 30 mL min−1 nitrogen flow at 300 °C for 2 hours; Raman spectroscopy with a laser Raman spectrometer (Invia, Renishaw, UK); energy-dispersive X-ray spectroscopy (EDS) with a JEOL JST-IT 200 instrument; and hydrogen temperature-programmed reduction (H2-TPR) carried out in a micro-reactor with a gas mixture of 10% H2/N2 at a flow rate of 30 mL min−1 using a gas chromatograph GOW–MAC 69–350 with a TCD detector and a sample of 50 mg. The actual Au elemental composition decorated on CeO2 was precisely determined by using inductively coupled plasma-mass spectrometry (ICP-MS) with a NexION 1000 instrument (PerkinElmer, USA) with the following operating regime: scan mode: peak hopping; dwell time per AMU (ms): 50; integration time (ms): 450; profile: helium (KED).Catalytic tests
The catalytic activity of Au–Ce samples was investigated using the batch method with a total volume of 250 mL in PNP reduction. The PNP concentration used for the reaction was 0.014 mmol L−1. Firstly, a pure nitrogen stream was introduced into the system for 15 minutes before the reaction to remove dissolved oxygen from the solution. Then, NaBH4 was added to the reaction mixture under magnetic stirring at 300 rpm according to the designed molar ratio (PNP/NaBH4 ratios of 1/150, 1/175, 1/200, and 1/225). Next, the Au–Ce catalyst was added to the mixture under stirring. 1 mL collected aliquot was diluted ten times and filtered to remove residual catalysts at an investigated time interval. The reaction solution was analyzed using a UV-visible spectrophotometer (UV-1800, Shimadzu) at the wavelength range of 190–800![[thin space (1/6-em)]](https://www.rsc.org/images/entities/char_2009.gif) nm.
nm.
Conclusions
This work has developed a simple and facile synthesis method to fabricate highly stable Au–Ce catalysts with various Au loadings for PNP reduction. The as-prepared Au–Ce catalysts show good catalytic performance for PNP reduction in the presence of NaBH4, and the increasing order of reaction rate is as follows: 0.1Au–Ce < 0.3Au–Ce < 0.2Au–Ce. The 0.2Au–Ce sample is the most promising since complete PNP conversion takes just 30 minutes with a catalyst concentration of 0.7 g L−1 and a PNP/NaBH4 molar ratio of 1/200. Besides, the 0.2Au–Ce nanocatalyst also shows a high stability after five consecutive catalytic reaction cycles. The results demonstrate that the Au–Ce catalyst is a promising green catalyst with enormous potential for PNP reduction applied in environmental remediation.Author contributions
Thanh Gia Thien Ho: methodology, resources, writing – original draft, validation, investigation, formal analysis. Ba Long Do: methodology, resources, writing – original draft, validation, investigation, formal analysis. Bao Van Pham: methodology, validation, investigation, formal analysis. Thi Thuy Van Nguyen: conceptualization, methodology, resources, writing – original draft, validation, investigation, formal analysis. Hong Phuong Phan: conceptualization, methodology, writing – review & editing, supervision. Hoang Bao Nguyen: methodology, validation, investigation, formal analysis. Phuong Trang Vo Pham: methodology, validation, investigation, formal analysis. Tri Nguyen: conceptualization, methodology, writing – review & editing, supervision.Conflicts of interest
There are no conflicts to declare.Acknowledgements
The study was supported by The Youth Incubator for Science and Technology Programme, managed by Youth Development Science and Technology Center – Ho Chi Minh Communist Youth Union and Department of Science and Technology of Ho Chi Minh City, contract number “46/2021/HĐ-KHCNT-V” signed on 8th December 2021.Notes and references
- J. Damodharan, Mater. Today: Proc., 2021, 37, 383–385 CAS.
- G. Liao, F. He, Q. Li, L. Zhong, R. Zhao, H. Che, H. Gao and B. Fang, Prog. Mater. Sci., 2020, 112, 100666 CrossRef CAS.
- M. G. Correa, F. B. Martínez, C. P. Vidal, C. Streitt, J. Escrig and C. L. de Dicastillo, Beilstein J. Nanotechnol., 2020, 11, 1450–1469 CrossRef CAS.
- G. Nikaeen, S. Abbaszadeh and S. Yousefinejad, Nanomedicine, 2020, 15, 1501–1512 CrossRef CAS.
- D. Jariwala, V. K. Sangwan, L. J. Lauhon, T. J. Marks and M. C. Hersam, Chem. Soc. Rev., 2013, 42, 2824–2860 RSC.
- H. K. Liu, G. X. Wang, Z. Guo, J. Wang and K. Konstantinov, J. Nanosci. Nanotechnol., 2006, 6, 1–15 CrossRef CAS PubMed.
- M. Rizwan, M. Singh, C. K. Mitra and R. K. Morve, J. Nanomater., 2014, 2014, e431787 Search PubMed.
- C. Santhosh, V. Velmurugan, G. Jacob, S. K. Jeong, A. N. Grace and A. Bhatnagar, Chem. Eng. J., 2016, 306, 1116–1137 CrossRef CAS.
- R. K. Thines, N. M. Mubarak, S. Nizamuddin, J. N. Sahu, E. C. Abdullah and P. Ganesan, J. Taiwan Inst. Chem. Eng., 2017, 72, 116–133 CrossRef CAS.
- Z. Keskin, J. Chem. Technol. Biotechnol., 2021, 96, 2275–2282 CrossRef CAS.
- F. Chang, Y. Xie, C. Li, J. Chen, J. Luo, X. Hu and J. Shen, Appl. Surf. Sci., 2013, 280, 967–974 CrossRef CAS.
- M. Zahmakıran and S. Ozkar, Nanoscale, 2011, 3, 3462–3481 RSC.
- H. Guan, C. Chao, Y. Cu, H. Shang, Y. Zhao, S. Yuan and B. Zhang, J. Chem. Sci., 2016, 128, 1355–1365 CrossRef CAS.
- A. Iben Ayad, D. Luart, A. Ould Dris and E. Guénin, Nanomaterials, 2020, 10, 1169 CrossRef PubMed.
- K. Wu, X.-Y. Wang, L.-L. Guo, Y.-J. Xu, L. Zhou, Z.-Y. Lyu, K.-Y. Liu, R. Si, Y.-W. Zhang, L.-D. Sun and C.-H. Yan, Nano Res., 2020, 13, 2044–2055 CrossRef CAS.
- L. Gao, S. Mei, H. Ma and X. Chen, Ultrason. Sonochem., 2022, 83, 105940 CrossRef CAS PubMed.
- M. Meena Kumari, J. Jacob and D. Philip, Spectrochim. Acta, Part A, 2015, 137, 185–192 CrossRef CAS PubMed.
- D. Raghunandan, B. D. Mahesh, S. Basavaraja, S. D. Balaji, S. Y. Manjunath and A. Venkataraman, J. Nanopart. Res., 2011, 13, 2021–2028 CrossRef CAS.
- N. U. Visakh, B. Pathrose, A. Narayanankutty, A. Alfarhan and V. Ramesh, Insects, 2022, 13, 480 CrossRef.
- B. Sapkota, H. P. Devkota and P. Poudel, Evid.-based Complement. Altern. Med., 2022, 8741669 Search PubMed.
- W. Xi, B. Fang, Q. Zhao, B. Jiao and Z. Zhou, Food Chem., 2014, 161, 230–238 CrossRef CAS.
- C. G. Yuan, C. Huo, B. Gui and W. P. Cao, IET Nanobiotechnol., 2017, 11, 523–530 CrossRef.
- N. D. N. Tran, T. H. Bui, A. P. Nguyen, T.-T. Nguyen, V. M. Nguyen, N. L. Duong and T. Nguyen, Green Chem. Lett. Rev., 2022, 15, 18–27 CrossRef CAS.
- J. A. Rodriguez, D. C. Grinter, Z. Liu, R. M. Palomino and S. D. Senanayake, Chem. Soc. Rev., 2017, 46, 1824–1841 RSC.
- Q. Fu, A. Weber and M. Flytzani-Stephanopoulos, Catal. Lett., 2001, 77, 87–95 CrossRef CAS.
- P. Jasinski, T. Suzuki and H. U. Anderson, Sens. Actuators, B, 2003, 95, 73–77 CrossRef CAS.
- L. Fan, C. Wang, M. Chen and B. Zhu, J. Power Sources, 2013, 234, 154–174 CrossRef CAS.
- H.-X. Mai, L.-D. Sun, Y.-W. Zhang, R. Si, W. Feng, H.-P. Zhang, H.-C. Liu and C.-H. Yan, J. Phys. Chem. B, 2005, 109, 24380–24385 CrossRef CAS PubMed.
- S. Afzal, X. Quan and S. Lu, Appl. Catal., B, 2019, 248, 526–537 CrossRef CAS.
- K. Zhou, X. Wang, X. Sun, Q. Peng and Y. Li, J. Catal., 2005, 229, 206–212 CrossRef CAS.
- P. Saikia, A. T. Miah, B. Malakar and A. Bordoloi, Indian J. Eng. Mater. Sci., 2015, 658346 Search PubMed.
- K. M. Saoud and M. S. El-Shall, Catalysts, 2020, 10, 1351 CrossRef CAS.
- M. S. Abdel-Wahab, A. Jilani, I. Yahia and A. A. Al-Ghamdi, Superlattices Microstruct., 2016, 94, 108–118 CrossRef CAS.
- A. Jilani, M. S. Abdel-wahab, A. A. Al-ghamdi, A. sadik Dahlan and I. Yahia, Phys. Rev. B: Condens. Matter, 2016, 481, 97–103 CrossRef CAS.
- P. Huang, F. Wu, B. Zhu, X. Gao, H. Zhu, T. Yan, W. Huang, S. Wu and D. Song, J. Phys. Chem. B, 2005, 109, 19169–19174 CrossRef CAS.
- F. T. L. Muniz, M. A. R. Miranda, C. Morilla dos Santos and J. M. Sasaki, Acta Crystallogr. A: Found. Adv., 2016, 72, 385–390 CrossRef CAS PubMed.
- G. Murugadoss, D. D. Kumar, M. R. Kumar, N. Venkatesh and P. Sakthivel, Sci. Rep., 2021, 11, 1–13 CrossRef PubMed.
- S. Parvathy and B. Venkatraman, Chem. Sci. Trans., 2017, 6, 513–522 CAS.
- L. Pautrot-d′Alençon, P. Barboux and J.-P. Boilot, J. Solgel Sci. Technol., 2006, 39, 261–267 CrossRef.
- M. Farahmandjou, M. Zarinkamar and T. Firoozabadi, Rev. Mex. Fis., 2016, 62, 496–499 CAS.
- C. Schilling, A. Hofmann, C. Hess and M. V. Ganduglia-Pirovano, J. Phys. Chem. B, 2017, 121, 20834–20849 CAS.
- C. Schilling and C. Hess, J. Phys. Chem. C, 2018, 122, 2909–2917 CrossRef CAS.
- V. V. Pushkarev, V. I. Kovalchuk and J. L. d'Itri, J. Phys. Chem. B, 2004, 108, 5341–5348 CrossRef CAS.
- L. Tan, Q. Tao, H. Gao, J. Li, D. Jia and M. Yang, J. Porous Mater., 2017, 24, 795–803 CrossRef CAS.
- Y. Shen, X. Yang, Y. Wang, Y. Zhang, H. Zhu, L. Gao and M. Jia, Appl. Catal., B, 2008, 79, 142–148 CrossRef CAS.
- H. Ha, S. Yoon, K. An and H. Y. Kim, ACS Catal., 2018, 8, 11491–11501 CrossRef CAS.
- Z. Dong, X. Le, Y. Liu, C. Dong and J. Ma, J. Mater. Chem. A, 2014, 2, 18775–18785 RSC.
- S. Chairam, W. Konkamdee and R. Parakhun, J. Saudi Chem. Soc., 2017, 21, 656–663 CrossRef CAS.
- S. Belbekhouche, S. I. Kebe, S. Mahouche-Chergui, M. Guerrouache, B. Carbonnier, M. Jaziri and M. M. Chehimi, Colloids Surf., A, 2017, 529, 541–549 CrossRef CAS.
- N. Arora, A. Mehta, A. Mishra and S. Basu, Appl. Clay Sci., 2018, 151, 1–9 CrossRef CAS.
- M. Ma, Y. Yang, W. Li, R. Feng, Z. Li, P. Lyu and Y. Ma, J. Mater. Sci., 2019, 54, 323–334 CrossRef CAS.
- N. Ullah, A. H. Odda, D. Li, Q. Wang and Q. Wei, Colloids Surf., A, 2019, 571, 101–109 CrossRef CAS.
- G.-H. Lai, T.-C. Huang, B.-S. Huang and Y.-C. Chou, RSC Adv., 2021, 11, 33990–33995 RSC.
- T. Dang-Bao, N. P. Anh, P. H. Phuong, N. T. Van, T. N. Nghia, H. V. Tien and N. Tri, Mater. Trans., 2020, 61, 1294–1300 CrossRef CAS.
| This journal is © The Royal Society of Chemistry 2022 |

