 Open Access Article
Dual-mode sensor based on the synergy of magnetic separation and functionalized probes for the ultrasensitive detection of Clostridium perfringens†
Wenzhuo Wang‡
abc,
Wei Yuan‡bc,
Debao Wange,
Xutao Maibc,
Daoying Wang bcd,
Yongzhi Zhubcd,
Fang Liu*bcd and
Zhilan Sun
 *bcd
*bcd
aSchool of Food and Biological Engineering, Jiangsu University, Zhenjiang 212013, China
bJiangsu Key Laboratory for Food Quality and Safety-State Key Laboratory Cultivation Base, Ministry of Science and Technology, Nanjing 210014, PR China. E-mail: zhilan408@163.com; fangliu82@163.com; Fax: +86 25 84390065; Tel: +86 25 84390065
cInstitute of Agricultural Products Processing, Jiangsu Academy of Agricultural Sciences, Nanjing, 210014, PR China
dKey Laboratory of Cold Chain Logistics Technology for Agro-product, Ministry of Agriculture and Rural Affairs, PR China
eInstitute of Agricultural and Livestock Products Processing, Inner Mongolia Academy of Agricultural and Animal Husbandry Sciences, Hohhot 010031, China
First published on 9th September 2022
Abstract
Clostridium perfringens is an important foodborne pathogen, which has caused serious public health problems worldwide. So, there is an urgent need for rapid and ultrasensitive detection of C. perfringens. In this paper, a dual-mode sensing platform using the synergy between fluorescent and electrochemical signals for Clostridium perfringens detection was proposed. An electrochemical aptasensor was constructed by a dual-amplification technology based on a DNA walker and hybridization chain reaction (HCR). When the C. perfringens genomic DNA was present, it specifically bonded with FAM-labeled aptamer which triggered the DNA walker on hairpin DNA (hDNA) tracks to start the synthesis of double-stranded DNA. HCR occurred subsequently and produced long-chain DNA to absorb more methylene blue (MB). In this cycle, the fluorescent signals of released FAM-labeled aptamer could also be detected. The synergistic effects of MB and FAM significantly improved the sensitivity and accuracy of the dual-mode sensor. As a result, the biosensor displayed an excellent analytical performance for C. perfringens at a concentration of 1 to 108 CFU g−1. A minimum concentration of 1 CFU g−1 and good accuracy were detected in real samples. The proposed ultrasensitive detection method for detecting C. perfringens in food showed great potential in controlling foodborne diseases.
1. Introduction
Clostridium perfringens is a strictly anaerobic bacterium that can form spores with strong stress resistance. It is often found in the intestinal tracts of mammals and poultry1 and can cause various foodborne diseases, such as gas gangrene and human gastrointestinal diseases.2 Moreover, the main source of C. perfringens poisoning is unthoroughly cooked high-protein meat.3 Thus, C. perfringens detection in meat is necessary to ensuring food safety. Commonly used in detecting microbes,4 culture-based assays have the advantages of being inexpensive and reliable but are time-consuming, requiring several days to generate definitive results.5 Thus, a time-saving detection tool to replace current methods should be developed. Some novel molecular detection methods, such as circle amplification,6 loop-mediated isothermal amplification,7 enzyme-linked immunosorbent assay,8 and rolling circle amplification (RCA) have been developed as alternatives to culture-based methods. However, expensive instruments and complex procedures have limited their use.9,10 A cheap, efficient, and maneuverable method for detecting C. perfringens is thus urgently needed.Electrochemical DNA biosensors have played a considerable role in the specific detection of target DNA because of their rapid response, convenient operation, and high sensitivity.11,12 They have been used in many studies about foodborne pathogens. Electrochemical sensors based on silica magnetic particles have been investigated to detect various pathogens, including Salmonella.13 Li et al. proposed an electrochemical sensor that detects Escherichia coli O157:H7 and combines hybridization chain reaction (HCR) and RCA to exert a double amplification effect and achieve high sensitivity at a detection limit of 7 CFU mL−1.14 Guo et al. reported an electrochemical biosensor that adopts a targeted cycle amplification strategy and can detect Salmonella typhimurium and E. coli. They successfully applied the sensor to milk samples.15
Although electrochemical sensors have the advantages of high sensitivity and low detection limit, their development is greatly hindered by stability and accuracy requirements.12,16,17 And the accuracy of the sensor detection platform that relies on a single signal cannot be guaranteed, while two independent signal transduction from different mechanisms can calibrate the system error and mutually verify the dual response. Therefore, dual-mode sensors are gradually favored by researchers. Jia et al. designed a ratio electrochemical aptamer sensor for detecting AFB1.18 The system was detached after the target combined with the aptamer. Consequently, the first electrochemical signal decreased, and the subsequent HCR reaction increased the second electrochemical signal. The concentration of the target was characterized using a dual electrical signal, which significantly improved the stability and efficiency of the sensor. Furthermore, Li et al. proposed a functional extension of this electrochemical sensor, which exhibited dual-mode detection after the electrical molecule was replaced with Ru(bpy)32+ molecule.19 The target detected S. typhimurium in electrochemical and electrochemiluminescence modes, improving detection accuracy and stability. Fahmida et al. successfully developed a dual-mode sensor combining fluorescence and electrochemistry to detect chikungunya virus E1 protein. The research results showed that the dual-mode sensor greatly improves the reliability of the results.20
DNA nanotechnology greatly contributed to signal amplification in electrochemical analysis. DNA walkers can move autonomously along engineered DNA tracks and have been widely used in the fields of material assembly and biosensors because of their remarkable mobility and continuous synthesis ability.21 Single-signal amplification by DNA walkers can directly produce fluorescent or electrochemical signals but has inadequate sensitivity for trace analysis.22 Therefore, sensitivity and signal effect are usually enhanced by combining DNA walker amplification with polymerase chain reaction (PCR), RCA, and HCR. Cai et al. designed a biosensor to detect Staphylococcus aureus at 9 CFU mL−1 detection limit.23 The combination of the strain and its aptamer released a DNA walker and then induced an RCA reaction that generated an amplified signal. Chai et al. proposed an electrochemical biosensor for DNA detection with high sensitivity and low detection limit.24 DNA walkers were modified on the electrode surface, and RCA was activated immediately in the presence of a detection target. The RCA product was cut using Pb2+, and the subsequent decrease in electrochemical signal indicated the change in DNA concentration.
Magnetic separation technologies can improve the detection time of sensors and are widely used due to their low costs, simple operation, and high separation speed.25 Wu et al. constructed a DNA biosensor with magnetic beads to detect the special gene fragments of Bacillus thuringiensis.26 The beads markedly improved detection efficiency. Yang et al. proposed a biosensor based on RCA, used magnetic beads as carriers, and fixed capturing probes on the surfaces of magnetic beads to facilitate separation operation.27
Methylene blue (MB) is a benchmark reporter used in aptamer-based electrochemical sensors and a commonly used redox reporter in DNA-based electrochemical sensors due to its low cost and strong affinity with DNA.28 The DNA double helix is an ideal small-molecule carrier. Two DNA single strands are hybridized to form a long DNA double helix structure. Interestingly, as a small electrochemically active substance, MB can be embedded into a DNA double helix structure through intercalation and adsorption. Zhou et al. explicitly modified a gold electrode with polyclonal antibody.29 HCR reaction occurred on the surface of gold nanoparticles, followed by the embedding of MB, and greatly amplified the electrochemical signal. Cheng et al. proposed a low-cost ultrasensitive electrochemical sensor for microRNA detection, which embeds signal MB molecules into HCR and catalytic hairpin assembly and has 0.037 fM detection limit.30
In this work, a dual-mode DNA sensor based on the synergy between magnetic separation and double amplification technologies was proposed for the accurate and ultrasensitive detection of C. perfringens in meat products. The operation is simple without requiring centrifugation or filtration because Fe3O4 magnetic beads can be separated by applying an external magnetic field, thus saving time, reducing the use of organic reagents, and preventing the physical injury of experimenters and environmental pollution. The simple structure and programmable characteristics of the sensor effectively fix DNA walkers on the surfaces of Fe3O4 magnetic beads through an acylation reaction. DNA walkers provide aptamer binding sites and facilitate the HCR amplification of electrical signals on the surfaces of carboxyl magnetic beads (CMBs). When MB was added, the electrical signal was amplified again, and the sensitivity of the sensor substantially increased. The biosensor exhibited good analytical ability for C. perfringens in a linear range of 1 to 108 CFU g−1. A minimum concentration of 1 CFU g−1 was detected in actual samples, and good recovery was demonstrated.
2. Materials and methods
2.1. Materials and chemicals
DNA markers, CMBs (0.5 μM), CMB preservation buffer, and all oligonucleotides (Table S1†) were purchased from Sangon Biotech Co. Ltd (Shanghai, China). MB, 6-mercapto-1-hexanol, 1-ethyl-3-(3-dimethyl aminopropyl) carbodiimide hydrochloride (EDC), and N-hydroxysuccinimide (NHS) were purchased from Aladdin (Shanghai, China). A bacterial genome DNA extraction kit was obtained from Qiagen Biochemical Technology Co. (Beijing, China). All meat samples (chicken, beef, lamb, pork, and duck) were obtained from a local market in Nanjing, China. Electrochemical impedance spectroscopy (EIS) buffer was prepared as Han described.31 All mediums containing FTG, MRS, and LB broth were obtained from Qingdao Haibo Biotechnology Co., Ltd (Qingdao, China). Electrochemical measurements were carried out by A CHI760E Electrochemistry Workstation (Shanghai Chenhua Instruments Co. Ltd, China). Platinum wire and Ag/AgCl electrodes were used as counter and reference electrodes, respectively. A magnetic glassy carbon electrode (MGCE; 2 mm in diameter) served as a working electrode. Fluorescence intensity was measured with a Ls-55 fluorescence spectrometer (PerkinElmer Company, USA).2.2. Bacterial strains and cultivation
C. perfringens, Pseudomonas putida, Klebsiella pneumoniae, E. coli, P. aeruginosa, Lactobacillus plantarum, Bacillus subtilis, Salmonella enteritidis, Staphylococcus aureus, and Clostridium cochlearium strains were preserved in our laboratory. C. perfringens and C. cochlearium were incubated under anaerobic conditions in FTG overnight at 37 °C. L. plantarum isolates were identified in an MRS broth at 37 °C. The other strains were incubated under aerobic conditions overnight at 28 °C in LB broth.2.3. Functionalization of carboxyl magnetic beads (CMBs)
![[thin space (1/6-em)]](https://www.rsc.org/images/entities/char_2009.gif) :
:![[thin space (1/6-em)]](https://www.rsc.org/images/entities/char_2009.gif) 1, 25 mM) to a CMB solution. After incubation for 1 h, the CMBs were magnetically washed three times and then resuspended in PBS. After activation, 2 μL of solution containing DNA walkers (50 μM), aptamer (50 μM), hairpin DNA1 (H1; 50 μM), and hairpin DNA2 (H2; 50 μM) were added, and the resulting mixture was incubated for 4 h at 25 °C. The CMBs with immobilized oligonucleotides were washed and redispersed in 98 μL of PBS. Approximately 2 μL of the DNA of C. perfringens was supplemented to the suspension and left to react for 12 h at 25 °C. Finally, the CMBs were washed three times and then blocked with BSA, magnetically purified, and redispersed in PBS.
1, 25 mM) to a CMB solution. After incubation for 1 h, the CMBs were magnetically washed three times and then resuspended in PBS. After activation, 2 μL of solution containing DNA walkers (50 μM), aptamer (50 μM), hairpin DNA1 (H1; 50 μM), and hairpin DNA2 (H2; 50 μM) were added, and the resulting mixture was incubated for 4 h at 25 °C. The CMBs with immobilized oligonucleotides were washed and redispersed in 98 μL of PBS. Approximately 2 μL of the DNA of C. perfringens was supplemented to the suspension and left to react for 12 h at 25 °C. Finally, the CMBs were washed three times and then blocked with BSA, magnetically purified, and redispersed in PBS.2.4. Construction of DNA biosensor platform
The electrode was consecutively polished according to the protocol described by predecessors.32 Then, 10 μL of CMB solution subjected to the above reaction was added dropwise to the surface of MGCE. Owing to the magnetic effect, the CMBs aggregated on the electrode surface. After the removal of excess liquid, electrochemical detection was performed. The electrochemical signal was detected through differential pulse voltammetry (DPV) and cyclic voltammetry (CV) scanning from −0.1 V to 0.5 V in the electrolyte and with a scan rate of 100 mV s−1. The EIS was used to characterize the modification of the electrode. The electrode was placed in 5 mM [Fe(CN)6]3−/4− solution (containing 0.1 M KCl) with an open circuit voltage of 5 mV and a scanning frequency of 0.1 to 104 Hz. Fluorescence intensity was measured with a fluorescence spectrometer. The fixed excitation wavelength was 518 nm, the emission wavelength range was 400–800 nm, and the scanning rate was 1500 nm min−1.2.5. Detection of C. perfringens in real samples
Chicken, beef, pork, and duck meat samples were used in analyzing the application capability and analytical reliability of the designed dual-mode sensor in real samples. Artificially contaminated samples with final concentrations of 1 and 10 CFU g−1 were obtained by mixing 9 g of each sample and 1 mL of C. perfringens suspension at concentrations of 10 and 100 CFU mL−1, respectively. Then DNA extraction kits were used to extract DNA. This method was compared with the culture method as gold standard.333. Results and discussion
3.1. Principle of the dual-mode sensor
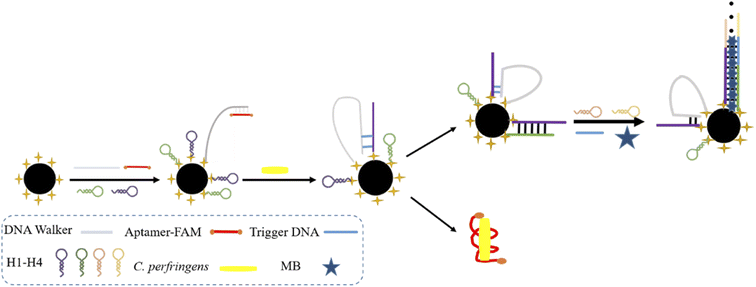
A dual-mode DNA biosensor was proposed based on DNA walker and HCR coupled dual-amplification strategy. Scheme 1 displayed the working principle. DNA walker strands, H1, and H2 were assembled at the surfaces of CMBs through amide bonds. An aptamer modified with fluorescent (FAM) was attached to the DNA walker chain end through base complementary pairing to block the DNA walkers. For analysis, the specific binding of the aptamer to C. perfringens genomic DNA resulted in the stripping of the aptamer from the DNA walker. Subsequently, the fluorescence intensity of the aptamer and C. perfringens DNA complex was detected after the removal of CMBs through magnetic separation. The freed DNA walker strand started the cycle of hybridizing with H1, followed by H1 and H2, through a toehold-mediated strand exchange. The original H1 and H2 were opened and formed dsDNA, which hybridized with anchor DNA H3 and H4 to trigger HCR, generating a longer dsDNA. Finally, MB was embedded, and the current increased. A two-channel strategy was established by combining electrochemical and fluorescent signal intensity for C. perfringens detection. The strategy greatly improved the stability and accuracy of the sensor.3.2. Screening of specific primers for C. perfringens
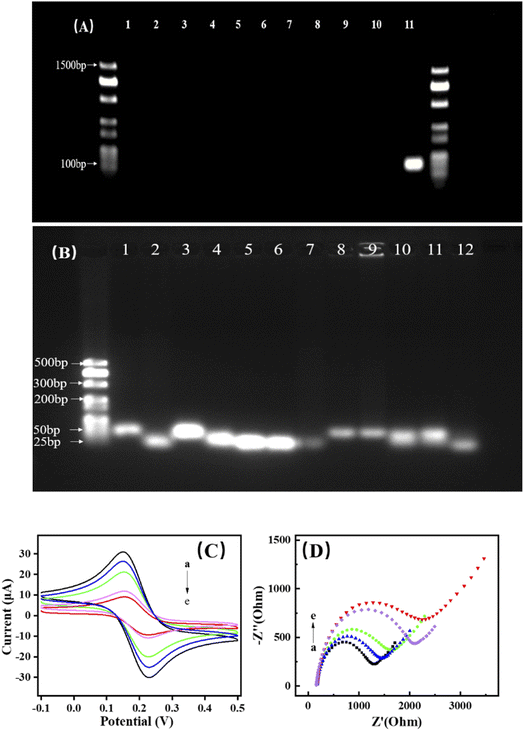
For the screening of the optimal aptamer, PCR was used in screening the primer with high specificity for C. perfringens. Four pairs of primers were selected in this work. The primer CPAF1/CPAR1 was found to have high specificity for C. perfringens. The expected molecular weight of the primer was 100 bp. The PCR products were not observed when the chromosomal DNA samples of P. putida, K. pneumoniae, P. aeruginosa, E. coli, L. planta, S. enteritidis, S. aureus, B. subtilis, and C. cochlearium were used as templates. An expected band was detected at 500 bp after the chromosomal DNA of C. perfringens was used as the template (Fig. 1A). The results showed that CPAF/CAPR can be used as an aptamer to detect C. perfringens.3.3. Feasibility investigation of DNA biosensor
The assembly of oligonucleotide chains was verified through 2% agarose gel electrophoresis (Fig. 1B; lanes 1–7, DNA walker, aptamer, H1–H4, trigger DNA). Given that the aptamer had a smaller molecular weight than the DNA walker, when the aptamer was captured by the DNA walker, the molecular weight was slightly increased compared with that in lane 2 (lane 8). This result indicated that the aptamer was successfully bound to the DNA walker. Through complementary base pairing, the aptamer is subsequently bound to C. perfringens DNA and dissociated from the DNA walker. Thus, the molecular weight was the same as that in lane 1 (lane 9). In the absence of C. perfringens DNA, the assembly of the hairpin DNA was not triggered even in the presence of the trigger DNA (lanes 10–11). The reason was that the aptamer bound to the DNA walker, prevented the opening of the hairpin DNA for subsequent reaction.29 The molecular weight of the band decreased slightly when C. perfringens DNA was added (lane 12) probably because the dilution of the hairpin DNA in the solution resulted in low rate of assembly. When that oligonucleotide chain was fixed on the surfaces of the CMBs, the assembly rate greatly improved.CV (Fig. 1C) and EIS (Fig. 1D) were used in monitoring the stepwise fabrication of the dual-mode DNA biosensor. As shown in Fig. 1C, a bare CMB displayed a pair of the well-defined current peaks of [Fe(CN)6]3−/4− (curve a). The peak current decreased because of the replacement of [Fe(CN)6]3−/4− by the negatively-charged DNA after the substrate DNA strand solution (containing DNA walker, aptamer, H1, and H2) was modified on the CMBs. Upon the blocking of the active sites by BSA, the peak current further decreased (Fig. 1C, curve c). As expected, the peak current showed significant reduction, which was due to the large amount of H3, and H4 was introduced based on the original DNA through HCR (Fig. 1C, curve d). The peak current further decreased after the absorption of MB (Fig. 1C, curve e). As shown in Fig. 1D, the bare CMBs presented small semicircular impedance spectra (Fig. 1D, curve a), which indicated that the CMBs had better electrical conductivity performance; when the substrate DNA strand was modified on the surface of CMBs, the electron transfer resistance (Rct) increased and the radius of impedance spectra became larger (Fig. 1D, curve b). When BSA blocking was performed, due to the poor electrical conductivity, a further wave weakened the electron transport between electrolyte and electrode due to the barrier created by BSA (Fig. 1D, curve c). Then, Rct further increased after a large amount of negatively charged DNA strands were introduced through HCR (Fig. 1D, curve d). The absorption of MB further led to an increase in Rct (Fig. 1D, curve e). Subsequently, the process of sensor was investigated (Fig. S1†). With the rising scan rate, oxidation peak and reduction peak were increased slowly. And the peak responses of the anodic and cathodic about the sensor were proportional to the square root of the scan rate in the range from 20 mV s−1 to 500 mV s−1, indicated the sensor was diffusion controlled. After the continuous modification of oligonucleotide strands and MB on the surface of electrode, Rct increased because of the negative charge of DNA strands and the attachment of MB, and thus similar results were obtained from previous studies.18,22,30
3.4. Amplified signal of the HCR reaction
This experiment was designed to verify the signal amplification efficiency of the HCR reaction. As shown in Fig. 2, when the HCR reaction did not occur, the peak value of the electrical signal only reached approximately 7.29 μA, whereas the value of the electrical signal obtained through the HCR reaction was approximately 33.20 μA. The results showed that the HCR reaction had a strong signal amplification effect. The reason was that HCR is a spontaneous and isothermal amplification process with high-efficiency. The trigger DNA promoted cascade hybridization events that efficiently generated long dsDNA. In addition, the HCR product provided more embedding space for MB, greatly improving the sensitivity of the electrochemical signal channel.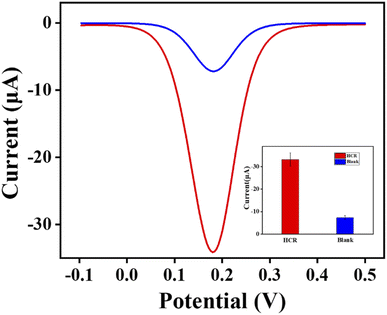 | ||
| Fig. 2 Electrochemical signal amplification effect of HCR reaction. 104 CFU mL−1 C. perfringens DNA was used. | ||
3.5. Electrochemical assay of C. perfringens
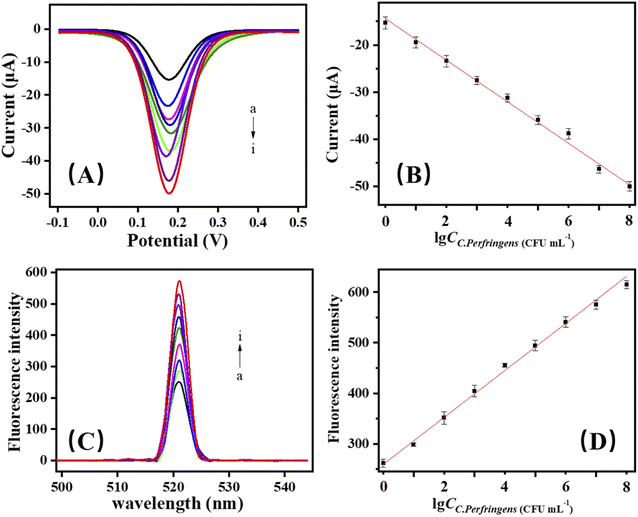
Under optimum conditions (Fig. S2†), the dual-mode DNA biosensor was used to detect C. perfringens. The current and fluorescence calibration curves were determined. DPV signals in response to different concentrations of C. perfringens are displayed in Fig. 3A. As the logarithm concentration of C. perfringens increased in a range of 1 to 108 CFU mL−1, the DPV intensity increased proportionally (Fig. 3B). The linear equation was ΔI = −14.79 − 4.30917![[thin space (1/6-em)]](https://www.rsc.org/images/entities/char_2009.gif) lg
lg![[thin space (1/6-em)]](https://www.rsc.org/images/entities/char_2009.gif) CC. perfringens (R2 = 0.993).
CC. perfringens (R2 = 0.993).
DPV signal responses and linear relationships for detecting C. perfringens were obtained by using the biosensor. The fluorescence was detected in the solution after the removal of CMBs because of the stripping of FAM-labeled aptamer after C. perfringens DNA was added (Fig. 3C). The fluorescence intensity gradually increased, indicating that the fluorescence signal channel can be used as a double verification channel of the biosensor described in this study (Fig. 3D). The linear equation was Δy = 263.46069 + 45.1423![[thin space (1/6-em)]](https://www.rsc.org/images/entities/char_2009.gif) lg
lg![[thin space (1/6-em)]](https://www.rsc.org/images/entities/char_2009.gif) CC. perfringens (R2 = 0.9957).
CC. perfringens (R2 = 0.9957).
3.6. Specificity and stability of DNA biosensors
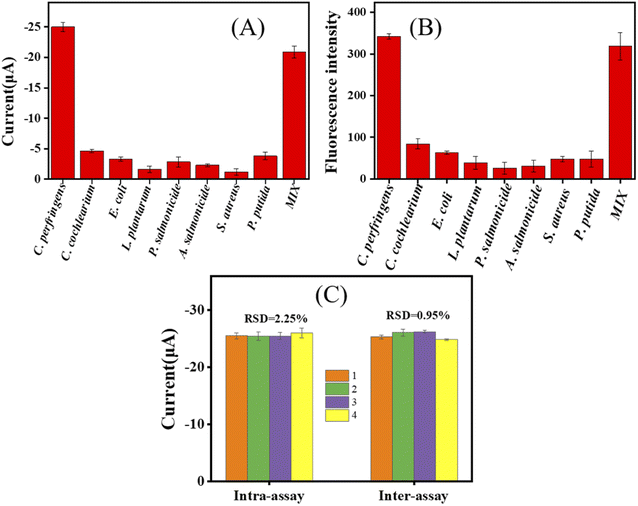
The specificity of the dual-mode DNA biosensor was determined in different bacteria, including P. putida, P. aeruginosa, E. coli, L. plantarum, S. aureus, B. subtilis, and C. cochlearium, and mixed strains. As shown in Fig. 4, when the electrochemical signal of C. perfringens reached 25 μA, high concentrations of the other strains produced signal values of less than 5 μA. The signal value for the mixed strain was 20.87 μA. These results showed that the electrochemical signal channel of the sensor can detect C. perfringens with high sensitivity even in the presence of other strains. Similarly, when the fluorescence signal value of C. perfringens reached 340, high concentrations of other strains produced fluorescence signal values of less than 100. The fluorescence signal value of the mixed strain sample was 320, indicating that the fluorescence signal channel of the sensor can still detect C. perfringens with high sensitivity even in the presence of other strains. The results confirmed the high selectivity of this dual-mode DNA biosensor for the target C. perfringens gene, implying its potential application for real sample detection.The stability of the present dual-mode sensor was evaluated by intra-assay and inter-assay. For the intra-assay, four different MGCEs were used for experiments to obtain the data of four dual-mode sensors in the same batch. For the inter-assay, four parallel experiments were conducted on the same MGCE to obtain the data of four dual-mode sensors in different batches. As shown in Fig. 4C, the relative standard deviation (RSD) of the electrochemical signal value of the dual-mode sensor is all below 3% in both the intra-assay and inter-assay, indicating that the dual-mode sensor has high stability.
3.7. Real sample analysis
For the evaluation of the application of this dual-mode DNA biosensor in meat samples, C. perfringens with known concentration was added to various meat samples (chicken, beef, mutton, duck, and pork). Table 1 shows the detection results of the electrochemical signal channel and fluorescence signal channel assays after the addition of the samples at 1 and 10 CFU g−1. The recovery rates of electrochemical signal channels ranged from 136.1% to 86% with RSD of <6.94%. The fluorescent signal channels ranged from 115.7% to 93.2% with an RSD of <8.94%. These results demonstrated the reliability of the sensor in practical sample analysis. The lowest effective detection concentration of the DNA biosensor in meat products was 1 CFU g−1. In contrast to traditional culture assays, lower concentrations of C. perfringens were not able to be detected and, conversely, could be sensitively detected in the present work. Compared with the different detection methods of C. perfringens reported in recent years, this method has higher sensitivity and shorter time (Table S2†).| Sample | Added (CFU g−1) | Found (CFU g−1) | RSD (%) | The culture-based method found (CFU g−1) | ||
|---|---|---|---|---|---|---|
| E* | F* | E* | F* | |||
| a E*: electrochemical signal channel; F*: fluorescence signal channel. —: not detected. | ||||||
| Chicken | 1 | 1.12 | 1.03 | 5.59 | 5.10 | — |
| 10 | 10.17 | 11.10 | 0.76 | 8.19 | 15 | |
| Beef | 1 | 1.34 | 0.93 | 5.72 | 8.94 | — |
| 10 | 13.61 | 9.93 | 1.71 | 1.00 | 10 | |
| Duck | 1 | 1.04 | 0.97 | 3.85 | 3.07 | — |
| 10 | 10.65 | 11.57 | 6.94 | 5.48 | 20 | |
| Mutton | 1 | 0.98 | 1.01 | 2.78 | 3.75 | — |
| 10 | 8.75 | 11.28 | 5.35 | 3.56 | — | |
| Pork | 1 | 0.86 | 0.96 | 2.90 | 6.46 | — |
| 10 | 9.08 | 11.50 | 4.92 | 4.34 | 15 | |
4. Conclusion
A dual-mode sensor for detecting C. perfringens DNA was successfully constructed based on the dual effects of fluorescent and electrochemical signals. The aptamer considerably increased the specificity of the sensor, and the occurrence of HCR reaction and the insertion of MB facilitated double signal amplification. Through the fluorescence modification of the aptamer, the mutual verification of the two signal channels was achieved, making the results reliable. Meanwhile, the proposed biosensor exhibited high specificity, sensitivity, and good interference resistance, which could identify C. perfringens in mixed samples. In addition, this method has been used for the detection of C. perfringens in actual herd meat, indicating that this method has great potential in environmental monitoring and food safety.Author contributions
Wenzhuo Wang: conceptualization, methodology, software, writing – original draft, formal analysis. Wei Yuan: methodology, writing – review & editing, formal analysis, supervision, data curation. Debao Wang: supervision, validation, investigation. Xutao Mai: conceptualization, supervision. Daoying Wang: conceptualization, supervision, funding acquisition. Yongzhi Zhu: conceptualization, supervision. Fang Liu: supervision, validation, investigation, funding acquisition. Zhilan Sun: conceptualization, methodology, writing – review & editing, supervision, validation, formal analysis, funding acquisition.Conflicts of interest
There are no conflicts to declare.Acknowledgements
This study was supported by the Innovation of Agricultural Science and Technology of Jiangsu Province (CX(22)3063), the National Natural Science Foundation of China (31972140), the Earmarked Fund for Modern Agro-industry Technology Research System (CARS-41), Inner Mongolia Autonomous Region Science and Technology Planning Project (2021GG0347), Inner Mongolia Agriculture and Animal Husbandry Innovation Fund (2022CXJJM08), the North Jiangsu Science and Technology Special Project of Jiangsu Province Policy Guidance Program (XZ-HA2021010).References
- W. S. Hu, H. Kim and O. K. Koo, Anaerobe, 2018, 52, 115–121, DOI:10.1016/j.anaerobe.2018.06.011.
- J. Hong, J. Food Saf., 2017, 37 DOI:10.1111/jfs.12362.
- J. E. Grass, L. H. Gould and B. E. Mahon, Foodborne Pathog. Dis., 2013, 10, 131–136, DOI:10.1089/fpd.2012.1316.
- G. B. Priya, R. K. Agrawal, A. A. P. Milton, M. Mishra, S. K. Mendiratta, R. K. Agarwal, A. Luke, B. R. Singh and D. Kumar, Anaerobe, 2018, 54, 178–187, DOI:10.1016/j.anaerobe.2018.09.005.
- Z. Anwar, S. B. Regan and J. Linden, J. Visualized Exp., 2019, 152 DOI:10.3791/59931.
- A. A. P. Milton, K. M. Momin, G. B. Priya, S. Ghatak, P. N. Gandhale, M. Angappan, S. Das and A. Sen, Anaerobe, 2021, 69, 102324, DOI:10.1016/j.anaerobe.2021.102324.
- T. Sridapan, W. Tangkawsakul, T. Janvilisri, W. Kiatpathomchai, S. Dangtip, N. Ngamwongsatit, D. Nacapricha, P. Ounjai and S. Chankhamhaengdecha, PLoS One, 2021, 16, e0245144, DOI:10.1371/journal.pone.0245144.
- M. T. McCourt, D. A. Finlay, C. Laird, J. A. Smyth, C. Bell and H. J. Ball, Vet. Microbiol., 2005, 106, 259–264, DOI:10.1016/j.vetmic.2004.12.023.
- A. A. P. Milton, K. M. Momin, S. Ghatak, G. B. Priya, M. Angappan, S. Das, K. Puro, R. K. Sanjukta, I. Shakuntala, A. Sen and B. K. Kandpal, Heliyon, 2021, 7, e05941, DOI:10.1016/j.vetmic.2004.12.023.
- K. M. Momin, A. A. P. Milton, S. Ghatak, S. C. Thomas, G. B. Priya, S. Das, I. Shakuntala, R. Sanjukta, K. U. Puro and A. Sen, Mol. Cell. Probes, 2020, 50, 101510, DOI:10.1016/j.mcp.2020.101510.
- B. Ema, A. Nw, Y. C. Xu, S. D. Gang and D. Nna, Food Control, 2022, 135, 108811, DOI:10.1016/j.foodcont.2022.108811.
- C. Xu, M. Lin, T. Wang, Z. Yao, W. Zhang and X. Feng, Food Control, 2022, 137, 108934, DOI:10.1016/j.foodcont.2022.108934.
- S. Liébana, D. Brandão, P. Cortés, S. Campoy, S. Alegret and M. I. Pividori, Anal. Chim. Acta, 2016, 904, 1–9, DOI:10.1016/j.aca.2015.09.044.
- Y. Li, H. Liu, H. Huang, J. Deng, L. Fang, J. Luo, S. Zhang, J. Huang, W. Liang and J. Zheng, Biosens. Bioelectron., 2020, 147, 111752, DOI:10.1016/j.bios.2019.111752.
- Y. N. Guo, Y. Wang, S. Liu, J. H. Yu, H. Z. Wang, X. K. Liu and J. D. Huang, Microchim. Acta, 2017, 184, 745–752, DOI:10.1007/s00604-016-2017-y.
- Z. Zhang, J. Zhou and X. Du, Micromachines, 2019, 10(6) DOI:10.3390/mi10040222.
- C. Y. Wu, X. C. Wu, F. Hou, L. A. Wu and G. X. Liu, Food Control, 2022, 139, 109066, DOI:10.1016/J.FOODCONT.2022.109066.
- F. Jia, D. Liu, N. Dong, Y. Li, S. Meng and T. You, Biosens. Bioelectron., 2021, 182, 113169, DOI:10.1016/j.bios.2021.113169.
- J. Li, J. Jiang, Y. Su, Y. Liang and C. Zhang, Anal. Chim. Acta, 2021, 1188, 339176, DOI:10.1016/j.aca.2021.339176.
- Z. L. Qiu, D. C. Fan, X. H. Xue, S. J. Guo, Y. X. Lin, Y. T. Chen and D. A. P. Tang, Chemosensors, 2022, 10(7) DOI:10.3390/chemosensors10070252.
- Z. Xu, L. Liao, Y. Chai, H. Wang and R. Yuan, Anal. Chem., 2017, 89, 8282–8287, DOI:10.1021/acs.analchem.7b01409.
- T. Yan, L. Zhu, H. Ju and J. Lei, Anal. Chem., 2018, 90, 14493–14499, DOI:10.1021/acs.analchem.8b04338.
- R. Cai, S. Zhang, L. Chen, M. Li, Y. Zhang and N. Zhou, ACS Appl. Mater. Interfaces, 2021, 13, 4905–4914, DOI:10.1021/acsami.0c22062.
- H. Chai, M. Wang, C. Zhang, Y. Tang and P. Miao, Bioconjugate Chem., 2020, 31, 764–769, DOI:10.1021/acs.bioconjchem.9b00861.
- R. Möller and W. Fritzsche, Curr. Pharm. Biotechnol., 2007, 8, 274–285, DOI:10.2174/138920107782109967.
- L. Wu, X. Xiao, K. Chen, W. Yin, Q. Li, P. Wang, Z. Lu, J. Ma and H. Han, Biosens. Bioelectron., 2017, 92, 321–327, DOI:10.1016/j.foodcont.2022.109066.
- X. Yang, K. Yang, X. Zhao, Z. Lin, Z. Liu, S. Luo, Y. Zhang, Y. Wang and W. Fu, Analyst, 2017, 142, 4661–4669, 10.1039/C7AN01438D.
- N. Arroyo-Curras, P. Dauphin-Ducharme, K. Scida and J. L. Chavez, Anal. Methods, 2020, 12, 1288–1310, 10.1039/D0AY00026D.
- J. Zhou, M. Xu, D. Tang, Z. Gao, J. Tang and G. Chen, Chem. Commun., 2012, 48, 12207–12209, 10.1039/C2CC36820J.
- H. Cheng, W. Li, S. Duan, J. Peng, J. Liu, W. Ma, H. Wang, X. He and K. Wang, Anal. Chem., 2019, 91, 10672–10678, DOI:10.1021/acs.analchem.9b01947.
- S. Han, W. Liu, S. Yang and R. Wang, ACS Omega, 2019, 4, 11025–11031, DOI:10.1021/acsomega.9b01166.
- J. Li, Int. J. Electrochem. Sci., 2020, 15, 2727–2738, DOI:10.20964/2020.03.62.
- T. Sridapan, W. Tangkawsakul, T. Janvilisri, W. Kiatpathomchai and S. Chankhamhaengdecha, PLoS One, 2021, 16, e0245144, DOI:10.1371/journal.pone.0245144.
Footnotes |
| † Electronic supplementary information (ESI) available. See https://doi.org/10.1039/d2ra04344k |
| ‡ Wenzhuo Wang and Wei Yuan contributed equally to this article. |
| This journal is © The Royal Society of Chemistry 2022 |

