 Open Access Article
Corncob biochar combined with Bacillus subtilis to reduce Cd availability in low Cd-contaminated soil†
Yilin Yanga,
Xiaojun Hu *a,
Huifeng Wang*a,
Xinling Zhonga,
Kaishan Chena,
Biao Huangb and
Chunxiang Qianc
aSchool of Chemical and Environmental Engineering, Shanghai Institute of Technology, Shanghai 201418, China. E-mail: hu-xj@sit.edu.cn; hfwang@sit.edu.cn
bInstitute of Soil Science, Chinese Academy of Sciences, Nanjing, Jiangsu 210008, China
cSchool of Materials Science and Engineering, Southeast University, Nanjing, Jiangsu 211189, China
First published on 24th October 2022
Abstract
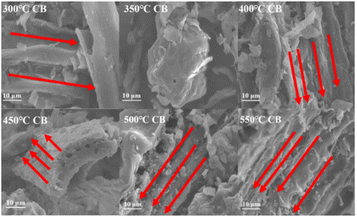
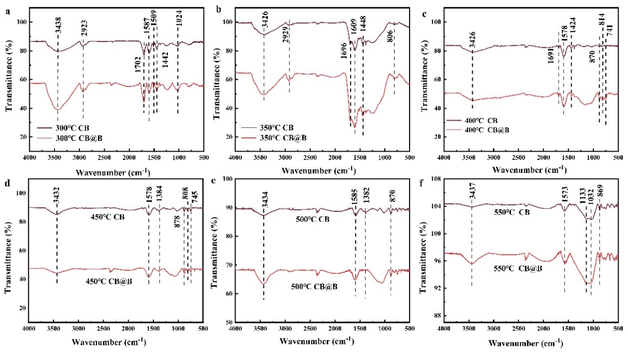
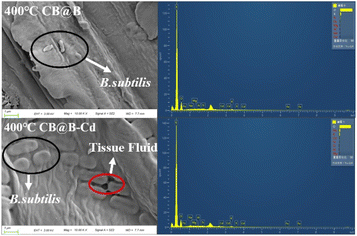
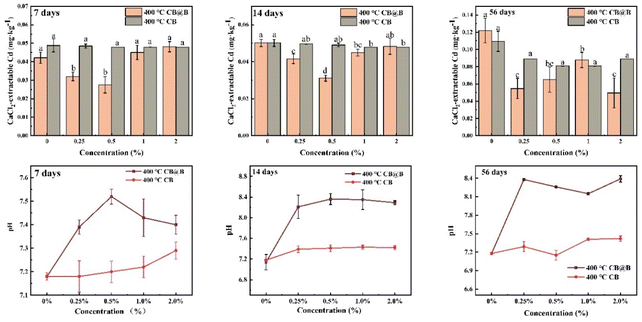
Soil contamination by heavy metals such as Cd can pose a risk to the environment and human health. However, Cd is difficult to immobilize at low concentration levels in soil. Individually, Bacillus subtilis and biochar have been shown to be inefficient at immobilizing Cd in soil. In this study, corncob biochar was generated at different pyrolysis temperatures (300 °C-550 °C), and the Cd immobilization efficiency and performance of corncob biochar loaded with B. subtilis (CB@B) and corncob biochar alone (CB) were evaluated in solutions and in soil. The characterization (SEM and FTIR) of CB generated at different pyrolysis temperatures and CB generated at different pyrolysis temperatures in CB@B (300 °C-550 °C) indicated that a superior pore structure and abundant O-functional groups were obtained at a pyrolysis temperature of 400 °C for both CB@B and CB. The X-ray diffraction and X-ray photoelectron spectroscopy results indicate that the formation of Cd compounds was associated with the positive combined biosorption effect of the bacteria and biochar, electronic adsorption, activity of the O-functional groups (C![[double bond, length as m-dash]](https://www.rsc.org/images/entities/char_e001.gif) O, COOH, OH, and Si–O–Si), and complexation between extracellular substances and Cd2+. Adsorption experiments were conducted in a solution to assess the effects of various operating parameters such as the time, pH, and adsorbent dose. The 400 °C-CB@B and 400 °C-CB samples achieved the largest reductions in the Cd concentration at 81.21% and 5.70%, respectively. Then, CaCl2 extraction experiments were conducted in soil, and using 0.25%-CB@B, a 55.21% decrease was realized in the Cd concentration after 56 days and a 16.71% increase was realized in soil pH to 8.38. No significant difference was observed in the CB-treated groups, among which 1.0%-CB achieved the largest reduction of 26.08% after 56 days and a 3.20% increase in the soil pH to 7.41. The Tessier sequential extraction method obtained similar trends. Overall, 400 °C-CB@B demonstrated outstanding immobilization efficiency and durability, indicating that it provided a safe and nutrient-rich habitat for B. subtilis to realize a synergistic effect for Cd immobilization.
O, COOH, OH, and Si–O–Si), and complexation between extracellular substances and Cd2+. Adsorption experiments were conducted in a solution to assess the effects of various operating parameters such as the time, pH, and adsorbent dose. The 400 °C-CB@B and 400 °C-CB samples achieved the largest reductions in the Cd concentration at 81.21% and 5.70%, respectively. Then, CaCl2 extraction experiments were conducted in soil, and using 0.25%-CB@B, a 55.21% decrease was realized in the Cd concentration after 56 days and a 16.71% increase was realized in soil pH to 8.38. No significant difference was observed in the CB-treated groups, among which 1.0%-CB achieved the largest reduction of 26.08% after 56 days and a 3.20% increase in the soil pH to 7.41. The Tessier sequential extraction method obtained similar trends. Overall, 400 °C-CB@B demonstrated outstanding immobilization efficiency and durability, indicating that it provided a safe and nutrient-rich habitat for B. subtilis to realize a synergistic effect for Cd immobilization.
1 Introduction
Soil pollution, particularly contamination by heavy metals such as cadmium (Cd), is deemed a serious environmental concern.1–3 The Yangtze River Delta is one of the most developed areas in eastern China, and its soil has been contaminated by the occurrence of heavy metals caused by intensive anthropogenic activities.4,5 Cd contamination of agricultural soil mainly results from human activities such as chemical fertilization and municipal waste extraction and incineration.6 Cd easily accumulates in various plant tissues, and it can negatively affect human health when it enters the food chain.7 Excess Cd in the human body may damage the kidneys and liver, increase the risk of upper gastrointestinal cancer, and cause neurological disorders.8,9Techniques such as chemical/biological leaching and plant extraction have been used to extract Cd from contaminated soil. Another approach is solidification/stabilization using natural or chemical/biosynthetic amendments to reduce the mobility and bioavailability of Cd in the soil.10–13 Stabilization has been successfully applied to the remediation of Cd-contaminated agricultural soil because of its economic efficiency, environmental compatibility, and adaptability to the growth cycle of crops.14,15 Biochar is a common organic material used for stabilization because of its low cost and applicability to energy production and climate change mitigation through carbon sequestration.16–18 Corncob biochar is obtained via pyrolysis, and it contains high levels of carbon and lignocellulosic biomass15 with a high surface area.19,20 However, unmodified biochar is generally inefficient at removing heavy metals from solutions. Thus, various physical modifications and chemical modifications to biochar, such as particle size modification,21 acid modification, alkaline modification,22,23 loading with metal oxides24 or carbon materials, and combination with nanotechnology, have been investigated to increase its heavy-metal-removal efficiency. However, the above synthetic amendments often employ potentially toxic chemicals that pose a further risk to the environment and reduce their sustainability.25
In contrast, microbial amendments employ green materials and consume less energy and natural resources than the abovementioned techniques. Microbial amendments are an efficient, ecofriendly, and cost-effective method for remediating Cd-contaminated agricultural soil.26 Heavy-metal-resistant bacteria such as Bacillus megaterium H3 and Neorhizobium huautlense T1–17 have been shown to significantly reduce Cd levels in the roots and grains of rice plants.10 Bacillus subtilis (B. subtilis) can resist the stress from Cd adsorption, and the intracellular adsorption is relatively stable; consequently, Cd is generally not released back into the environment.27,28 Moreover, B. subtilis produces bacteriocins that have broad spectrum antibacterial properties with significant acid, alkali, and high temperature resistances29 while being harmless to humans.30,31 In addition, combining biochar and microorganisms allows the former to provide essential nutrients and attachment points for the latter, which facilitates the survival and growth of exogenous bacteria when introduced to new soil32,33 and reduces the nutritional deficiency of the soil.34 Therefore, amendments combining biochar and bacteria have been widely used for soil remediation.
Most remediation studies have focused on soils with moderate to severe levels of heavy metal pollution.35–37 Low concentration levels of soil pollution are most common,38 but only few studies have focused on low Cd-contaminated soil. Moreover, low levels of Cd contamination may increase the risk of Cd accumulation in crops. Furthermore, most remediation studies on Cd-contaminated soil using bacterial agents and biochar have focused on the individual efficiency of the bacterial agents or biochar and have ignored the interaction between them. In this study, an ecofriendly and cost-effective amendment combining corncob biochar with B. subtilis was applied to treat low Cd-contaminated soil. The stabilization efficiency, equilibrium, optimal dosage, and optimal amendment time were assessed. The primary objectives were to (1) prepare corncob biochar (CB) at different pyrolysis temperatures and characterize CB loaded with B. subtilis (CB@B) and CB alone; (2) determine the CB and CB@B samples with the best Cd adsorption performances in a solution; and (3) explore the Cd adsorption mechanisms of the best CB and CB@B samples in soil.
2 Materials and methods
2.1 Preparation, synthesis, and characterization
Corncobs were crushed and passed through a 100-mesh sieve. They were then pyrolyzed in a tubular furnace (Droide Instrument and Equipment Co., Ltd., Shanghai, China) under continuous N2 flow at a heating rate of 5 °C min−1 until the selected pyrolysis temperature was reached (300 °C, 350 °C, 400 °C, 450 °C, 500 °C, and 550 °C), which was then maintained for 2 h. The produced CB was ground and passed through a 100-mesh sieve. The heavy metal content in the fired biochar was measured using an E-max X-ray fluorescence spectrum analyzer (XRF, XOS company, USA). The total Cd content was digested by adding HNO3, HCl, HF, and HClO4 in sequential order and was then measured through inductively coupled plasma optical emission spectroscopy (ICP-OES, Optima, 2000; PerkinElmer Co., USA; Table S1†). The detection limit was 0.03 mg kg−1.39B. subtilis is a urease-producing bacterial strain, and it was obtained from the China Center of Industrial Culture Collection (B. subtilis strain number: BNCCI 193111). Prior to the experiments, the instruments, reagents, and glassware were sterilized using a high-pressure steam sterilizer. The experimental procedures were performed on an ultraclean workbench. For bacterial cultivation, 2 g of B. subtilis was added to 100 mL of Luria-Bertani (LB) sterile liquid medium after autoclaving, which was then cultivated for 15 h at 30 °C. The first generation was added to 100 mL of a fresh sterile medium such that the bacterial concentration in the solution was 5%. The Erlenmeyer flask was shaken at a speed of 180 rpm at 30 °C, and the solution was cultivated for 8 h to obtain the second generation. These steps were repeated until the third generation was cultivated. The third generation of the bacillus solution was mixed with CBs prepared at different pyrolysis temperatures at a mixture-to-water ratio of 4![[thin space (1/6-em)]](https://www.rsc.org/images/entities/char_2009.gif) :
:![[thin space (1/6-em)]](https://www.rsc.org/images/entities/char_2009.gif) 5 (W/V) in 250 mL Erlenmeyer flasks, which were then shaken for 2 h at 180 rpm and at 30 °C. The mixture was then filtrated and dried at 30 °C to obtain the composite amendment (CB@B) at −4 °C. CB and CB@B were characterized using a scanning electron microscope (SEM) and Fourier transform infrared spectrometer (FTIR, Nicolet IS5, USA) at a resolution of 2 cm−1 in the range of 4000–400 cm−1.
5 (W/V) in 250 mL Erlenmeyer flasks, which were then shaken for 2 h at 180 rpm and at 30 °C. The mixture was then filtrated and dried at 30 °C to obtain the composite amendment (CB@B) at −4 °C. CB and CB@B were characterized using a scanning electron microscope (SEM) and Fourier transform infrared spectrometer (FTIR, Nicolet IS5, USA) at a resolution of 2 cm−1 in the range of 4000–400 cm−1.
2.2 Cd adsorption in solution
The 400°C-CB@B sample was characterized using SEM, energy dispersive spectrometry (SEM-EDS), FTIR, X-ray photoelectron spectroscopy (XPS), and X-ray diffraction (XRD, TD-3500 Dandong Tongda Science and Technology, China) before and after being subjected to 1.0 mg L−1 Cd.
Three mathematical models were applied to the sorption kinetics: the intraparticle diffusion kinetic model, pseudo-first-order kinetic model, and pseudo-second-order kinetic model. These are presented below.
| Intraparticle diffusion: qt = C + Kit0.5 | (1) |
| Pseudo-first-order: ln(qe−qt) = lnqe−K1t | (2) |
 | (3) |
2.3 Cd immobilization in soil
Samples were collected from the top layer (0–20 cm) of the soil, air-dried, passed through a 100-mesh sieve, and bottled for the experiments. The soil pH was measured using a pH meter (Sartorius PB-10, Beijing, China) at a solid–liquid ratio of 1![[thin space (1/6-em)]](https://www.rsc.org/images/entities/char_2009.gif) :
:![[thin space (1/6-em)]](https://www.rsc.org/images/entities/char_2009.gif) 2.5 (W/V). The levels of heavy metals and their physicochemical properties are listed in Table S2.† The Cd concentration in the soil was 1.4 mg kg−1, and the soil pH was 7.2.
2.5 (W/V). The levels of heavy metals and their physicochemical properties are listed in Table S2.† The Cd concentration in the soil was 1.4 mg kg−1, and the soil pH was 7.2.
2.4 Statistical analysis
XRF was only used to detect the concentrations of different heavy metals in CB and soil. One-way analysis of variance (ANOVA) with Duncan's test (p < 0.05) was applied in SPSS 26 for Windows (SPSS Inc. IBM Corporation, USA) to determine any significant differences in the Cd recovery. The results were expressed as the mean ± standard deviation of three independent replicates. All figures were generated using Origin (version 2018).3 Results and discussion
3.1 Characterization of CB and CB@B
The number of functional groups decreased with increasing temperature. According to Zama, the loss of functional groups such as hydroxyl (O–H) and asymmetric C–H on methyl23 can be attributed to the thermal decomposition of most functional groups at higher pyrolysis temperatures.47 Temperatures above 500 °C can significantly increase the concentration of environmentally persistent free radicals in the feedstock, which can be potentially toxic to some soil microorganisms.48 CB samples generated at 300 °C–400 °C contained more surface functional groups than the samples generated at 450 °C–550 °C, suggesting that the main mechanisms involved in the adsorption process are electrostatic interaction, ion exchange, and surface complexation.49
3.2 Adsorption results
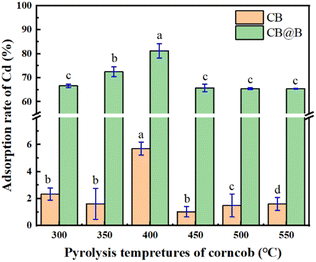 | ||
| Fig. 3 Cd adsorption rate in a solution on CB and CB@B generated at different pyrolysis temperatures. | ||
CB@B demonstrated significantly better adsorption than CB alone (p < 0.05), indicating that B. subtilis played an extremely important role during Cd adsorption. Moreover, the experiment eliminating other interfering factors (Fig. S2†) showed that the Cd adsorption of CB@B was considerably higher than the adsorptions of Luria-Bertani and CB. The Cd adsorption of 400°C-CB@B was higher than that of CB (Fig. 3) and B. subtilis alone (Fig. S2†) by 93.0% and 48.7%, respectively.
These results agree with those reported in other studies.34,50,51 Combining bacteria and a mineral-based material decreased the Cd level and bioavailability in soil more effectively than when using either bacteria or the mineral-based material alone.37,50 At a pyrolysis temperature of 400 °C, CB exhibited a clear porous structure, which provided more adsorption sites for bacteria and numerous functional groups on the surface that further facilitated the adsorption process.20,52,53
FTIR was conducted on CB@B before and after Cd2+ adsorption (Fig. 5a). The adsorption bands around 3450 and 3440 cm−1 were attributed to hydroxyl stretching vibrations.60 The broad bands observed between 1620 and 1610 cm−1 were assigned to the carbonyl bending vibrations.58 The intense peak at 1490–1792 cm−1 was attributed to the abundance of the carbonate group such as C![[double bond, length as m-dash]](https://www.rsc.org/images/entities/char_e001.gif) O.47 After Cd2+ adsorption on CB@B, a tiny peak was observed at 1530 cm−1 that was attributed to carbonyl bending vibration. Moreover, the peak at 1610 cm−1 shifted to 1620 cm−1, indicating that the carbonyl peak is closely associated with Cd immobilization.40,49 At 795 cm−1, another tiny peak was observed, and the FTIR peak at 886 cm−1 shifted to 891 cm−1. This new peak was related to the Si–O–Si shift, which indicates that Cd was exchanged with Si–O–Si on the surface of CB@B and formed chemical bonds. The FTIR peak at 3440 cm−1 shifted to 3450 cm−1, which reflects the hydroxyl shift. These results indicate that carboxyl and phenolic hydroxyl reacted with Cd2+ to form surface complexes. The reaction of these organic functional groups shifted the COOH, OH, C
O.47 After Cd2+ adsorption on CB@B, a tiny peak was observed at 1530 cm−1 that was attributed to carbonyl bending vibration. Moreover, the peak at 1610 cm−1 shifted to 1620 cm−1, indicating that the carbonyl peak is closely associated with Cd immobilization.40,49 At 795 cm−1, another tiny peak was observed, and the FTIR peak at 886 cm−1 shifted to 891 cm−1. This new peak was related to the Si–O–Si shift, which indicates that Cd was exchanged with Si–O–Si on the surface of CB@B and formed chemical bonds. The FTIR peak at 3440 cm−1 shifted to 3450 cm−1, which reflects the hydroxyl shift. These results indicate that carboxyl and phenolic hydroxyl reacted with Cd2+ to form surface complexes. The reaction of these organic functional groups shifted the COOH, OH, C![[double bond, length as m-dash]](https://www.rsc.org/images/entities/char_e001.gif) O, and Si–O–Si peaks.20,61 In addition, the carboxyl functional groups of biochar may promote the complexation of heavy metals.62
O, and Si–O–Si peaks.20,61 In addition, the carboxyl functional groups of biochar may promote the complexation of heavy metals.62
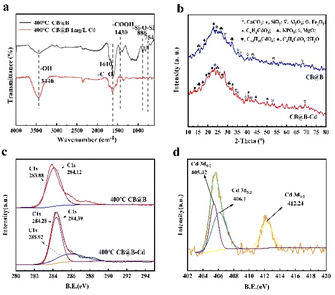 | ||
| Fig. 5 (a) FTIR spectra, (b) XRD spectra, (c) C 1s XPS diagrams, and (d) Cd 3d XPS diagrams of 400 °C-CB@B before and after Cd adsorption. | ||
The XRD spectra verified the changes in the surface functional groups (Fig. 5b). Chemical compounds such as SiO2, CaCO3, and KPO3 were observed in CB@B before and after Cd adsorption. The presence of Si, K, Al, Fe, and Mg was also confirmed through SEM-EDS. The spectra clearly showed new peaks of Cd compounds formed via Cd adsorption on CB@B and the decrease in intensity of the SiO2 peak. The adsorption process may involve precipitation63 within the solution and on the surfaces. The adsorption process often proceeds synergistically with other mechanisms such as ion exchange, electrostatic interaction, and surface complexation53 because of the direct interaction between chemical compounds containing carbonates (e.g., SiO2) and O-functional groups (e.g., O–H and COOH) on CB@B and Cd.61 These chemical compounds are highly effective in immobilizing heavy metals in contaminated soil.42
Before Cd adsorption, a sharp peak was observed at 283.00 eV in the C 1s narrow region spectrum (Fig. 5c), which was assigned to the carbon in aliphatic or aromatic C–H and C–C or to C![[double bond, length as m-dash]](https://www.rsc.org/images/entities/char_e001.gif) C bonds.20,23 A characteristic peak was observed at 287.00 eV, which was assigned to hydroxyl carbon. After Cd adsorption, the peaks of the aliphatic carbon and hydroxyl group shifted to 284.439 and 288.231 eV, respectively, which indicated that CB@B contained aliphatic carbon and hydroxyl radicals that participated in the reaction.23 This result was also confirmed by the FITR results. O-containing functional groups, especially carboxyl and hydroxyl, play an important role in the stable binding of Cd2+ with biochar by complexation.52 The Cd signal was not detected in CB@B before being treated with 1.0 mg L−1 Cd. The presence of Cd in CB@B was detected after the treatment with Cd (Fig. 5d), which confirms the Cd adsorption and loading onto CB@B. The high-resolution XPS spectra for 3d-distributed Cd at 405.42 and 406.16 eV can be attributed to the 3d5/2 track of Cd. The two characteristic peaks observed at 412.02 and 412.664 eV can be attributed to the 3d3/2 track. These results indicate that Cd on CB@B was mainly in the form of Cd2+.20,29
C bonds.20,23 A characteristic peak was observed at 287.00 eV, which was assigned to hydroxyl carbon. After Cd adsorption, the peaks of the aliphatic carbon and hydroxyl group shifted to 284.439 and 288.231 eV, respectively, which indicated that CB@B contained aliphatic carbon and hydroxyl radicals that participated in the reaction.23 This result was also confirmed by the FITR results. O-containing functional groups, especially carboxyl and hydroxyl, play an important role in the stable binding of Cd2+ with biochar by complexation.52 The Cd signal was not detected in CB@B before being treated with 1.0 mg L−1 Cd. The presence of Cd in CB@B was detected after the treatment with Cd (Fig. 5d), which confirms the Cd adsorption and loading onto CB@B. The high-resolution XPS spectra for 3d-distributed Cd at 405.42 and 406.16 eV can be attributed to the 3d5/2 track of Cd. The two characteristic peaks observed at 412.02 and 412.664 eV can be attributed to the 3d3/2 track. These results indicate that Cd on CB@B was mainly in the form of Cd2+.20,29
The above results indicate that multiple mechanisms were involved in the Cd2+ adsorption on CB@B, including electrostatic interaction, ion exchange, complexation, chelation, and precipitation.34,64,65 The adsorption mechanism of B. subtilis involves two steps: (1) bioaccumulation by active transport of Cd into the cell combined with the activity of extracellular substances to sequester Cd inside the bacterial cell;2,36,37,57 and (2) adsorption and chelation by extracellular polymer substances combined with bacterial secretion outside the bacterial cell.37,58,59
| –COOH + Cd2+ → –COOCd+ + H+ | (4) |
| –OH + Cd2+ → –OCd+ + H+ | (5) |
| –2COOH + Cd2+ → –COOCdCOO− + 2H+ | (6) |
| –2OH + Cd2+ → –OCdO– + 2H+ | (7) |
| –COOH + Cd2+ + –OH → –COOCdO− + 2H+ | (8) |
Not all of the fitting lines of the intraparticle diffusion kinetic model passed through the origin of the coordinates, indicating that intraparticle diffusion was not the only rate-limiting factor.
3.3 Soil incubation effect of 400 °C-CB and CB@B
4 Conclusions
The experimental results showed that CB@B provided a habitat for exogenous bacteria, improved Cd immobilization, and reduced Cd bioavailability compared with CB alone, indicating that it is an attractive option for mitigating the risks posed by low Cd-contaminated soil. SEM results indicate that the pyrolysis temperature affects the porosity and number of functional groups on the CB surface. Under optimal conditions, CB@B exhibited the best Cd immobilization performance at a pyrolysis temperature of 400 °C and significantly decreased the Cd content in the solution by 81.21%. The characterization results for 400 °C-CB@B and 400 °C-CB indicate the presence of functional groups (e.g., C![[double bond, length as m-dash]](https://www.rsc.org/images/entities/char_e001.gif) O, COOH, and OH), compounds (e.g., SiO2, CaCO3, and KPO3), and Si–O–Si on the surface of 400 °C-CB@B. The adsorption mechanism combined activity by extracellular substances and activity by O-functional groups, which promoted Cd complexation in the solution. B. subtilis was shown to play an important part in Cd adsorption. In experiments on low Cd-contaminated agricultural soil, 400 °C-CB@B significantly and rapidly decreased the available Cd by 55.21%, which was significantly better compared with other treatments at 7 and 14 days. The Cd immobilization in soil by 400 °C-CB@B involved physical adsorption, electrostatic interaction, and ion exchange. In conclusion, 400 °C-CB@B is an environmentally friendly, economic, and effective amendment for low Cd-contaminated soil that is easily applied by farmers whose lands are affected by heavy metal pollution. Further research is needed on the bacterial load. This study thus provides a theoretical and practical foundation for the management of low Cd-contaminated agricultural soil.
O, COOH, and OH), compounds (e.g., SiO2, CaCO3, and KPO3), and Si–O–Si on the surface of 400 °C-CB@B. The adsorption mechanism combined activity by extracellular substances and activity by O-functional groups, which promoted Cd complexation in the solution. B. subtilis was shown to play an important part in Cd adsorption. In experiments on low Cd-contaminated agricultural soil, 400 °C-CB@B significantly and rapidly decreased the available Cd by 55.21%, which was significantly better compared with other treatments at 7 and 14 days. The Cd immobilization in soil by 400 °C-CB@B involved physical adsorption, electrostatic interaction, and ion exchange. In conclusion, 400 °C-CB@B is an environmentally friendly, economic, and effective amendment for low Cd-contaminated soil that is easily applied by farmers whose lands are affected by heavy metal pollution. Further research is needed on the bacterial load. This study thus provides a theoretical and practical foundation for the management of low Cd-contaminated agricultural soil.
Author contributions
Yilin Yang: formal analysis, investigation, visualization, writing—original draft; Xiaojun Hu: conceptualization, funding acquisition, supervision; Huifeng Wang: methodology, formal analysis, investigation, writing—review and editing; Xinling Zhong: formal analysis, validation; Kaishan Chen: formal analysis, investigation; Biao Huang: resources; Chunxiang Qian: resources. All authors read and approved the final manuscript.Conflicts of interest
There are no conflicts to declare.Acknowledgements
This work was supported by “Shuguang Scholar Program” (17SG52) by Shanghai Education Development Foundation, Shanghai Municipal Education Commission and Liaoning Provincial Natural Science Fund Project (2019-ZD-0550), Scientific Research Foundation of Shanghai Institute of Technology (YJ2021-26).Notes and references
- D. Kulikowska, Z. M. Gusiatin, K. Bulkowska and B. Klik, J. Hazard. Mater., 2015, 300, 882–891 CrossRef CAS PubMed.
- L. Liu, J. Li, F. Yue, X. Yan, F. Wang, S. Bloszies and Y. Wang, Chemosphere, 2018, 194, 495–503 CrossRef CAS PubMed.
- H. Wang, W. Hu, Q. Wua, B. Huang, L. Zong, A. Wang and G. S. Matthew, J. Cleaner Prod., 2021, 311, 127673 CrossRef CAS.
- X. L. Zhong, S. L. Zhou, Q. Zhu and Q. G. Zhao, J. Hazard. Mater., 2011, 198, 13–21 CrossRef CAS PubMed.
- X. Zhang, D. Chen, T. Zhong, X. Zhang, M. Cheng and X. Li, Environ. Sci. Pollut. Res., 2015, 22, 4932–4941 CrossRef CAS.
- X. Tang, Q. Li, M. Wu, L. Lin and M. Scholz, J. Environ. Manage., 2016, 181, 646–662 CrossRef CAS.
- A. Hussain, S. Ali, M. Rizwan, M. Z. U. Rehman, M. F. Qayyum, H. Wang and J. Rinklebe, Ecotoxicol. Environ. Saf., 2019, 173, 156–164 CrossRef CAS PubMed.
- Y. Hu, H. Cheng and S. Tao, Environ. Int., 2016, 92–93, 515–532 CrossRef CAS.
- H. Chen, Y. Teng, S. Lu, Y. Wang and J. Wang, Sci. Total Environ., 2015, 512–513, 143–153 CrossRef CAS PubMed.
- Y. Li, H. D. Pang, L. Y. He, Q. Wang and X. F. Sheng, Ecotoxicol. Environ. Saf., 2017, 138, 56–63 CrossRef CAS PubMed.
- C. Tu, F. Guan, Y. Sun, P. Guo, Y. Liu, L. Li, K. G. Scheckel and Y. Luo, Geoderma, 2018, 332, 190–197 CrossRef CAS PubMed.
- M. Hong, L. Zhang, Z. Tan and Q. Huang, Environ. Sci. Pollut. Res., 2019, 26, 19738–19748 CrossRef CAS PubMed.
- Q. Chen, J. Dong, Q. Yi, X. Liu, J. Zhang and Z. Zeng, ACS Sustainable Chem. Eng., 2019, 7, 9928–9936 CrossRef CAS.
- R. Wang, S. Wei, P. Jia, T. Liu, D. Hou, R. Xie, Z. Lin, J. Ge, Y. Qiao, X. Chang, L. Lu and S. Tian, Sci. Total Environ., 2019, 676, 627–638 CrossRef CAS.
- P. Gu, Y. Zhang, H. Xie, J. Wei, X. Zhang, X. Huang, J. Wang and X. Lou, Ecotoxicol. Environ. Saf., 2020, 205, 111144 CrossRef CAS PubMed.
- B. Zhao, R. Xu, F. Ma, Y. Li and L. Wang, J. Environ. Manage., 2016, 184, 569–574 CrossRef CAS.
- P. Wang, X. Liu, B. Yu, X. Wu, J. Xu, F. Dong and Y. Zheng, Sci. Total Environ., 2020, 702, 134767 CrossRef CAS.
- H. Zhang, R. Xiao, R. Li, A. Ali, A. Chen and Z. Zhang, Chemosphere, 2020, 261, 127694 CrossRef CAS PubMed.
- P. Kaur, P. Kaur and K. Kaur, J. Cleaner Prod., 2020, 244 Search PubMed.
- F. Jing, Y. Liu and J. Chen, Environ. Pollut., 2021, 291, 118243 CrossRef CAS.
- A. H. Fahmi, A. W. Samsuri, H. Jol and D. Singh, RSC Adv., 2018, 8, 38270–38280 RSC.
- A. U. Rajapaksha, S. S. Chen, D. C. Tsang, M. Zhang, M. Vithanage, S. Mandal, B. Gao, N. S. Bolan and Y. S. Ok, Chemosphere, 2016, 148, 276–291 CrossRef CAS.
- H. Chen, X. Yang, Y. Liu, X. Lin, J. Wang, Z. Zhang, N. Li, Y. Li and Y. Zhang, Waste Manage., 2021, 130, 82–92 CrossRef CAS.
- L. Wu, C. Wei, S. Zhang, Y. Wang, Y. Kuzyakov and X. Ding, J. Cleaner Prod., 2019, 235, 901–909 CrossRef CAS.
- P. Zhang, D. O'Connor, Y. Wang, L. Jiang, T. Xia, L. Wang, D. C. W. Tsang, Y. S. Ok and D. Hou, J. Hazard. Mater., 2020, 384, 121286 CrossRef CAS PubMed.
- C.-q. Su, L.-q. Li, Z.-h. Yang, L.-y. Chai, Q. Liao, Y. Shi and J.-w. Li, Trans. Nonferrous Met. Soc. China, 2019, 29, 1304–1311 CrossRef CAS.
- H. Huang, Q. Jia, W. Jing, H. U. Dahms and L. Wang, Chemosphere, 2020, 251, 126428 CrossRef CAS.
- Y. Xie, N. He, M. Wei, T. Wen, X. Wang, H. Liu, S. Zhong and H. Xu, J. Cleaner Prod., 2021, 312 Search PubMed.
- Y.-Z. Xiang, X.-Y. Li, H.-L. Zheng, J.-Y. Chen, L.-B. Lin and Q.-L. Zhang, Lwt, 2021, 146 Search PubMed.
- M. Z. Mohsin, R. Omer, J. Huang, A. Mohsin, M. Guo, J. Qian and Y. Zhuang, Synth. Syst. Biotechnol., 2021, 6, 180–191 CrossRef CAS.
- S. Agrawal, U. K. Jana and N. Kango, Int. J. Biol. Macromol., 2021, 192, 28–37 CrossRef CAS PubMed.
- T. Yu, L. Wang, F. Ma, Y. Wang and S. Bai, J. Hazard. Mater., 2020, 384, 121326 CrossRef CAS.
- C. Wang, Y. Huang, X. Yang, W. Xue, X. Zhang, Y. Zhang, J. Pang, Y. Liu and Z. Liu, Chemosphere, 2020, 252, 126603 CrossRef CAS PubMed.
- X. Qi, J. Gou, X. Chen, S. Xiao, I. Ali, R. Shang, D. Wang, Y. Wu, M. Han and X. Luo, J. Hazard. Mater., 2021, 401, 123823 CrossRef CAS.
- A. H. Lahori, Z. Zhang, Z. Guo, R. Li, A. Mahar, M. K. Awasthi, P. Wang, F. Shen, F. Kumbhar, T. A. Sial, J. Zhao and D. Guo, Ecotoxicol. Environ. Saf., 2017, 145, 528–538 CrossRef CAS.
- W. Pan, Q. Lu, Q. R. Xu, R. R. Zhang, H. Y. Li, Y. H. Yang, H. J. Liu and S. T. Du, Ecotoxicol. Environ. Saf., 2019, 177, 100–107 CrossRef CAS PubMed.
- G. Andrey, V. Rajput, M. Tatiana, M. Saglara, S. Svetlana, K. Igor, T. V. Grigoryeva, C. Vasily, A. Iraida, Z. Vladislav, F. Elena and M. Hasmik, Appl. Geochem., 2019, 104, 93–101 CrossRef CAS.
- MEE, 2014.
- H. Wang, Q. Wu, W. Hu, B. Huang, L. Dong and G. Liu, Environ. Pollut., 2018, 243, 1047–1056 CrossRef CAS PubMed.
- Y. Hamid, L. Tang, B. Hussain, M. Usman, H. K. Gurajala, M. S. Rashid, Z. He and X. Yang, Environ. Pollut., 2020, 257, 113609 CrossRef CAS.
- T. Ma, L. Zhou, L. Chen, Z. Li, L. Wu, P. Christie and Y. Luo, J. Agric. Food Chem., 2016, 64, 8045–8053 CrossRef CAS.
- S. Bashir, Q. Hussain, M. Shaaban and H. Hu, Chemosphere, 2018, 211, 632–639 CrossRef CAS.
- Y. Yong, Y. Xu, Q. Huang, Y. Sun, L. Wang, X. Liang, X. Qin and L. Zhao, Sci. Total Environ., 2022, 813, 152636 CrossRef CAS PubMed.
- H. S. Kambo and A. Dutta, Renewable Sustainable Energy Rev., 2015, 45, 359–378 CrossRef CAS.
- H. Lyu, S. Xia, J. Tang, Y. Zhang, B. Gao and B. Shen, J. Hazard. Mater., 2020, 384, 121357 CrossRef CAS PubMed.
- R. Gao, Q. Fu, H. Hu, Q. Wang, Y. Liu and J. Zhu, J. Hazard. Mater., 2019, 371, 191–197 CrossRef CAS PubMed.
- E. F. Zama, G. Li, Y. T. Tang, B. J. Reid, N. M. Ngwabie and G. X. Sun, Environ. Pollut., 2022, 292, 118241 CrossRef CAS.
- E. S. Odinga, M. G. Waigi, F. O. Gudda, J. Wang, B. Yang, X. Hu, S. Li and Y. Gao, Environ. Int., 2020, 134, 105172 CrossRef CAS.
- D. Chen, X. Wang, X. Wang, K. Feng, J. Su and J. Dong, Sci. Total Environ., 2020, 714, 136550 CrossRef CAS PubMed.
- Q. Li, P. Zhang, H. Zhou, P. Q. Peng, K. Zhang, J. X. Mei, J. Li and B. H. Liao, Ecotoxicol. Environ. Saf., 2020, 195, 110492 CrossRef CAS.
- Y. Zhu, M. Zhong, W. Li, Y. Qiu, H. Wang and X. Lv, Ecotoxicol. Environ. Saf., 2022, 232 Search PubMed.
- H. Li, X. Ye, Z. Geng, H. Zhou, X. Guo, Y. Zhang, H. Zhao and G. Wang, J. Hazard. Mater., 2016, 304, 40–48 CrossRef CAS.
- T. Yang, Y. Xu, Q. Huang, Y. Sun, X. Liang, L. Wang, X. Qin and L. Zhao, Bioresour. Technol., 2021, 333, 125078 CrossRef CAS.
- H. Han, H. Cai, X. Wang, X. Hu, Z. Chen and L. Yao, Ecotoxicol. Environ. Saf., 2020, 195, 110375 CrossRef CAS.
- Y. Liu, B. Tie, O. Peng, H. Luo, D. Li, S. Liu, M. Lei, X. Wei, X. Liu and H. Du, Chemosphere, 2020, 247, 125850 CrossRef CAS.
- M. Ahmad, A. U. Rajapaksha, J. E. Lim, M. Zhang, N. Bolan, D. Mohan, M. Vithanage, S. S. Lee and Y. S. Ok, Chemosphere, 2014, 99, 19–33 CrossRef CAS.
- H. Li, X. Li, L. Xiang, H. M. Zhao, Y. W. Li, Q. Y. Cai, L. Zhu, C. H. Mo and M. H. Wong, Sci. Total Environ., 2018, 613–614, 447–455 CrossRef CAS.
- T. Wang, H. Sun, X. Ren, B. Li and H. Mao, Ecotoxicol. Environ. Saf., 2018, 148, 285–292 CrossRef CAS.
- H. Ma, M. Wei, Z. Wang, S. Hou, X. Li and H. Xu, J. Hazard. Mater., 2020, 388, 122065 CrossRef CAS.
- H. P. Chen, P. Wang, J. D. Chang, P. M. Kopittke and F. J. Zhao, Chemosphere, 2021, 267, 128893 CrossRef CAS.
- Y.-h. Fei, Z. Zhang, Z. Ye, Q. Wu, Y.-t. Tang and T. Xiao, J. Environ. Sci., 2022, 113, 64–71 CrossRef CAS.
- R. Gao, H. Hu, Q. Fu, Z. Li, Z. Xing, U. Ali, J. Zhu and Y. Liu, Sci. Total Environ., 2020, 730, 139119 CrossRef CAS.
- A. A. Houssou, P. Jeyakumar, N. K. Niazi, L. Van Zwieten, X. Li, L. Huang, L. Wei, X. Zheng, Q. Huang, Y. Huang, X. Huang, H. Wang, Z. Liu and Z. Huang, Biochar, 2022, 4 Search PubMed.
- R. Xiao, P. Wang, S. Mi, A. Ali, X. Liu, Y. Li, W. Guan, R. Li and Z. Zhang, Ecotoxicol. Environ. Saf., 2019, 181, 155–163 CrossRef CAS.
- Z. Xu, X. Xu, D. C. W. Tsang and X. Cao, Environ. Pollut., 2018, 242, 1362–1370 CrossRef CAS.
- Y. Yang, Y. Ge, P. Tu, H. Zeng, X. Zhou, D. Zou, K. Wang and Q. Zeng, J. Hazard. Mater., 2019, 363, 385–393 CrossRef CAS.
- L. Hua, T. Cheng, Z. Liang and T. Wei, Biochar, 2022, 4 Search PubMed.
- N. Sornhiran, S. Aramrak, N. Prakongkep and W. Wisawapipat, Biochar, 2022, 4 Search PubMed.
Footnote |
| † Electronic supplementary information (ESI) available. See DOI: https://doi.org/10.1039/d2ra04643a |
| This journal is © The Royal Society of Chemistry 2022 |

