 Open Access Article
Bifunctional tetrazole–carboxylate ligand based Zn(II) complexes: synthesis and their excellent potential anticancer properties†
Li-Tao Tan‡
a,
Ting-Xiao Shen‡a,
Jing-Yi Jiangb,
Yu-Jie Zhonga,
Fang-Qi Linb,
Hong Xueb,
Yu-Xin Yaoa,
Xin Jiang*c,
Lei Shen *a and
Xin He*d
aJiangsu Laboratory of Advanced Functional Materials, College of Material Engineering, Changshu Institute of Technology, Changshu, 215500, P. R. China. E-mail: leishen@cslg.edu.cn
bSchool of Pharmacy, Guilin Medical University, Guilin 541004, Guangxi, P. R. China
cAffiliated Hospital of Guilin Medical University, Guilin 541000, Guangxi, P. R. China. E-mail: jiangxin402@163.com
dDepartment of Chemistry and Academy for Advanced Interdisciplinary Studies, Southern University of Science and Technology (SUSTech), Shenzhen 518055, P. R. China. E-mail: hex6@sustech.edu.cn
First published on 25th November 2022
Abstract
Transition metal coordination complexes have provided cancer treatment with new insights to overcome the limitations of current chemotherapeutic agents. Utilization of bifunctional tetrazole–carboxylate ligands with Zn(II) obtained two self-assembled complexes [Zn(HL1)(bipy)3/2(H2O)]·CH3OH·4(H2O) (1) (H3L1 = 1,3,5-tri(2-carboxymethyltetrazol-5-yl) benzene) and [Zn(L2)2(H2O)2]2·2H2O (2) (HL2 = (5-pyridin-3-yl-tetrazol-2-yl)-acetic acid). The X-ray diffraction results showed that the two complexes displayed a two-dimensional (2D) layer structure and a one-dimensional (1D) layer structure. Nanocoprecipitation with DSPE-PEG-2000 resulted in the formation of complex nanoparticles (NPS) with excellent water dispersion. In vitro CCK-8 assay indicated the two NPs exert high cytotoxicity and sensitivity and a low half-maximum inhibitory concentration (IC50) towards HeLa than HepG2 cells. In addition, the cytotoxicity was also confirmed by live/dead co-stained experiments. The presented experimental results showed the 1 and 2 NPs were capable of inhibiting cell proliferation in vitro and may help design coordination complex-based anticancer candidates for cancer cells.
1. Introduction
Coordination complexes have been designed and developed as multifunctional materials for various fields.1–3 The dawn of the past decade has witnessed the prosperity of coordination complexes derived from tetrazole ligands, due to not only their structure diversity but also their tunable applications in the field of ion exchange, magnetism, ferroelectric, catalysis and absorption.4–9 Tetrazole–carboxylic groups as functionalized ligands have been applied as multidentate ligands for the construction of novel metal–organic frameworks with highly interesting topologies and high-dimensional structures.10Over the past decades, cancer has become the second most fatal disease, posing a huge threat to human life and health, so great research efforts have been made for the treatment of cancer.11–15 Many researchers are working to develop clinically viable antitumor drugs, however, most of them are concentrated in biological agents or pure organic compounds.16 Platinum(II) complexes, such as cisplatin, carboplatin and oxaliplatin, are usually used in the clinical treatment of various cancers, and a lot of efforts have been invested to clarify their cellular and molecular mechanisms.17,18 Recently, growing evidence shows that coordination complexes may be one type of less toxic alternative for platinum(II) agents with potential for cancer treatment.19,20 The clinical success of cisplatin provides an incentive to study coordination complexes as potential anticancer drugs. In order to solve the shortcomings of the previous generation of platinum complexes, the design strategy of new platinum complexes has been deeply studied.21 Therefore, it is urgent to develop more targeted antitumor candidates with fewer side effects.
In our previous research, Ru/Ca(II)/Cu(II)-tetrazole–carboxylate complexes showed low IC50 on HeLa cells, indicating that the diversity and versatility of organic ligands can be harnessed to develop coordination complexes with promising anti-cancer activities.22–28 Since studies on complexes based on tetrazole-carboxylate-based ligands for cancer treatment are far from satisfactory. Zn(II) is a trace element essential for the normal function of cells and plays an important role in the development of various cancers.29 Therefore, we are dedicated to investigating the coordination complexes based on Zn(II). In this paper, H3L1 [1,3,5-tri(2-carboxymethyltetrazol-5-yl) benzene] and HL2 [(5-pyridin-3-yl-tetrazol-2-yl)-acetic acid] (Scheme 1) have been employed to construct complexes with Zn(II) and two complexes [Zn(HL1)(bipy)3/2(H2O)]·CH3OH·4(H2O) (1) and [Zn(L2)2(H2O)2]·2H2O (2)![[thin space (1/6-em)]](https://www.rsc.org/images/entities/char_2009.gif) 30 were obtained. Nanoparticles (NPs) of these complexes were formed by a method of nanocoprecipitation. The experimental results showed that the two complexes displayed greater anticancer activity. Both the two NPs showed considerable cytotoxicity towards HeLa cells, while their corresponding ligands were non-toxic, proving the coordination process was a favorable factor to improve the anticancer properties of NPs. The NPs of the complexes are potential candidates for the treatment of HeLa cells. Eventually, the calcein-AM/PI con-stained experiment demonstrates that these complexes are capable of inducing cell apoptosis for efficient therapy.
30 were obtained. Nanoparticles (NPs) of these complexes were formed by a method of nanocoprecipitation. The experimental results showed that the two complexes displayed greater anticancer activity. Both the two NPs showed considerable cytotoxicity towards HeLa cells, while their corresponding ligands were non-toxic, proving the coordination process was a favorable factor to improve the anticancer properties of NPs. The NPs of the complexes are potential candidates for the treatment of HeLa cells. Eventually, the calcein-AM/PI con-stained experiment demonstrates that these complexes are capable of inducing cell apoptosis for efficient therapy.
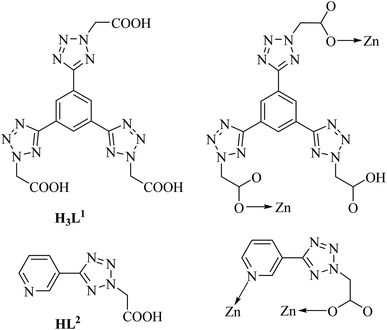 | ||
| Scheme 1 Drawing for H3L1 and HL2 ligands and their coordination modes observed in complexes 1 and 2. | ||
2. Experimental section
2.1 Materials and apparatus
The two ligands were obtained by the literature method.30,31 All available reagents for the synthesis were purchased from commercial sources and used directly. FT-IR spectra on KBr disk were recorded on a Nicolet-IS10 spectrometer. Elemental analysis was performed on an EA1110 CHNO-S microanalyzer. Luminescence properties were carried on a Hitachi F-7000 fluorescence spectrophotometer. Powder X-ray diffraction (PXRD) measurements were carried out on a Rigaku D/MAX 2200 diffractometer. Scanning electron microscopy (SEM) was recorded on a Hitachi S-4800. 1H and 13C NMR spectrum were tested on a 400 MHz Bruker instrument using DMSO-d6 as solvent. All general characterizations were carried out with crystal samples.2.2 Synthesis of the [Zn(HL1)(bipy)3/2(H2O)]·CH3OH·4(H2O) (1)
H3L1 (0.0498 g, 0.1 mmol) was added to distilled water (5 mL) and adjusted to pH = 6.5 with KOH (0.2 mol L−1). Then CH3OH solution (5 mL) contained 4,4′-bipy (0.1 mmo1) and Zn(NO3)2·4H2O (0.1 mmol) was added, which were sealed in a 25 mL Teflon-lined stainless steel container to heated at 120 °C for 48 h, then cooled to room temperature. Colorless crystals of complex 1 were obtained. For 1, yield: 50% based on Zn2+. Anal. calcd for C31H36N15O12Zn: C: 42.50%, H: 4.14%, N: 23.98%. Found: C: 42.83%; H, 4.09%; N, 23.88%. IR (KBr, cm−1): 3482(w), 1600(m), 1434(m), 1384(s), 1311(m), 833(m), 744(w), 597(w)). 1H NMR (400 MHz, DMSO-d6) δ (ppm): 8.71 (m, 6H), 8.22 (m, 3H), 8.05 (m, 6H), 7.57 (m, 6H), 4.6 (s, 1H), 4.01 (m, 3H); 13C NMR (100 MHz, DMSO-d6) δ (ppm): 163.9, 150.1, 145.1, 138.6, 126.1, 124.6, 80.0, 77.4, 73.4, 36.0.2.3 Synthesis of the [Zn(L2)2(H2O)2]·2H2O (2)
HL2 (0.0183 g, 0.1 mmol), Zn(NO3)2·4H2O (0.0261 g, 0.1 mmol) were dissolved in distilled water (6 mL) and then added KOH (0.5 mL, 0.2 mol L−1) to adjust pH according to our previous work.30 The solution was treated the same as 1. After cooled to room temperature and filtered of the solution, colorless block crystals of complex 2 were formed after 3 days. For 2, yield: 52% based on Zn2+. Anal. calcd for C16H20N10O8Zn: C: 35.21%, H: 3.69%, N: 25.66%. Found: C: 35.33%, H: 3.58%, N: 25.32%. IR (KBr, cm−1): 3437(m), 3126(w), 1623(m), 1400(m), 1322(w), 1172(w), 847(w), 755(w), 532(w). 1H NMR (400 MHz, DMSO-d6) δ (ppm): 8.84 (d, 1H), 8.18 (m, 1H), 7.73 (m, 1H), 7.53 (m, 1H), 5.76 (s, 1H); 13C NMR (100 MHz, DMSO-d6) δ (ppm): 175.4, 163.8, 151.2, 150.6, 138.4, 127.2, 124.9, 60.9.2.4 X-ray crystallography
Crystallographic data for 1 and 2 were recorded on a Bruker Apex II DUO diffractometer with a Mo-Kα source (λ = 0.71073 Å) at room temperature. All absorption corrections were performed using the SADABS programs.32 These structures were refined with a direct method and on F2 with a SHELXTL-2014 software.33 The crystal data and refinement parameters are summarized in Table S1 (ESI).† The main bond distances and angles are summarized in Tables S2 and S3 (ESI).†2.5 Preparation of complexes 1 and 2 nanoparticle (NPs)
Nanoparticles of the two complexes were prepared by nanocoprecipitation with DSPE-PEG-2000 (1,2-distearoyl-sn-glycero-3-phosphoethanolamine-N-[methoxy(polyethylene glycol)-2000).34,35 Taking complex 1 as an example, 5 mg DSPE-PEG-2000 and 2 mg complex 1 were dissolved in tetrahydrofuran (THF, 1 mL) under ultrasound. After this solution was injected into distilled water with ultrasound at room temperature, THF was removed by bubbling with N2. The solution was stored at 4 °C for further use.2.6 Cell culture and CCK-8 assay
All the cell lines in this work were obtained from Cell Bank of SIBCB, CAS (China). The HeLa cells were cultured in a Minimum essential medium (Gibco; Thermo Fisher Scientific) with 10% fetal bovine serum (FBS; Gibco; Thermo Fisher Scientific). The HeLa cells were cultured in DMEM (Biosharp; biosharp life sciences) with 10% FBS (Biosharp; biosharp life sciences). HeLa, HepG2 and LO2 cell lines were seeded in 96-well plates at a density of 2 × 10³ cells per ml, 1 × 10⁴ cells per ml and 1 × 10⁴ cells per ml respectively were cultured at 37 °C in a humidified incubator with 5% CO2, then the cells were incubated with series concentrations of the two NPs for 24 h. Cell viability of the nanoparticles was determined using a Cell Counting Kit. Finally, cytotoxicity was assessed using the Cell Counting Kit-8 (CCK-8). The CCK-8 reagent was added to cells at 37 °C for 2 h, and the optical density was measured by a microplate reader setting at 450 nm. The cell viability was calculated by the following equation: relative cell viability (%) = (A1/A0) × 100% (A1 = mean absorbance in each group incubated with different concentrations of NPs, A0 = mean absorbance in the control group). The IC50 was calculated using SPSS 25.0 software.2.7 Live/dead co-staining by Calcein-AM and PI
HeLa cells (2 × 10⁴ per well) were seeded into 24-well plates respectively and cultured for 24 h. In this experiment, we set up control groups, IC50 groups. In the control group, the cells were cultured then the cells were treated with complexes 1 and 2 for 24 h at IC50 concentrations. Then we determined the cell viability with Calcein-AM/PI live/dead cell co-staining kit (Solarbio, Beijing, China). The concentration of Calcein-AM to stain live cells (green channel) is 2.5 μM while that of PI for the dead cells (red channel) is 4.5 μM. The photographs were captured on an inverted fluorescence microscope (Evos M500, Invitrogen by Thermo Fisher Scientific).3. Results and discussion
3.1 Preparation and characterization of complexes 1 and 2
In the weak acidic conditions, hydro(solvo)thermal reactions of H3L1, HL2 and Zn(NO3)2·4H2O with a molar ratio of 1![[thin space (1/6-em)]](https://www.rsc.org/images/entities/char_2009.gif) :
:![[thin space (1/6-em)]](https://www.rsc.org/images/entities/char_2009.gif) 1 in CH3OH–H2O and H2O at 120 °C for 2 days gave complexes 1 and 2. The two complexes were both air-stable. The elemental analysis reveals that the components of the complexes are in good agreement with that of X-ray diffraction analysis. FT-IR spectra of ligands and their complexes were displayed in Fig. S1–S4 in the ESI.† The disappearance of the strong absorptions at 1702 and 1724 cm−1 corresponding to the ν(–C
1 in CH3OH–H2O and H2O at 120 °C for 2 days gave complexes 1 and 2. The two complexes were both air-stable. The elemental analysis reveals that the components of the complexes are in good agreement with that of X-ray diffraction analysis. FT-IR spectra of ligands and their complexes were displayed in Fig. S1–S4 in the ESI.† The disappearance of the strong absorptions at 1702 and 1724 cm−1 corresponding to the ν(–C![[double bond, length as m-dash]](https://www.rsc.org/images/entities/char_e001.gif) O) vibrations of –COOH groups confirms the deprotonation of the –COOH groups of the two ligands during the hydrothermal reactions.36,37 The two complexes show the characteristic asymmetric and symmetric stretching vibrations of the carboxylate groups at 1600, 1623 cm−1 and 1384, 1400 cm−1, respectively. There were also typical peaks at 3482 and 3437 cm−1 are ascribed to the O–H vibrations of the free or coordinated H2O in 1 and 2. 1H and 13C NMR spectra were measured, and the results are given in Fig. S7–S10,† respectively. These are well correspondent to the results of the X-ray diffraction analysis and are also in accordance with previous observations where similar deprotonated carboxylic acids were used as ligands.
O) vibrations of –COOH groups confirms the deprotonation of the –COOH groups of the two ligands during the hydrothermal reactions.36,37 The two complexes show the characteristic asymmetric and symmetric stretching vibrations of the carboxylate groups at 1600, 1623 cm−1 and 1384, 1400 cm−1, respectively. There were also typical peaks at 3482 and 3437 cm−1 are ascribed to the O–H vibrations of the free or coordinated H2O in 1 and 2. 1H and 13C NMR spectra were measured, and the results are given in Fig. S7–S10,† respectively. These are well correspondent to the results of the X-ray diffraction analysis and are also in accordance with previous observations where similar deprotonated carboxylic acids were used as ligands.
The thermogravimetric analysis investigation of 1 and 2 was carried out under air atmosphere from 30 to 1000 °C (Fig. S5 and S6 in the ESI†). For 1, the initial weight loss of 11.94% from 30 to about 210 °C may ascribed to the removal of four lattice H2O and one CH3OH molecules (calcd 11.9%). The structure starts to collapse at about 250 °C and with the final residue of ZnO (observed loss of 9.1% at 450 °C as shown in Fig. S5† and calcd 9.3%). For 2, a weight loss of 6.1% between 30 to 200 °C can attributed to the loss of two H2O molecules (calcd 6.6%), and a further loss of 7.0% attributed to the loss of another two coordinated H2O molecules (calcd 6.6%). The subsequent structural collapse began at about 260 °C with a ZnO residue remaining (the found loss of 14.5% at 750 °C as shown in Fig. S6† and calcd 14.9%).
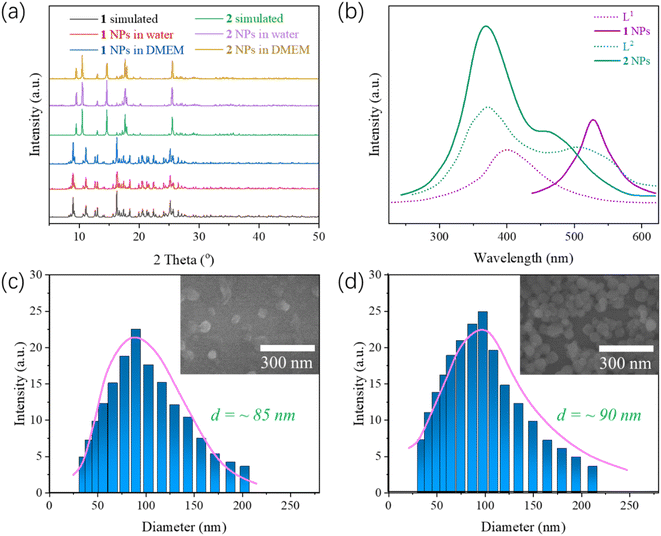
Powder XRD was used to characterize the stability of complexes 1 and 2 NPs in water and culture medium. The experimental and simulated PXRD curves of complexes 1 and 2 NPs is shown in Fig. 1a. Overall, the diffraction patterns are similar, suggesting the high phase purity of the bulk products. Moreover, the complex NPs can be retained in aqueous solutions and DMEM at RT for one day, showing high water stability.
The luminescence of complexes 1 and 2 NPs and the free ligands have been studied at room temperature. As is shown in Fig. 1b, H3L1 and HL2 exhibit photoluminescence with maximum intensity at 400 and 373 nm upon excitation at 310 and 340 nm, respectively. Complex 1 NPs exhibit maximum emission at 528 nm after excitation at 330 nm, respectively. Compared with the emission spectrum of HL2, the obvious blue shift of emission length 128 nm in complex 1 has been observed, so the emission peaks 1 can be ascribed to the emission of ligand-to-metal charger-transfer (LMCT) that are in reasonable agreement with literature examples on this class of and zinc(II) coordination complexes previously reported.38 Complex 2 NPs exhibit maximum emission at 368 nm after excitation at 370 nm. Compared with the emission spectrum of HL2 ligand, its wavelength has no significant change, but its intensity has been enhanced because the coordination of the Zn(II) atom further enlarges the conjugated system to enhance the luminescence.
To improve the water dispersity of three complexes, nanocoprecipitation was used. SEM (scanning electron microscope) and DLS (dynamic light scattering) were used to characterize the size and the diameter of complexes 1 and 2 NPs. DLS demonstrates that such NPs can self-assemble into nanoparticles with an average diameter size of about 85 nm for 1 and 90 nm for 2, respectively (Fig. 1c and d). The size of NPs of complex 1 is similar to those of NPs of complex 2, indicating that either DSPE-PEG-2000 coated complex 1 or complex 2 may have good biocompatibility.
3.2 Crystal structure of [Zn(HL1)(bipy)3/2(H2O)]·CH3OH·4(H2O) (1)
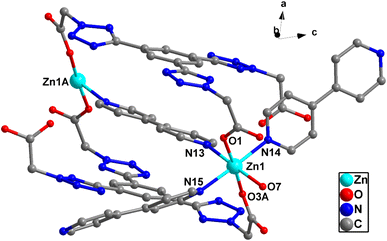
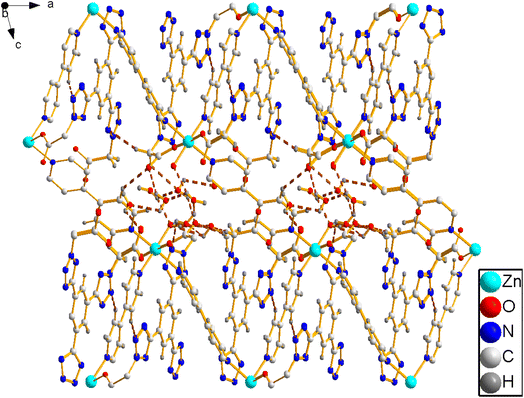
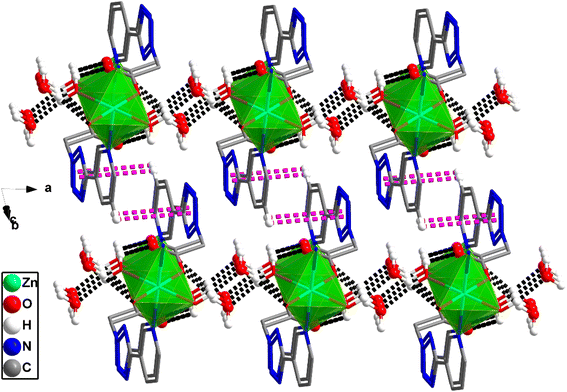
X-ray crystallographic analysis reveals that 1 crystallizes in a triclinic space group P![[1 with combining macron]](https://www.rsc.org/images/entities/char_0031_0304.gif) . The asymmetric unit consists of one Zn(II) cation, 3/2 4,4′-bipy ligands, one L1 ligand, one coordinated water molecule, one methyl alcohol and four lattice water molecules. As shown in Fig. 2, each Zn(II) cation is coordinated by three nitrogen atoms [N(13), N(14) and N(15)] from three ligands, two O atoms [O(1), O(3)A] from two L1 ligands, and one water molecules (O7), which make the center Zn(II) form six-coordinated slightly twisted octahedral structure. Each L1, as a bidentate ligand, link to the center of Zn1A and Zn1 through two O atoms (O1, O3) from the L1 ligand. Two L1 ligands set up a double bridge between neighboring Zn(II) atoms to produce a bimetallacycle of [Zn2(L1)2], then the adjacent 1D chain is further connected to give a 2D structure through 4,4-bipyridine ligands (Fig. 3a). If the Zn(II) ion is treated as a 3-connected node (Fig. 3b) and the 4,4′-bipy ligands or L1 ligand as a line (Fig. 3c), the structure of 1 can be simplified as a 2D network with hcb topology (Fig. 3d). These single 2D layers are futher connected by hydrogen bonds, originating between the coordinated water molecules and the free water molecules [O(7)–H(7A)⋯O(11) 1.79 Å/172°], the methanol [O(7)–H(7A)⋯O(12) 2.45 Å/109°], the coordinated water molecules [O(7)–H(7B)⋯O(1) 1.93 Å/164°], and the free water molecules and the carboxylic acids [O(8)–H(8D)⋯O(2) 1.99 Å/126°, O(9)–H(9A) ···O(4) 2.01 Å/145°]. It makes this coordination complex accumulated to generate a 3D network structure (Fig. 4).
. The asymmetric unit consists of one Zn(II) cation, 3/2 4,4′-bipy ligands, one L1 ligand, one coordinated water molecule, one methyl alcohol and four lattice water molecules. As shown in Fig. 2, each Zn(II) cation is coordinated by three nitrogen atoms [N(13), N(14) and N(15)] from three ligands, two O atoms [O(1), O(3)A] from two L1 ligands, and one water molecules (O7), which make the center Zn(II) form six-coordinated slightly twisted octahedral structure. Each L1, as a bidentate ligand, link to the center of Zn1A and Zn1 through two O atoms (O1, O3) from the L1 ligand. Two L1 ligands set up a double bridge between neighboring Zn(II) atoms to produce a bimetallacycle of [Zn2(L1)2], then the adjacent 1D chain is further connected to give a 2D structure through 4,4-bipyridine ligands (Fig. 3a). If the Zn(II) ion is treated as a 3-connected node (Fig. 3b) and the 4,4′-bipy ligands or L1 ligand as a line (Fig. 3c), the structure of 1 can be simplified as a 2D network with hcb topology (Fig. 3d). These single 2D layers are futher connected by hydrogen bonds, originating between the coordinated water molecules and the free water molecules [O(7)–H(7A)⋯O(11) 1.79 Å/172°], the methanol [O(7)–H(7A)⋯O(12) 2.45 Å/109°], the coordinated water molecules [O(7)–H(7B)⋯O(1) 1.93 Å/164°], and the free water molecules and the carboxylic acids [O(8)–H(8D)⋯O(2) 1.99 Å/126°, O(9)–H(9A) ···O(4) 2.01 Å/145°]. It makes this coordination complex accumulated to generate a 3D network structure (Fig. 4).
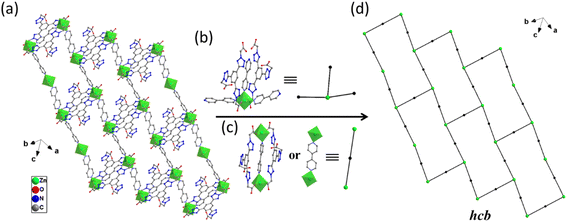 | ||
| Fig. 3 2D coordination network of complex 1 extended along the ab plane (H atoms are omitted for clarity). | ||
3.3 Crystal structure of [Zn(L2)2(H2O)2]·2H2O (2)
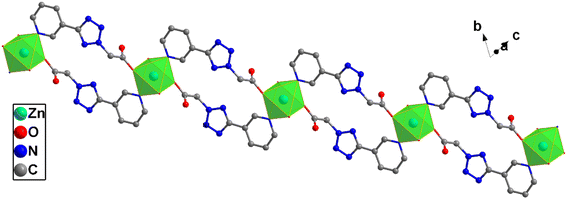
X-ray crystallographic analysis reveals that complex 2 crystallizes in a triclinic space group P![[1 with combining macron]](https://www.rsc.org/images/entities/char_0031_0304.gif) . The asymmetric unit consists of one Zn(II) cation, one L2 ligand, two coordinated water molecules and two lattice water molecules. As is shown in Fig. 5, each Zn(II) center is coordinated by two nitrogen atoms [N(5) and N(5A)] from two ligands and four water molecules [O(1B), O(1A), O5, O(5C)], which make the center Zn(II) atom form six-coordinated slightly distorted octahedral geometry. Each L2, as bidentate ligand, link to the ZnD and Zn1 atoms through one carboxylic acid O1 atom and one pyridine N5 atom. Two such ligands set up a double bridge between neighboring Zn(II) ions to generate a bimetallacycle of [Zn2(L2)2]. The adjacent bimetallacycle is connected to yield the 1D chain Fig. 6. Then the adjacent 1D chains are further connected by four (two) kinds of hydrogen bonding interactions between free water molecules [O(5)–H(5C)⋯O(7) 1.81 Å/170°], O atom in free water molecules and O atom in coordinated water molecules[O(7)–H(7B)⋯O(1) 1.93 Å/164°] C atom in carboxylic acid to form a 2D layer. The 2D layers are further connected by C(2)–H(2)⋯π(N1, N2, N3, N4, C6) interactions between two adjacent L2 ligands to form a 3D supramolecular reticular architecture (Fig. 7).
. The asymmetric unit consists of one Zn(II) cation, one L2 ligand, two coordinated water molecules and two lattice water molecules. As is shown in Fig. 5, each Zn(II) center is coordinated by two nitrogen atoms [N(5) and N(5A)] from two ligands and four water molecules [O(1B), O(1A), O5, O(5C)], which make the center Zn(II) atom form six-coordinated slightly distorted octahedral geometry. Each L2, as bidentate ligand, link to the ZnD and Zn1 atoms through one carboxylic acid O1 atom and one pyridine N5 atom. Two such ligands set up a double bridge between neighboring Zn(II) ions to generate a bimetallacycle of [Zn2(L2)2]. The adjacent bimetallacycle is connected to yield the 1D chain Fig. 6. Then the adjacent 1D chains are further connected by four (two) kinds of hydrogen bonding interactions between free water molecules [O(5)–H(5C)⋯O(7) 1.81 Å/170°], O atom in free water molecules and O atom in coordinated water molecules[O(7)–H(7B)⋯O(1) 1.93 Å/164°] C atom in carboxylic acid to form a 2D layer. The 2D layers are further connected by C(2)–H(2)⋯π(N1, N2, N3, N4, C6) interactions between two adjacent L2 ligands to form a 3D supramolecular reticular architecture (Fig. 7).
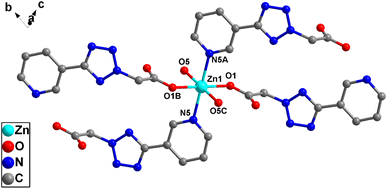 | ||
| Fig. 5 The coordination environment of Zn(II) atom of complex 2. Hydrogen atoms are omitted for clarity. | ||
3.4 Cytotoxicity
The cytotoxicity of the two NPs to HeLa, HepG2 and LO2 normal cells was studied by CCK-8 assay. Different concentrations of NPs of complexes 1 and 2 were incubated with these cells. As shown in Fig. 8, the cell viability of the group cultured with ligands (H3L1 and HL2) remained high even at high concentrations, showing the low cytotoxicity of the ligands. While the results showed concentration-dependent cell death after these cells were treated by 1 and 2 NPs under different concentrations. With the increase of the concentrations of the NPs, the survival viability of HeLa cell tends to gradually reduce. The IC50 of NPs of 1 and 2 are approximate 12.1 μg mL−1 and 13.2 μg mL−1 for HeLa cells, 16.8 μg mL−1 15.3 μg mL−1 for HepG2 cells, 26.1 μg mL−1 and 25.0 μg mL−1 for LO2 cells, showing the 1 NPs have the higher sensitivity and cytotoxicity against HeLa than HepG2 cells (Fig. S11†). Also, cell apoptosis observed in the two humor cells with a high r apoptotic rate under the same NPs concentration, indicating the higher anti-apoptotic ability of human normal LO2 cells than that of HeLa and HepG2 cells. From the Table 1, the IC50 of the complexes 1 and 2 were superior to the other complexes with Zn(II) based complexes, and also other complexes based on tetrazole–carboxylate.35,42–44 Although the role of Zn(II) in the regulation of apoptosis seems to be cell type specific, and most studies are focused on the inhibitory effect of on the proliferation of breast and prostate cancer cells.39,40 Our results showed that Zn(II) complexes also have obvious inhibitory cytotoxicity on HeLa cells, which plays an important role in mediating drug resistance and stress-induced apoptosis inhibition in tumoral cells. They are likely to induce tumor cell apoptosis by targeting prosurvival-signal phospho-AKT.41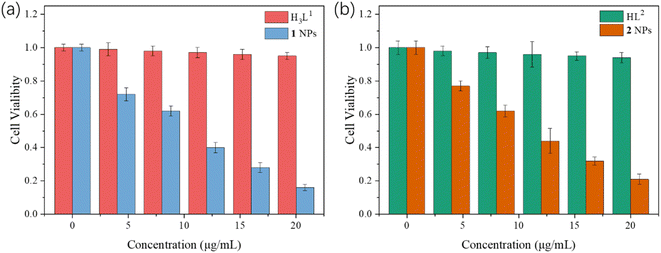 | ||
| Fig. 8 CCK-8 assay of the NPs on HeLa cells of ligands and (a) DSPE-PEG-2000 coated complex 1 NPs, (b) complex 2 NPs. | ||
3.5 Live/dead co-staining by Calcein-AM and PI
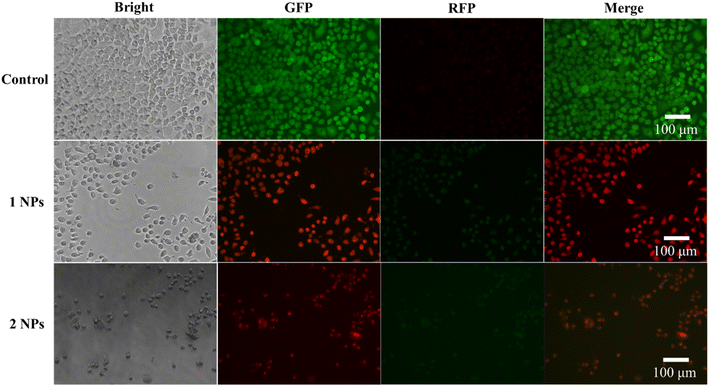
Then the cell viability on complex NPs was investigated by the live/dead co-staining (Fig. 9), where living cells were stained with green fluorescence by Calcein-AM, and dead cells were stained with red fluorescence by PI. In the control group without any treatment, HeLa cells showed strong green fluorescence and a large number of cells survived. While in the groups treated with complex 1 and complex 2 NPs, it showed that HeLa cells have a large number of death/apoptosis, indicating that these two NPs effectively inhibit the growth of cancer cells and achieve the therapy in vitro. The cells death is more obvious in the treatment groups with IC50 concentration.4. Conclusion
In summary, two new Zn(II) complexes have been synthesized based on tetrazole–carboxylates which showed two-dimensional and one-dimensional structures. Although the cytotoxicity of the ligand is negligible, the coordination with Zn(II) makes the cytotoxicity of its corresponding complexes sufficient to inhibit the growth of HeLa and HepG2 cells in vitro. Our results showed that Zn(II) complexes NPs have potential against cancer cells.Conflicts of interest
There are no conflicts to declare.References
- C.-C. Hou and Q. Xu, Adv. Energy Mater., 2018, 1801307 Search PubMed.
- L. He, Q. Ni, J. Mu, W. Fan, L. Liu, Z. Wang, L. Li, W. Tang, Y. Liu, Y. Cheng, L. Tang, Z. Yang, Y. Liu, J. Zou, W. Yang, O. Jacobson, F. Zhang, P. Huang and X. Chen, J. Am. Chem. Soc., 2020, 142, 6822–6832 CrossRef CAS PubMed.
- H. Furukawa, K. E. Cordova, M. O'Keeffe and O. M. Yaghi, Science, 2013, 341, 1230444 CrossRef PubMed.
- J. Yang, S. L. Zhang, Z. Feng, Y. Cao and D. R. Zhu, Dalton Trans., 2021, 50, 11975 RSC.
- Q. Y. Li, D. Y. Chen, M. H. He, G. W. Yang, L. Shen, C. Zhai, W. Shen, K. Gu and J. J. Zhao, J. Solid State Chem., 2012, 190, 196–201 CrossRef CAS.
- M. Wriedt, J. P. Sculley, A. A. Yakovenko, Y. G. Ma, G. J. Halder, P. B. Balbuena and H. C. Zhou, Angew. Chem., Int. Ed., 2012, 51, 9804–9808 CrossRef CAS PubMed.
- Y. H. Joo, H. X. Gao, D. A. Parrish, S. G. Cho, E. M. Goh and J. M. Shreeve, J. Mater. Chem., 2012, 22, 6123 RSC.
- L. Ni, J. Yang, Z. Feng, X. Yao, J. Jiang, Z. Wang and D. R. Zhu, Thermochim. Acta, 2019, 672, 9–13 CrossRef CAS.
- J. Yang, Q. Y. Li, L. Shen, G. W. Yang, X. Y. Tang, C. Zhai, H. D. Ding, J. N. Jin and W. Shen, J. Chem. Crystallogr., 2011, 41, 1483 CrossRef CAS.
- D.-W. Lim and H. Kitagawa, Chem. Soc. Rev., 2021, 50, 6349–6368 RSC.
- Z. Yang, W. Fan, J. Zou, W. Tang, L. Li, L. He, Z. Shen, Z. Wang, O. Jacobson, M. Aronova, P. Rong, J. Song, W. Wang and X. Chen, J. Am. Chem. Soc., 2019, 141, 14687–14698 CrossRef CAS PubMed.
- J. B. Song, L. S. Lin, Z. Yang, R. Zhu, Z. J. Zhou, Z. W. Li, F. Wang, J. Y. Chen, H. H. Yang and X. Y. Chen, J. Am. Chem. Soc., 2019, 141, 8158–8170 CrossRef CAS PubMed.
- J. H. Zou, J. W. Zhu, Z. Yang, L. Li, W. P. Fan, L. C. He, W. Tang, L. M. Deng, J. Mu, Y. Y. Ma, Y. Y. Cheng, W. Huang, X. C. Dong and X. Y. Chen, Angew. Chem., Int. Ed., 2020, 59, 8833–8838 CrossRef CAS PubMed.
- Z. Yang, W. P. Fan, W. Tang, Z. Y. Shen, Y. L. Dai, J. B. Song, Z. T. Wang, Y. Liu, L. S. Lin, L. L. Shan, Y. J. Liu, O. Jacobson, P. F. Rong, W. Wang and X. Y. Chen, Angew. Chem., Int. Ed., 2018, 57, 14101–14105 CrossRef CAS PubMed.
- J. H. Zou, L. Li, J. W. Zhu, X. Li, Z. Yang, W. Huang and X. Chen, Adv. Mater., 2021, 33, 2103627 CrossRef CAS PubMed.
- J. Kaiser, Science, 2015, 347, 226–229 CrossRef CAS PubMed.
- T. C. Johnstone, K. Suntharalingam and S. J. Lippard, Chem. Rev., 2016, 116, 3436–3486 CrossRef CAS PubMed.
- M. Benedetti, C. Ducani, D. Migoni, D. Antonucci, V. M. Vecchio, A. Ciccarese, A. Romano, T. Verri, G. Ciccarella and F. P. Fanizzi, Angew. Chem., Int. Ed., 2008, 47, 507–510 CrossRef CAS PubMed.
- C. Zhai, L. Zhao, X. Y. Hao, Y. J. Shi, D. Xu, G. W. Yang and Q. Y. Li, Inorg. Chem. Commun., 2017, 84, 150–152 CrossRef CAS.
- M. Y. Guo, X. Zhang, L. Zhao, Y. K. Li, D. Y. Chen, G. W. Yang and Q. Y. Li, J. Solid State Chem., 2018, 259, 104–109 CrossRef CAS.
- G. G. Eskiler and I. Kani, Turk. J. Biochem., 2019, 44, 761–768 Search PubMed.
- J. Yang, X. Q. Gu, W. T. Su, X. Y. Hao, Y. J. Shi, L. Y. Zhao, D. F. Zou, G. W. Yang, Q. Y. Li and J. H. Zou, Mater. Chem. Front., 2018, 2, 1842–1846 RSC.
- D. F. Zou, A. L. Zhang, J. J. Chen, Z. Q. Chen, G. Li, S. L. Zhang, Z. Feng, J. F. Feng and J. Yang, Mater. Chem. Front., 2021, 5, 2694–2701 RSC.
- J. Yang, Y. Xu, M. Jiang, D. F. Zou, G. W. Yang, L. Shen and J. H. Zou, J. Inorg. Biochem., 2019, 193, 124–129 CrossRef CAS PubMed.
- H. L. Xu, X. J. Zhang, X. C. Li, X. C. Zhang, J. Deng, D. F. Zou and J. Yang, J. Inorg. Biochem., 2020, 212, 111233 CrossRef CAS PubMed.
- L. Shen, J. J. Chen, Z. Y. Zou, Z. Ke, B. Wei, J. Yang and D. F. Zou, Inorg. Chim. Acta, 2020, 509, 119659 CrossRef CAS.
- A. L. Zhang, X. C. Li, J. Min, L. T. Tan, H. L. Xu, X. G. Zhu, Y. X. Yao, Z. H. Zheng and J. Yang, Inorg. Chim. Acta, 2021, 522, 120380 CrossRef CAS.
- G. Li, H. L. Xu, X. C. Li, A. L. Zhang, Z. Feng and Y. Q. Zeng, Inorg. Chim. Acta, 2021, 520, 120295 CrossRef CAS.
- R. B. Franklin and L. C. Costello, J. Cell. Biochem., 2009, 106, 750–757 CrossRef CAS PubMed.
- J. H. Zou, D. L. Zhu, H. Tian, F. F. Li, F. F. Zhang, G. W. Yang and Q. Y. Li, Inorg. Chim. Acta, 2014, 423, 87–94 CrossRef CAS.
- J. M. Lin, Y. F. Guan, D. Y. Wang, W. Dong, X. T. Wang and S. Gao, Dalton Trans., 2008, 6165–6169 RSC.
- RigakuCrystalClear, Rigaku Corporation, Tokyo, Japan, 2005 Search PubMed.
- G. M. Sheldrick, Acta Crystallogr., 2008, 112, A64 Search PubMed.
- Z. Y. Fu, X. T. Wu, J. C. Dai, S. M. Hu, W. X. Du, H. H. Zhang and R. Q. Sun, Eur. J. Inorg. Chem., 2002, 2002, 2730–2735 CrossRef.
- T. Zhu, T. Y. Wu, J. A. Ren, S. J. Qian, Y. Li, W. T. Su, D. F. Zou, Q. Y. Li and J. Yang, Inorg. Chim. Acta, 2019, 487, 70–75 CrossRef CAS.
- J. Yang, Y. T. Min, M. Chen, J. Wang, H. Tian, L. Shen, Y. S. Zhai, G. W. Yang, J. H. Zou, Q. Y. Li and H. J. Cui, Inorg. Chim. Acta, 2014, 419, 73–81 CrossRef CAS.
- L. Shen, Y. T. Min, J. Wang, Y. Xu, H. J. Chen, J. Yang, X. Zhang, M. L. Wu, G. W. Yang and B. Wei, Z. Anorg. Allg. Chem., 2016, 642, 174–181 CrossRef CAS.
- H. F. Zhu, Z. H. Zhang, T. A. Okamura, W. Y. Sun and N. Ueyama, Cryst. Growth Des., 2005, 5, 177–182 CrossRef CAS.
- M. Frezza, S. Hindo, D. Chen, A. Davenport, S. Schmitt, D. Tomco and Q. P. Dou, Curr. Pharm. Des., 2010, 16, 1813–1825 CrossRef CAS PubMed.
- R. B. Franklin and L. C. Costello, J. Cell. Biochem., 2009, 106, 750–757 CrossRef CAS PubMed.
- P. F. Liguori, A. Valentini, M. Palma, A. Bellusci, S. Bernardini, M. Ghedini, M. L. Panno, C. Pettinari, F. Marchetti, A. Crispini and D. Pucci, Dalton Trans., 2010, 39, 4205–4212 RSC.
- C. Zhai, Z. Y. Yang, D. Xu, Z. K. Wang, X. Y. Hao, Y. J. Shi, G. W. Yang and Q. Y. Li, J. Solid State Chem., 2018, 258, 156–162 CrossRef CAS.
- X. Y. Shi, L. T. Tan, Y. J. Zhong, T. X. Shen, Y. H. Wang, Z. H. Qiu, Z. H. Zheng, X. G. Zhu, Y. L. Gu, X. Jiang and J. Yang, Eur. J. Inorg. Chem., 2022, 2022, e202200097 CrossRef CAS.
- E. Gao, X. Gao, F. Guan, M. Zhu, L. Liu, M. Zhang, Y. Zhang, Y. Wang, Z. Wen, Y. Zhang, Y. Zhang and Q. Liang, Eur. J. Med. Chem., 2011, 46, 160–167 CrossRef CAS PubMed.
Footnotes |
| † Electronic supplementary information (ESI) available. CCDC 2171171 and 962772. For ESI and crystallographic data in CIF or other electronic format see DOI: https://doi.org/10.1039/d2ra04768c |
| ‡ These authors contributed equally to this work and should be considered co-first authors. |
| This journal is © The Royal Society of Chemistry 2022 |

