 Open Access Article
Surface modification of TiO2/ZnO nanoparticles by organic acids with enhanced methylene blue and rhodamine B dye adsorption properties
M. Andrade-Guela,
C. Cabello-Alvarado*ab,
P. Bartolo-Pérezc,
D. I. Medellin-Bandaa,
C. A. Ávila-Orta *a,
B. Cruz-Ortizd,
A. Espinosa-Muñoza and
G. Cadenas Pliegoa
aCentro de Investigación en Química Aplicada, Saltillo, Coahuila, Mexico. E-mail: carlos.avila@ciqa.edu.mx
bCONACYT – Centro de Investigación y de Química Aplicada, Mexico
cDepartamento de Física Aplicada, Centro de Investigación y de Estudios Avanzados (CINVESTAV-Mérida), Instituto Politécnico Nacional, Mérida, Yucatán, Mexico
dUniversidad Autónoma de Coahuila, Facultad de Ciencias Químicas, Saltillo Coahuila, Mexico
First published on 6th October 2022
Abstract
The United Nations Organization (UNO) has revealed that approximately 2.1 billion people do not have access to treated water. Methylene blue (MB) and rhodamine B are produced as water pollutants in textile, plastic, and dye industries. In this study, oxalic acid or lactic acid surface-modification were applied to TiO2/ZnO nanoparticles aiming to improve antibacterial and adsorption properties. The mixtures containing the corresponding acid and nanoparticles in 0.25![[thin space (1/6-em)]](https://www.rsc.org/images/entities/char_2009.gif) :
:![[thin space (1/6-em)]](https://www.rsc.org/images/entities/char_2009.gif) 1/0.5
1/0.5![[thin space (1/6-em)]](https://www.rsc.org/images/entities/char_2009.gif) :
:![[thin space (1/6-em)]](https://www.rsc.org/images/entities/char_2009.gif) 1 ratios of ZnO and TiO2 correspondingly were subjected to ultrasonic treatment with a catenoidal ultrasonic probe coupled to a homemade ultrasonic generator with an output power of 750 W, wave amplitude of 50% and variable frequency in the range of 15–50 kHz. To verify the influence of the ultrasonic treatment, different treatment times of 30, 45, 60, and 90 min were applied. Unmodified and modified TiO2/ZnO nanoparticles were characterized by FTIR, TGA, XRD, SEM, and XPS. From the results, obtained from the physicochemical characterization, in the ZTO90 and ZTL90 samples a greater modification was shown. The SEM images showed that a coating was present on the surface of the ceramic particles of the ZTL90 sample. The O 1s deconvolution in the XPS spectra indicates a greater presence of C
1 ratios of ZnO and TiO2 correspondingly were subjected to ultrasonic treatment with a catenoidal ultrasonic probe coupled to a homemade ultrasonic generator with an output power of 750 W, wave amplitude of 50% and variable frequency in the range of 15–50 kHz. To verify the influence of the ultrasonic treatment, different treatment times of 30, 45, 60, and 90 min were applied. Unmodified and modified TiO2/ZnO nanoparticles were characterized by FTIR, TGA, XRD, SEM, and XPS. From the results, obtained from the physicochemical characterization, in the ZTO90 and ZTL90 samples a greater modification was shown. The SEM images showed that a coating was present on the surface of the ceramic particles of the ZTL90 sample. The O 1s deconvolution in the XPS spectra indicates a greater presence of C![[double bond, length as m-dash]](https://www.rsc.org/images/entities/char_e001.gif) O bonds in the ZTL90 sample. In parallel, the sample ZTL90 presented 85 and 89% adsorption efficiency for MB and rhodamine B dyes in a time of 12 min, and important antibacterial activity against E. coli and S. epidermis could be evidenced.
O bonds in the ZTL90 sample. In parallel, the sample ZTL90 presented 85 and 89% adsorption efficiency for MB and rhodamine B dyes in a time of 12 min, and important antibacterial activity against E. coli and S. epidermis could be evidenced.
1. Introduction
The lack of quality water causes the death of 1.7 million infants per year, due to diseases such as cholera, dysentery, and malaria. In addition to the problems that a contaminated water source brings, there are other contaminants, mainly chemical waste from industry, including heavy metals, dyes, and surfactants, whose presence represents a public health problem. Water pollution is one of the problems that most afflict humanity, this is a high priority issue because water is considered the main natural resource. Many industrial activities release large amounts of water contaminated with organic compounds that make up detergents, fertilizers, pharmaceutical residues, pesticides, dyes, and colorants.1,2 Dyes are one of the largest groups of environmental pollutants due to their wide use in sectors such as electronic, textile, leather, paint, automotive, food, pharmaceutical, printing, paper, solar panel, etc.3,4 Colorants and dyes are made up of highly complex aromatic unsaturated chemical structures, due to their high stability. Dyes degradation products are found to be toxic, mutagenic, and carcinogenic.5 The risk associated with these contaminants is related to their persistence in a natural environment even at a low concentration.6 Thus, the removal of dyes from effluents has been given utmost importance.7 Methylene blue (MB) and rhodamine B (RB) are basic heterocyclic dyes used extensively in the dyeing of various cotton, silk, paper, leather, etc.8 Both dyes cause serious environmental problems due to their high toxicity and accumulation in the environment.9Currently, techniques have been developed especially for the treatment and removal of contaminants, such as membrane filtration techniques, ion exchange, chemical precipitation, electrocoagulation, coagulation, flocculation, reverse osmosis, nanofiltration, absorption, activated carbon, coagulation–flocculation, electro flocculation, photocatalysis of metal degradation, adsorption.10 One option to improve these water treatment techniques is to use new nanostructured materials with antibacterial and adsorbent properties. Some of these nanometric-sized materials have characteristics that would greatly help to exert a barrier against bacteria and to adsorb organic molecules, of which some dyes are composed.11 Regarding ZnO, it is a useful material to remove contaminants in water, due to its high chemical stability, high photocatalytic efficiency, direct bandgap, anisotropic growth, high electron mobility, and simple controlling of its morphology.12–14 One of the advantages of ZnO over TiO2 is the much larger electron mobility which contributes to larger photocatalytic efficiency in the photodegradation of surrounding pollutants due to rapid electron transfer.15 However, to improve the adsorption of dyes on metal oxides, it is necessary to modify the surface of TiO2 and ZnO with organic acids such as oxalic acid or lactic acid by ultrasound-assisted. Acid molecules can penetrate the cell wall of bacteria increasing their bactericidal capacity, this depends on their dissociation capacity. The controlled modification of surfaces by organic molecules has a high potential to improve material properties.
For the surface modification of nanoparticles, there are different techniques depending on their nature, such as conventional heating, microwaves, plasma, and ultrasound. The latest three are considered as green chemistry techniques that do not generate reaction by-products and optimize the consumption of reagents, which is the reason that they are considered environmentally friendly surface activation energies.16 The use of ultrasound helps to activate chemical bonds, and to promote faster functionalization through sonochemistry, which has an unconventional energy source that is used to agitate particles in solution. High-frequency ultrasound corresponds to high-power (low-frequency) ultrasound, found between 20 and 100 kHz, and can reach frequencies of up to 2 MHz.17 In liquid systems, it has been explained that the chemical and physical effects of ultrasound are a consequence of the phenomenon of acoustic cavitation. Acoustic cavitation occurs as a response to the decrease in pressure, due to the propagation of an acoustic wave.18
There are several approaches to nanoparticle modification, for example, the study by Nakayama et al. on the modification of TiO2 with carboxylic acids and amines;19 Qu et al. chemical modification of TiO2 with carboxylic acids by solvothermal reaction;20 Da Silva et al. reported surface modification of ZnO nanoparticles with (3-glycidyloxypropyl) trimethoxysilane by sol–gel,21 and Hong et al. ZnO nanoparticles were grafted onto polystyrene through typical solution polymerization.22 So far, there is no study on the modification of both TiO2/ZnO nanoparticles using variable frequency ultrasound energy. Based on the above information, it was proposed to carry out the modification of TiO2/ZnO nanoparticles using renewable organic acids using variable frequency ultrasound to improve the adsorption and antibacterial properties of MB and rhodamine B dyes.
2. Experimental section
2.1 Reagents and materials
The nanoparticles ZnO were purchased from Sigma Aldrich (<100 nm), nanoparticles TiO2 anatase phase (21 nm), MB, rhodamine B from Sigma Aldrich, distilled water with a pH of 7 was used as a solvent to obtain the aqueous solutions.2.2 Chemical modification of nanoparticle TiO2/ZnO by ultrasound-assisted
50 mL of deionized water were added to a beaker and 10 g of oxalic acid or 10 mL of lactic acid were added, which were dispersed in an ultrasound bath for 15 min at 40 °C. Then, in a 0.25![[thin space (1/6-em)]](https://www.rsc.org/images/entities/char_2009.gif) :
:![[thin space (1/6-em)]](https://www.rsc.org/images/entities/char_2009.gif) 1 ratio, ZnO and TiO2 nanoparticles mixture were added to this solution, which was previously dispersed in 50 mL of deionized water using an ultrasound bath for 15 min at 40 °C. We used this molar ratio because a previous study indicated the highest photocatalytic activity was obtained.23
1 ratio, ZnO and TiO2 nanoparticles mixture were added to this solution, which was previously dispersed in 50 mL of deionized water using an ultrasound bath for 15 min at 40 °C. We used this molar ratio because a previous study indicated the highest photocatalytic activity was obtained.23
The mixture obtained from the two solutions was subjected to ultrasound treatment with a catenoidal ultrasonic probe coupled to a homemade ultrasonic generator with an output power of 750 W, wave amplitude of 50%, and variable frequency in the range of 15–50 kHz, at different times (30, 45, 60, and 90 min). All treatments were carried out at a temperature of 37 °C. At the end of the reaction, the solution was heated on a hot stage at a constant temperature of 80 °C for 20 min. Subsequently, it was filtered and washed several times, the nanoparticles were placed in an oven to dry at 80 °C for 24 h. Table 1 shows the identification of the nanoparticles TiO2/ZnO according to the acid and treatment time.
| Sample | Time of sonication (min) | Acid employed |
|---|---|---|
| ZT | 0 | None |
| ZTO30 | 30 | Oxalic acid |
| ZTO45 | 45 | Oxalic acid |
| ZTO60 | 60 | Oxalic acid |
| ZTO90 | 90 | Oxalic acid |
| ZTL30 | 30 | Lactic acid |
| ZTL45 | 45 | Lactic acid |
| ZTL60 | 60 | Lactic acid |
| ZTL90 | 90 | Lactic acid |
2.3 Characterization
The materials obtained were characterized by infrared spectroscopy using the Nicolet Magna 550 spectrometer with 10 scanners and a resolution of 16 cm−1, in the range of 400 to 4000 cm−1. For thermogravimetric analysis, the equipment used was, Dupont Instruments model 951 (TA Instruments), operated at a heating rate of 10 °C per main in a nitrogen atmosphere with gas flow of 50 mL min−1. The approximate weight of samples of 10 mg was analyzed in the interval of temperature from 25 to 800 °C. The X-ray diffraction (XRD) patterns were obtained using a diffractometer Siemens D5000, (KS Analytical Systems, Aubrey, TX, USA) operated at 35 kV and a current intensity of 20 mA. Samples were scanned in an angular range of 10–80° degrees (2θ). X-ray photoelectron spectroscopy (XPS) was carried out using a study was realized in the K-ALPHA spectrophotometer Thermo Scientific, model XL-30 Phillips instrument with an accelerating voltage of 5–25 keV with a monochromatic X-ray source with a binding energy of 0–1350 eV and a depth of 400 μm, there is no pre-treatment to the samples.2.4 Adsorption
The adsorption experiments were carried out by adding 20 mL of the 200 mg per solutions (MB or rhodamine B) and 20 mg of the nanoparticles to a beaker at room temperature for 12 min under stirring at 200 rpm, previously the nanoparticles were dispersed for 5 min in an ultrasonic bath. Then, every 2 min an aliquot (MB or rhodamine B solution) was taken from the experiment, finally the nanoparticles are separated by centrifugation and were analyzed by UV-vis spectroscopy at 664 nm for methylene blue and 564 nm for rhodamine B. All experiments were performed in triplicate. The adsorption efficiency percentage was calculated according to eqn (1):
 | (1) |
 | (2) |
2.5 Desorption studies
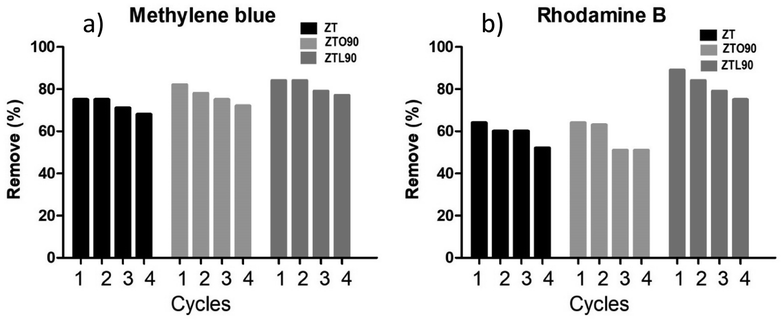
The desorption and regeneration of the adsorbents for methylene blue and rhodamine B dyes were studied for four successive cycles. In each cycle, the adsorbents were loaded with MB or rhodamine B by mixing 20 mg of the sample with 20 mL of the 200 mg L−1 concentration of dye at room temperature. The mixture was shaken for 12 min. The samples loaded with MB or rhodamine B were separated by filtration. The percentage removal of the regenerated materials was determined by the same method mentioned above.2.6 Antibacterial assay
Antibacterial activity tests were carried out with Escherichia coli (ATCC 25404) and Staphylococcus epidermis (ATCC 12228) bacteria, using the disk diffusion method.24 For E. coli, the inoculum was prepared from a culture from the previous day, 3–5 colonies were transferred to 5 mL of Luria Bertani broth (BD Bioxon, Mexico) and incubated at 35 °C for 8 h. After the incubation time, the suspension was diluted to a concentration equivalent to the 0.5 McFarland standard. For S. epidermis, the preparation of the inoculum was by direct suspension of colonies in nutrient broth until reaching a concentration equivalent to the 0.5 McFarland standard. Finally, with the prepared inocula, the Petri dishes previously prepared with Mueller–Hinton agar were inoculated and the samples were placed at ZT, ZTO90, and ZTL90, which were pressed in the form of discs (measurement of the disc), the boxes Petri were incubated at 35 °C for 18 h. After the time, the inhibition halos were analyzed. Everything was performed aseptically in duplicate.3. Results and discussions
3.1 Fourier transform infrared FTIR (ATR)
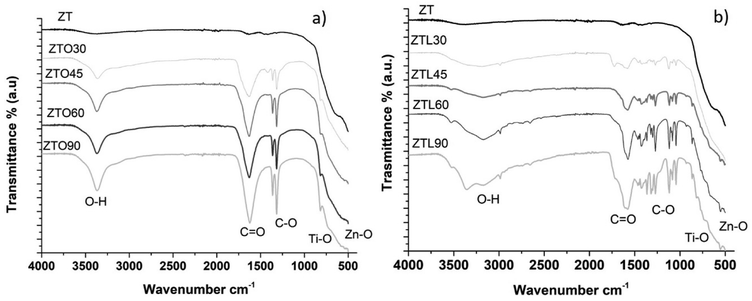
The infrared FTIR spectra obtained for the unmodified and oxalic acid-modified TiO2/ZnO nanoparticles are shown in Fig. 1a. In the spectrum of unmodified TiO2–ZnO nanoparticles, no signals are observed in the 3300 cm−1 region, while in the spectra of oxalic acid-modified TiO2–ZnO nanoparticles, broadband is observed in the 3371 cm−1 region, which corresponds to the vibrations due to stretching of the –OH bonds. The band present in the region of 1625–1630 cm−1 corresponds to the C![[double bond, length as m-dash]](https://www.rsc.org/images/entities/char_e001.gif) O stretching vibrations. The defined bands found between the region of 1324 and 1360 cm−1 correspond to the C–O bonds. The characteristic bands of titanium dioxide (Ti–O–Ti) are located at 700–850 cm−1.25 In the region of 400–500 cm−1 stretching vibrations of the Zn–O bond are found.26 Fig. 1b shows the spectrum of the TiO2–ZnO nanoparticles without ZT modification, only broadband is observed in the region of 400–500 cm−1, while in the spectra of the TiO2/ZnO nanoparticles modified with lactic acid, a broadband is shown in the region of 3150–3175 cm−1, which correspond to the vibrations due to stretching of the –OH bonds. It is observed in the samples ZTL30, ZTL45, and ZTL90, however, in the sample ZTL90 it presents two bands one at 3358 cm−1 and 3171 cm−1 corresponding to the stretching of the OH bond. The band present in the region of 1573–1579 cm−1 corresponds to the C
O stretching vibrations. The defined bands found between the region of 1324 and 1360 cm−1 correspond to the C–O bonds. The characteristic bands of titanium dioxide (Ti–O–Ti) are located at 700–850 cm−1.25 In the region of 400–500 cm−1 stretching vibrations of the Zn–O bond are found.26 Fig. 1b shows the spectrum of the TiO2–ZnO nanoparticles without ZT modification, only broadband is observed in the region of 400–500 cm−1, while in the spectra of the TiO2/ZnO nanoparticles modified with lactic acid, a broadband is shown in the region of 3150–3175 cm−1, which correspond to the vibrations due to stretching of the –OH bonds. It is observed in the samples ZTL30, ZTL45, and ZTL90, however, in the sample ZTL90 it presents two bands one at 3358 cm−1 and 3171 cm−1 corresponding to the stretching of the OH bond. The band present in the region of 1573–1579 cm−1 corresponds to the C![[double bond, length as m-dash]](https://www.rsc.org/images/entities/char_e001.gif) O stretching vibrations and is present in all samples. The peaks around 1450 and 1100 cm−1 correspond to the C–O–C bonds. The bands observed in the region of 730–850 cm−1 are characteristic of titanium dioxide (Ti–O–Ti). The bands shown in the region of 400–500 cm−1 correspond to the stretching vibrations of the Zn–O bonds. These results indicate that the methodology used to modify the TiO2–ZnO nanoparticles with oxalic acid and lactic acid was correct and time is an important factor because it is observed that the longer the ultrasound time, the better the resolution of the bands. Hong et al. superficially modified ZnO nanoparticles with polystyrene. In their study, peaks around 1454 cm−1, and 631 cm−1 are reported, which indicate the modification of the ZnO nanoparticles. The authors used heating and a flask equipped with a reflux condenser for 3 h (ref. 22) to modify. The application of ultrasound helps to reduce the reaction time. The results in both FT-IR spectra indicate that the carboxylic groups have been introduced to the surface of the nanoparticles.
O stretching vibrations and is present in all samples. The peaks around 1450 and 1100 cm−1 correspond to the C–O–C bonds. The bands observed in the region of 730–850 cm−1 are characteristic of titanium dioxide (Ti–O–Ti). The bands shown in the region of 400–500 cm−1 correspond to the stretching vibrations of the Zn–O bonds. These results indicate that the methodology used to modify the TiO2–ZnO nanoparticles with oxalic acid and lactic acid was correct and time is an important factor because it is observed that the longer the ultrasound time, the better the resolution of the bands. Hong et al. superficially modified ZnO nanoparticles with polystyrene. In their study, peaks around 1454 cm−1, and 631 cm−1 are reported, which indicate the modification of the ZnO nanoparticles. The authors used heating and a flask equipped with a reflux condenser for 3 h (ref. 22) to modify. The application of ultrasound helps to reduce the reaction time. The results in both FT-IR spectra indicate that the carboxylic groups have been introduced to the surface of the nanoparticles.
3.2 Thermogravimetric analysis (TGA)
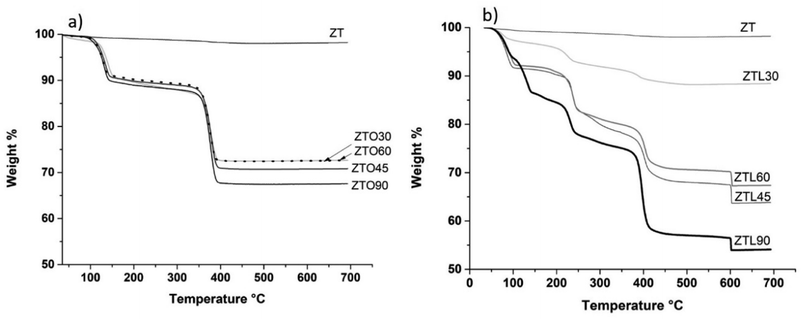
Fig. 2a it can be seen that unmodified TiO2–ZnO nanoparticles (ZT) present a weight loss of 2.04% from room temperature to 150 °C, nanoparticles modified with oxalic acid using ultrasound, present different trend and the first weight loss is 10.2%, which can be attributed to water loss. The second weight loss is 12.62% and is observed between 150–350 °C attributed to functional oxygen groups. And the third loss is 25.3% and is between 350–450 °C, which can be attributed to the loss of organic compounds.27,28 From 400 °C a stable temperature is found, this may be because the TiO2–ZnO nanoparticles modified with oxalic acid at that temperature no longer have any organic group attached to the surface.Fig. 2b shows the thermograms obtained by TGA for the unmodified TiO2–ZnO nanoparticles and those modified with lactic acid using mechanical agitation and ultrasound at 30, 45, 60, and 90 min. It can be seen that the unmodified TiO2–ZnO nanoparticles (ZT) show a weight loss of 1.9% between 50–100 °C, while the samples (ZTL60, ZTL0, ZTL45) show the same trend, which can be attributed to water loss. The second weight loss is 17.5% and is between 100–250 °C and the third loss is 31.4% and is between 250–400 °C, which are attributed to the loss of organic compounds.
The fourth loss is 35.4% within 400–600 °C and can be attributed to the degradation of oxalic acid on the surface of the nanoparticles. In the case of (ZTL30) and (ZTL90) the thermograms present different weight losses, the first loss is for (ZTL30) it is 2.7%, for (ZTL90) it is 13.5%, which is between 50–150 °C, which is attributed to water loss. The second loss is 7.4% (ZTL30) and 22.5% (ZTL90) between 150–250 °C corresponding to desorption of small molecules from the modification process or even some functional groups weak attachment in the nanoparticle surface, the third loss is 11.2% (ZTL30) and 42.5% (ZTL90) between 250–450 °C, which are attributed to the loss of organic compounds. The fourth loss is 11.7% (ZTL30) and 45.7% (ZTL90) between 400–600 °C, which can be attributed to the degradation of lactic acid on the surface of the nanoparticles. As of 600 °C, the TiO2–ZnO nanoparticles modified with lactic acid no longer present changes in their structure. Fig. 2a shows that oxalic acid functionalized with nanoparticles is more thermally stable, due to the structure of two carbonyl groups with double bonds that stabilize chemically, whereas lactic acid functionalized with nanoparticles has only one carbonyl group.
Table 1 shows the percentages of weight loss of the modified nanoparticles, where it is observed that the ZTO90 and ZTL90 samples show a higher percentage of weight loss, due to the amount of organic functional groups added. Nakayama et al. studied the modification of TiO2 nanoparticles with propionic acid and n-hexylamine and determined the total attachment rate of surface-modifier on TiO2 nanoparticles was estimated based on TGA data with the aid of simple expressions.19 In this study, it was determined using eqn (3) and the results are presented in Table 2. The results of the ZTL samples stand out with a percentage ranging from 9 to 43% of the modifier attached rate on the surface of the nanoparticles, both with oxalic acid and lactic acid is achieved surface modification of nanoparticles.
| Sample | Total attachment rate of surface modifier (%) |
|---|---|
| ZTO30 | 23.31 |
| ZTO45 | 25.27 |
| ZTO60 | 23.32 |
| ZTO90 | 28.63 |
| ZTL30 | 9.75 |
| ZTL45 | 34.34 |
| ZTL60 | 30.63 |
| ZTL90 | 43.73 |
| Total attachment rate of surface modifier on TiO2ZnO = weight loss of surface modified TiO2ZnO − weight loss of pristine TiO2ZnO | (3) |
3.3 X-ray diffraction
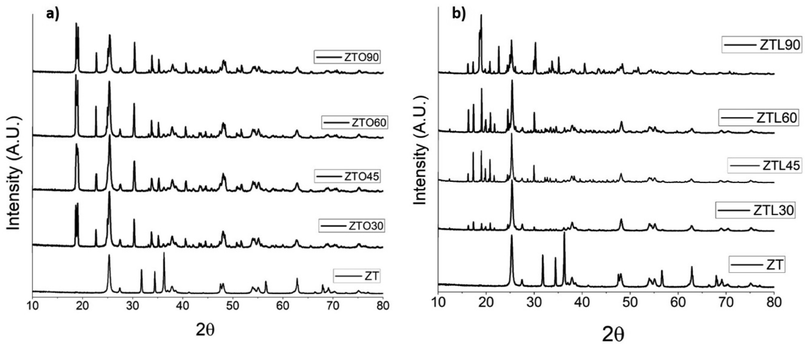
In Fig. 3a the XRD patterns of the ZTO samples at different times are presented. The spectra present two peaks at 23° and 18° in 2θ that corroborate the chemical modification with oxalic acid. It is observed that by increasing the ultrasound time intensity the peaks are more intense, in the ZT sample, which is the unmodified TiO2/ZnO nanoparticles show these peaks. The diffraction patterns of the ZTL samples are observed, in Fig. 3b in the region of 22° to 15° 2θ, four peaks are shown that increase the intensity of these peaks when the time of exposure to ultrasound increases, due to the incorporation of groups functional or the polymerization of lactic acid. Because it is in an aqueous medium and can lead to a condensation reaction due to the presence of metal oxides that help to carry out the polymerization and ultrasound energy.29 PLA presents some characteristic peaks at 2θ = 16°, 18° corresponding to the (203) plane, 21°, 22° corresponding to the (015) lattice plane, which can be assigned to the crystalline structure of this polymer, these peaks are presented in the diffraction patterns when the nanoparticle is functionalized with lactic acid. Turki et al. studied the modification of hydroxyapatite with lactic acid, they report a low affectation in the crystallinity of hydroxyapatite, the same occurs in this study since said affectation is not observed in the TiO2/ZnO nanoparticles.303.4 Scanning electron microscopy (SEM)
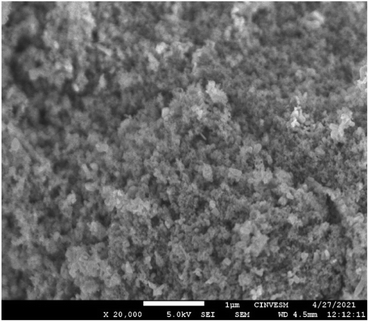
The dispersion and morphology of the TiO2 and ZnO particles before and after the modification and the effect of ultrasound, studied by SEM.Fig. 4 shows the SEM image for the ZTL sample at 20![[thin space (1/6-em)]](https://www.rsc.org/images/entities/char_2009.gif) 000×. Which did not have any treatment, where hemispherical relief particles forming agglomerates can be observed, which occur due to the nanometric size of the particles. Electrostatic and adhesion forces that can occur when combining materials of these dimensions are already used. For ceramic materials such as TiO2, the level and stability in an agglomeration are largely dependent on environmental chemistry and abiotic factors that affect the agglomeration, such as the divergence of the nanoparticle isoelectric point (pH at which the particle shows a neutral surface charge) that leads to electrostatic repulsion between particles, thus decreasing agglomeration.31
000×. Which did not have any treatment, where hemispherical relief particles forming agglomerates can be observed, which occur due to the nanometric size of the particles. Electrostatic and adhesion forces that can occur when combining materials of these dimensions are already used. For ceramic materials such as TiO2, the level and stability in an agglomeration are largely dependent on environmental chemistry and abiotic factors that affect the agglomeration, such as the divergence of the nanoparticle isoelectric point (pH at which the particle shows a neutral surface charge) that leads to electrostatic repulsion between particles, thus decreasing agglomeration.31
Images of the ZTO90 and ZTL90 samples were taken. For the samples modified with oxalic acid at 90 min (ZTO90) at 20![[thin space (1/6-em)]](https://www.rsc.org/images/entities/char_2009.gif) 000× magnifications, they are presented in Fig. 5a, it was observed that on the surface of the mixture of particles, a white coating was deposited, which can be attributed to the acid coating with which the particles were modified. Cabello et al. have modified nanoparticles with oxalic acid, finding the presence of a white coating consisting of oxalic acid in the SEM micrographs at 150
000× magnifications, they are presented in Fig. 5a, it was observed that on the surface of the mixture of particles, a white coating was deposited, which can be attributed to the acid coating with which the particles were modified. Cabello et al. have modified nanoparticles with oxalic acid, finding the presence of a white coating consisting of oxalic acid in the SEM micrographs at 150![[thin space (1/6-em)]](https://www.rsc.org/images/entities/char_2009.gif) 00×, this by modifying carbon nanotubes using ultrasound energy at the tip of 120 W, amplitude of 50% and 20 kHz.32
00×, this by modifying carbon nanotubes using ultrasound energy at the tip of 120 W, amplitude of 50% and 20 kHz.32
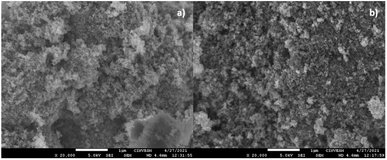 | ||
| Fig. 5 (a) Micrograph of ZTO90 by scanning electron microscopy. (b) Micrograph of ZTL90 by scanning electron microscopy. | ||
In Fig. 5b the image at 20![[thin space (1/6-em)]](https://www.rsc.org/images/entities/char_2009.gif) 000× of the ZTL90 sample is shown, in this image it can be seen that the particle size decreased concerning the ZTO90 sample and the reference blank, therefore see particles with smaller sizes and some small agglomerates covered by a white layer corresponding to polylactic acid.
000× of the ZTL90 sample is shown, in this image it can be seen that the particle size decreased concerning the ZTO90 sample and the reference blank, therefore see particles with smaller sizes and some small agglomerates covered by a white layer corresponding to polylactic acid.
It has been reported that organic acids (humic and fulvic acids) can similarly decrease agglomeration due to nanoparticle coating, leading to steric stabilization.33
Some studies have reported the use of variable frequency ultrasound with other results of dispersion of TiO2 particles in PE polymeric matrices.34
In the case of this modification that is carried out with lactic acid. The medium where the reaction was carried out is a liquid corresponding to a saturated solution of the corresponding acid, and by aping variable frequency ultrasound ranging from 15 to 50 kHz, allows vibration at different frequencies and energies to carry out the modification of TiO2 and ZnO. Likewise, according to phenomena that can occur when having different frequencies in ultrasound, the cavitation-induced bursting due to the energetic vibrations of ultrasound-sound irradiation, leads to the formation of ultrasound waves of high pressure.35
3.5 Photoelectron spectroscopy (XPS)
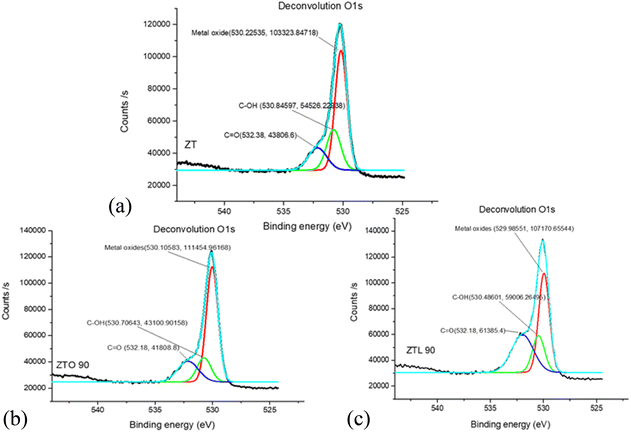
To observe the chemical environment of the oxygen atoms and their coordination with other elements when carrying out the modification of the ceramic particles with carboxylic acids, the deconvolution was performed for the O 1s of the samples ZT, ZTO90, and ZTL90 (Fig. 6a–c).Oxygen deconvolution for sample ZT showed 3 components related to C![[double bond, length as m-dash]](https://www.rsc.org/images/entities/char_e001.gif) O bonds at 532.38 eV, also with C–OH interactions 530.84 eV and at 530.22 eV correspond to metal oxides that can be Ti–O or Zn–O that exist in ceramic materials of this type.36–39 Similarly, in the ZTO90 sample, three signals corresponding to C
O bonds at 532.38 eV, also with C–OH interactions 530.84 eV and at 530.22 eV correspond to metal oxides that can be Ti–O or Zn–O that exist in ceramic materials of this type.36–39 Similarly, in the ZTO90 sample, three signals corresponding to C![[double bond, length as m-dash]](https://www.rsc.org/images/entities/char_e001.gif) O, C–OH and, metal oxides were detected at binding energy values of 532.18, 530.70 and, 530.10 eV. For the ZTL90 sample, a more intense signal corresponding to the C
O, C–OH and, metal oxides were detected at binding energy values of 532.18, 530.70 and, 530.10 eV. For the ZTL90 sample, a more intense signal corresponding to the C![[double bond, length as m-dash]](https://www.rsc.org/images/entities/char_e001.gif) O bonds could be observed at 532.18 eV compared to the reference sample and the one modified with oxalic acid, indicating that polylactic acid could form a greater amount of C
O bonds could be observed at 532.18 eV compared to the reference sample and the one modified with oxalic acid, indicating that polylactic acid could form a greater amount of C![[double bond, length as m-dash]](https://www.rsc.org/images/entities/char_e001.gif) O double bonds aided by variable frequency ultrasound energy.
O double bonds aided by variable frequency ultrasound energy.
These same components have been widely reported for O 1s deconvolutions but in other types of materials used as acid coatings.40
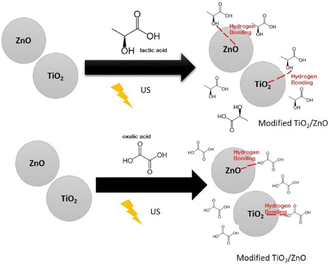
Based on TGA, FT-IR, DRX, and XPS results Fig. 7 show a possible scheme for surface change of TiO2/ZnO. The presence of functional groups such as carbonyl, hydroxyl on the surface of the nanoparticle are observed in the FT-IR spectra, likewise the weight loss in the TGA demonstrates the presence of organic compounds in the surface of nanoparticles. The possible link between the nanoparticles and the carboxylic groups is the simple hydrogen bond.
3.6 Dye adsorption
| Methylene blue | ||||||
|---|---|---|---|---|---|---|
| Sample | Langmuir | Freundlich | ||||
| k | qmax | R2 | n | if | R2 | |
| ZT | 0.03 | 95.6 | 0.9756 | 0.66 | 6.91 | 0.9698 |
| ZTO90 | 0.02 | 59.6 | 0.9767 | 0.57 | 6.27 | 0.9494 |
| ZTL90 | 0.12 | 90.3 | 0.9629 | 0.16 | 9.70 | 0.705 |
| Rhodamine B | ||||||
|---|---|---|---|---|---|---|
| Sample | Langmuir | Freundlich | ||||
| k | qmax | R2 | n | Kf | R2 | |
| ZT | 0.29 | 21.58 | 0.8637 | 0.37 | 5.88 | 0.9655 |
| ZTO90 | 0.23 | 19.31 | 0.8902 | 2.3 | 14.58 | 0.9854 |
| ZTL90 | 0.13 | 50.7 | 0.8796 | 0.76 | 6.95 | 0.9818 |
3.7 Antibacterial properties
The antibacterial activity was evaluated against two bacteria, Gram negative (Escherichia coli) and Gram positive (Staphylococcus epidermis), using the Kirby–Bauer method. The ZTO90 sample did not show inhibition against Escherichia coli and Staphylococcus epidermis, which is attributed to the fact that oxalic acid is a dicarboxylic acid, which has a very acidic pH and is considered one of the strongest organic acids. It also acts as a chelator with metal ions, which can prevent the ions from being absorbed into the cell wall of the bacteria and from exhibiting antibacterial activity.52The difference in the inhibition zone of the ZT and ZTL90 samples was evaluated since only inhibition halos were present in these samples. It was observed that nanoparticles modified with lactic acid using ultrasound for 90 min (ZTL90), have the largest diameters of inhibition against Staphylococcus epidermis Fig. 11. Menazea et al.53 studied the antibacterial activity of PVA/chitosan matrix doped by selenium nanoparticles against Gram positive and Gram negative bacteria, they attribute the antibacterial activity to the penetration of the cell wall by selenium nanoparticles. As can be seen in the two tests against Escherichia coli (Fig. 10). The antibacterial effect of TiO2 nanoparticles is associated with the decomposition of the bacterial outer membrane due to the interaction with reactive oxygen species, mainly hydroxyl radicals that lead to phospholipid peroxidation and eventually cell death. While the antibacterial activity of ZnO nanoparticles is directly related to the concentration and particle size.54 It should be noted that in the case of E. coli, the zone of inhibition was smaller than that of the antibiotic compared to S. epidermis. This is due to the fact that it is presenting resistance to the E. coli bacteria. It is becoming more and more common to find certain resistance to antibiotics. That is why new materials are being sought; new drugs that help inhibit bacteria that present resistance. The ZTL90 material can be an alternative for the inhibition of bacteria on surfaces and in water.
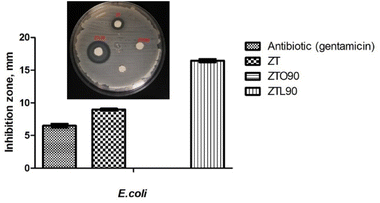 | ||
| Fig. 10 Bar graph showing the inhibition zone (mm) by antibiotic (gentamicin), ZT, ZTO90, and ZTL90 on the growth of E. coli and image of zone inhibition. | ||
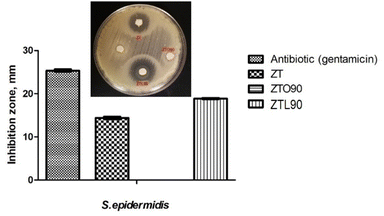 | ||
| Fig. 11 Bar graph showing the inhibition zone (mm) by antibiotic (gentamicin), ZT, ZTO90, and ZTL90 on the growth of S. epidermis and image of zone inhibition. | ||
4. Conclusions
In this study, TiO2/ZnO nanoparticles were modified using variable frequency ultrasound, it was determined that the optimal time for modification with organic acids is 90 min. The FT-IR spectra showed the signals corresponding to the bonds of carboxylic acids, this is corroborated by the study through the deconvolution of oxygen using the XPS technique. The variable-frequency ultrasound energy not only helped the chemical modification of the nanoparticles but was also used for the dispersion of the nanoparticles in the study of dye adsorption, which allowed a greater contact area between the adsorbent material and the solution. Of the colorant, therefore, it was possible to reduce time, energy, and cost. According to the characterizations carried out, it can be said that the best result was presented for the ZTL90 sample in the application of dye adsorption and antibacterial properties against bacteria such as E. coli and S. epidermidis. With respect to the study of the adsorption of dye, the percentage of adsorption efficiency was excellent with the sample ZTL90 achieving 85 and 89% adsorption of MB and rhodamine B in 12 min. The values and time obtained were greater than other materials. This study contributes to the adsorption of dyes using modified TiO2/ZnO nanoparticles using an environmentally friendly technique such as ultrasound, these new materials are an alternative for the manufacture of filters based on non-woven fabric for the removal of contaminants in water.Author contributions
M. Andrade-Guel: conceptualization, project administration, writing – original draft C. Cabello-Alvarado: writing – reviewing and editing, visualization P. Bartolo-Pérez: formal analysis, data curation D. I. Medellin-Banda: writing – original draft, methodology C. A. Ávila-Orta: investigation, validation B. Cruz-Ortiz: formal analysis, methodology G. Cadenas-Pliego: writing – reviewing and editing, data curation.Conflicts of interest
The authors declare that they have no conflict of interest.Acknowledgements
The authors are grateful to María Guadalupe Méndez Padilla, Julieta Sánchez Salazar, Jesús Alfonso Mercado Silva, Myrna Salinas Hernández for their technical support. The authors wish to thank the National Laboratory of Nano and Biomaterials (CONACyT) of the CINVESTAV-Merida for realizing the analysis of SEM-EDX and XPS, in particular PhD Patricia Quintana Owen, Dora Quintanilla Huerta, and Ing Wilian Javier Cauich Ruiz. This research was financially supported by the Mexican Nacional Council of Science and Technology (CONACyT), specifically through the project No. 320888 Convocatoria de Ciencia Básica y/o Ciencia de Frontera. Modalidad: Paradigmas y Controversias de la Ciencia 2022.References
- T. Rasheed, M. Bilal, F. Nabeel, M. Adeel and H. M. N. Iqbal, Environ. Int., 2019, 122, 52–66 CrossRef CAS PubMed.
- B. Lebeau, F. Jonas, P. Gaudin, M. Bonne and J.-L. Blin, Dyes Depollution of Water Using Porous TiO2-Based Photocatalysts BT – Environmental Nanotechnology, Springer International Publishing, 2020, vol. 4, pp. 35–92 Search PubMed.
- P. A. Carneiro, R. F. P. Nogueira and M. V. B. Zanoni, Dyes Pigm., 2007, 74(1), 127–132 CrossRef CAS.
- K. Hunger, Industrial Dyes: Chemistry, Properties, Applications Edited by Klaus Hunger (Kelkheim, Germany), Wiley-VCH, Weinheim, 2003, ISBN 3-527-30426-6 Search PubMed; K. Hunger, J. Am. Chem. Soc., 2003, 125(33), 10144 Search PubMed.
- L. D. Ardila-Leal, R. A. Poutou-Piñales, A. M. Pedroza-Rodríguez and B. E. Quevedo-Hidalgo, Mol, 2021, 26(13), 3813 CrossRef CAS PubMed.
- T. Robinson, G. McMullan, R. Marchant and P. Nigam, Bioresour. Technol., 2001, 77(3), 247–255 CrossRef CAS PubMed.
- N. Bordoloi, M. D. Dey, R. Mukhopadhyay and R. Kataki, Water Sci. Technol., 2017, 77(3), 638–646 CrossRef.
- K. Shakir, A. F. Elkafrawy, H. F. Ghoneimy, S. G. Elrab Beheir and M. Refaat, Water Res., 2010, 44(5), 1449–1461 CrossRef CAS PubMed.
- M. Hassanpour, H. Safardoust-Hojaghan and M. Salavati-Niasari, J. Mol. Liq., 2017, 229, 293–299 CrossRef CAS.
- A. J. Bora and R. K. Dutta, J. Water Proc. Eng., 2019, 31, 100839 CrossRef.
- U. Baig, M. Faizan and M. Sajid, J. Cleaner Prod., 2021, 302, 126735 CrossRef.
- N. Tripathy, R. Ahmad, H. Kuk, D. H. Lee, Y.-B. Hahn and G. Khang, J. Photochem. Photobiol., B, 2016, 161, 312–317 CrossRef CAS.
- J. Huang, S. Liu and L. Kuang, J. Environ. Sci., 2013, 25(12), 2487–2491 CrossRef CAS.
- T. Naseem and T. Durrani, Environ. Chem. Ecotoxicol., 2021, 3, 59–75 CrossRef CAS.
- D. Blažeka, J. Car and N. Klobučar, Mater., 2020, 13(19), 4357 CrossRef.
- C. J. Cabello, A. Sáenz, C. Pérez, L. López, L. Barajas, L. Cantú Sifuentes and C. Ávila, Revista Latinoamericana de Metalurgia y Materiales, 2015, 35(1), 27–33 Search PubMed.
- T. J. Mason and J. P. Lorimer, Applied Sonochemistry: The Uses of Power Ultrasound in Chemistry and Processing, Wiley-Vch, Weinheim, 2002, vol. 10 Search PubMed.
- T. J. Mason, Advances in Sonochemistry, ed. T. J. Mason, 1999, vol. 5 Search PubMed.
- N. Nakayama and T. Hayashi, Colloids Surf., A, 2008, 317(1–3), 543–550 CrossRef CAS.
- Q. Qu, H. Geng, R. Peng, Q. Cui, X. Gu, F. Li and M. Wang, Langmuir, 2010, 26, 9539–9546 CrossRef CAS.
- B. L. Da Silva, B. L. Caetano, B. G. Chiari, R. Pietro and L. A. Chiavacci, Colloids Surf., B, 2019, 177, 440–447 CrossRef.
- R. Y. Hong, J. H. Li, L. L. Chen, D. Q. Liu, H. Z. Li, Y. Zheng and J. Ding, Powder Technol., 2009, 189, 426–432 CrossRef CAS.
- G. Liu, Y. N. Zhao, C. H. Sun, F. Li, G. Q. Lu and H. M. Cheng, Synergistic effects of B/N doping on the visible-light photocatalytic activity of mesoporous TiO2, Angew. Chem., Int. Ed., 2008, 47, 4516–4520 CrossRef CAS PubMed.
- P. A. Wayne, Clinical and Laboratory Standards Institute Reference Method for Broth Dilution Antifungal Susceptibility Testing of Yeasts; Fourth International Supplement, CLSI Document, 2012, M27-S4 Search PubMed.
- G. Durango-Giraldo, A. Cardona, J. F. Zapata, J. F. Santa and R. Buitrago-Sierra, Heliyon, 2019, 5(5), e01608 CrossRef CAS.
- P. Ramesh, K. Saravanan, P. Manohar, J. Johnson, E. Vinoth and M. Mayakannan, Sensing and Bio-Sensing Research, 2021, 31, 100399 CrossRef.
- M. Stucchi, A. Elfiad, M. Rigamonti, H. Khan and D. C. Boffito, Ultrason. Sonochem., 2018, 44, 272–279 CrossRef CAS PubMed.
- M. Andrade, L. Díaz, D. A. Cortes, C. Cabello, C. Ávila, P. Bartolo and P. Gamero, Bol. Soc. Esp. Ceram. Vidrio, 2019, 58, 171–177 CrossRef.
- M. Ajioka, K. Enomoto, K. Suzuki and A. Yamaguchi, Bull. Chem. Soc. Jpn., 1995, 68(8), 2125–2131 CrossRef CAS.
- T. Turki, A. Aissa, C. G. Bac, F. Rachdi and M. Debbabi, Appl. Surf. Sci., 2012, 258(18), 6759–6764 CrossRef CAS.
- A. M. Horst, A. C. Neal, R. E. Mielke, P. R. Sislian, W. H. Suh, L. Mädler and P. A. Holden, Appl. Environ. Microbiol., 2010, 76(21), 7292–7298 CrossRef CAS.
- C. Cabello, S. Rincón, P. Bartolo, J. Ruiz-Espinoza and A. Zepeda, Fullerenes, Nanotubes, Carbon Nanostruct., 2018, 26(8), 502–509 CrossRef CAS.
- R. F. Domingos, N. Tufenkji and K. J. Wilkinson, Environ. Sci. Technol., 2009, 43(5), 1282–1286 CrossRef CAS PubMed.
- C. J. Cabello-Alvarado, Z. V. Quiñones-Jurado, V. J. Cruz-Delgado and C. A. Avila-Orta, Materials, 2020, 13(17), 3855 CrossRef CAS PubMed.
- H. Raza, K. Ameer, H. Ma, Q. Liang and X. Ren, Ultrason. Sonochem., 2021, 80, 105826 CrossRef CAS PubMed.
- K. H. Kangasniemi, D. A. Condit and T. D. Jarvi, J. Electrochem. Soc., 2004, 151(4), E125 CrossRef CAS.
- K. K. Jena, A. P. Panda, S. Verma, G. K. Mani, S. K. Swain and S. M. Alhassan, J. Alloys Compd., 2019, 800, 279–285 CrossRef CAS.
- C. Rath, P. Mohanty, A. C. Pandey and N. C. Mishra, J. Phys. D: Appl. Phys., 2009, 42, 205101 CrossRef.
- S. Sharma, S. Chaudhary, S. C. Kashyap and S. K. Sharma, J. Appl. Phys., 2011, 109, 083905 CrossRef.
- H. J. Leong and S. G. Oh, J. Ind. Eng. Chem., 2018, 66, 242–247 CrossRef CAS.
- Y. L. Pang, A. Z. Abdullah and S. Bhatia, Desalination, 2011, 277(1–3), 1–14 CrossRef CAS.
- W. Xiao, Z. N. Garba, S. Sun, I. Lawan, L. Wang, M. Lin and Z. Yuan, J. Cleaner Prod., 2020, 253, 119989 CrossRef CAS.
- A. Hassani, R. Darvishi Cheshmeh Soltani, M. Kıranşan, S. Karaca, C. Karaca and A. Khataee, Korean J. Chem. Eng., 2016, 33(1), 178–188 CrossRef CAS.
- M. Andrade-Guel, C. Cabello-Alvarado, R. L. Romero-Huitzil, O. S. Rodríguez-Fernández, C. A. Ávila-Orta and G. Cadenas-Pliego, J. Cepeda-Garza, Nanomaterials, 2021, 11(10), 2477 CrossRef CAS PubMed.
- P. Y. Reyes-Rodríguez, C. A. Ávila-Orta, M. Andrade-Guel, D. A. Cortés-Hernández, A. Herrera-Guerrero, C. Cabello-Alvarado and G. F. Hurtado-López, Ceram. Int., 2020, 46(18), 27913–27921 CrossRef.
- M. Andrade-Guel, C. A. Ávila-Orta, G. Cadenas-Pliego, C. J. Cabello-Alvarado, M. Pérez-Alvarez, P. Reyes-Rodríguez and Z. V. Quiñones-Jurado, Materials, 2020, 13(22), 5173 CrossRef CAS PubMed.
- J. Wu, J. Yang, G. Huang, C. Xu and B. Lin, J. Cleaner Prod., 2020, 251, 119717 CrossRef CAS.
- M. Saeed, M. Muneer, M. Khosa, M. Khan, N. Akram, S. Khalid, M. Adeel and S. Sherazi, Green Process. Synth., 2019, 8(1), 659–666 CAS.
- M. Andrade-Guel, C. A. Ávila-Orta, C. Cabello-Alvarado, G. Cadenas-Pliego, S. C. Esparza-González, M. Pérez-Alvarez and Z. V. Quiñones-Jurado, Polymers, 2021, 13(11), 1888 CrossRef CAS PubMed.
- G. Zhao, J. Zou, C. Li, J. Yu, X. Jiang, Y. Zheng and F. Jiao, J. Mater. Sci.: Mater. Electron., 2018, 29(8), 7002–7014 CrossRef CAS.
- S. Kerli, M. Kavgacı, A. K. Soğuksu and B. Avar, Braz. J. Phys., 2022, 52(1), 1–11 CrossRef.
- S. Suganthi, S. Vignesh, J. K. Sundar and V. Raj, Appl. Water Sci., 2020, 10(100), 1–11 Search PubMed.
- A. A. Menazea and N. S. Awwad, J. Mater. Res. Technol., 2020, 9(4), 9434–9441 CrossRef CAS.
- O. V. Zakharova and A. A. Gusev, Nanotechnol. Russ., 2019, 14, 311–324 CrossRef CAS.
| This journal is © The Royal Society of Chemistry 2022 |

