 Open Access Article
Fulvic–polyphosphate composite embedded in ZnO nanorods (FA–APP@ZnO) for efficient P/Zn nutrition for peas (Pisum sativum L.)†
Chunxiao Han,
Jingxu Yang ,
Xiaohou Zhou,
Peng Yun,
Xue Li,
Dehua Xu
 ,
Yanjun Zhong
 ,
Benhe Zhong,
Zhengjuan Yan
 * and
Xinlong Wang
 *
*
Engineering Research Center of Ministry of Education for Comprehensive Utilization and Clean Process Engineering of Phosphorus Resources, School of Chemical Engineering, Sichuan University, Chengdu 610065, China. E-mail: zjyan@scu.edu.cn; wangxl@scu.edu.cn; 838083746@qq.com; 3010408961@qq.com; 2365874977@qq.com; 1107426279@qq.com; dhxu@scu.edu.cn; yjzhong@scu.edu.cn; zhongbenhe@163.com; 505627040@qq.com
First published on 17th November 2022
Abstract
A nano-fertilizer (FA–APP@ZnO) was designed and prepared based on the copolymer of fulvic acid (FA) and ammonium polyphosphate (APP) with ZnO nanorods embedded, to tackle the antagonism between phosphorus (P) and zinc (Zn) in fertilization. FA–APP@ZnO was confirmed to revert the precipitability of H2PO4− and Zn2+ into a synergistic performance, where FA and APP can disperse ZnO nanorods, and in return, ZnO catalyzes the hydrolysis of the absorbed APP. The hydrolysis rate constant of pyrophosphates consequently increased 8 times. The dry biomass of pea (Pisum sativum L.) under the FA–APP@ZnO hydroponics for 7 days increased by 119%, as compared with the situation employing the conventional NH4H2PO4 and ZnSO4 compound fertilizer. Moreover, the uptake of seedlings for P and Zn was enhanced by 54% and 400%, respectively. The accelerated orthophosphate release due to ZnO catalysis and the well-dispersed ZnO nanorods enabled by APP met the urgent demand for P and Zn nutrients for peas, especially at their vigorous seedling stage. This work would provide a new idea for constructing nano-platforms to coordinate the incompatible P and Zn nutrients for the improvement of agronomic efficiency.
Introduction
Among the essential trace elements in plants, zinc (Zn) plays an important role in maintaining root health, activating enzymes, alleviating free-radical toxicity, and reinforcing plant tolerance to adversity.1,2 Zinc deficiency not only affects crop growth but also seriously endangers human health.3 However, the incompatibility between phosphorus (P) and Zn limits the effective use of P and Zn fertilizers. In order to achieve the nutrient balance of crops through the P/Zn co-application, it is urgently required to clarify their antagonistic mechanism to avoid or even reverse their antagonistic behavior via a proper fertilizer-structure design.The incompatibility between P and Zn can occur in both soil and plants.4 In the soil, Zn2+ and H2PO4− are easy to form precipitation and inhibit their uptake by plants under high P concentration.5,6 For plants, roots are the main organ of nutrient uptake. Excessive P application can inhibit root growth due to the inhibited expression of the PIN (PIN-FORMED) gene family,7 thus inhibiting Zn uptake by plants.4,8 Moreover, symbiotic fungi can increase the root uptake area and enhance nutrient uptake by host plants, which play an important role in the Zn uptake by plants. In Zn-deficient soils, the mycelium pathway contributes up to 24% of Zn uptake in plants.9 Whereas the infection rate of mycorrhizal decreases significantly with the increase in the P level,10 thus high-level P supply confines the Zn uptake through mycorrhizal restrain. In addition, the transport, allocation, and reuse of Zn in the plant could be affected by P.11–13 Furthermore, the Zn nutrient out of the rhizosphere is transported to the root surface via diffusion. The relatively large radius and high electric charge of Zn2+ lead to its poor diffusion capacity compared with other nutrients. Although more explanations based on molecular biology are lacking, the P/Zn antagonism does exist in the soil–plant system. When P and Zn fertilizers are simultaneously applied to the soil, the co-precipitation between P and Zn can easily occur at the beginning. Over time, the inhibited zinc uptake may occur due to the inhibited mycorrhizal and root growth under high P.
The antagonistic nutrients can be released in differential periods through a heterogeneous structure design of fertilizer, and a passable effect was obtained.14,15 Besides, the phyto-nanotechnology is expected to provide a solution to reverting the P/Zn antagonism towards a synergistic performance.16–18 One case is that Zn can act as a cofactor for the P-solubilizing enzymes (i.e., phosphatase and phytase, etc.) to mobilize the inert insoluble or organic phosphorus in the soil. Nano ZnO significantly increased the activity of the P-solubilizing enzymes in the soil, which in turn resulted in the increase of P uptake by mung bean by 10.8%.19
Peas originated thousands of years ago in western Asia and the Mediterranean region, as one of the world's important cultivated crops. The growth of tested pea seedlings (Pisum sativum L.) is sensitive to the supply of nutrients, especially of P, together with their nature for cold and water resistance, peas are suitable for evaluating the effects of P/Zn supply on plant growth in a hydroponic environment.
To this end, we proposed a composite structure (FA–APP@ZnO) in which the ionic Zn nutrient from conventional zinc phosphates was replaced by ZnO nanorods inserted into a matrix formed by the polycondensation of fulvic acid (FA) and ammonium polyphosphates (APP). Such materials were characterized for their morphological, structural, spectroscopic, release kinetic, dispersion properties, and nutritional effects on pea plants. To the best of our knowledge, no fertilizer strategy has been developed to address these P and Zn nutrient interactions. The hierarchical nano-fertilizer described here enabled the structural and surface chemistry to coordinate the release of multiple elements, which could provide a facile route to develop nano-fertilizer technology, for efficient and balanced plant nutrition.
Experimental section
Reagents
Zinc acetate dihydrate (ZnAc2, Zn(CH3COO)2·2H2O, 99.0%), sodium hydroxide (NaOH, 98.0%), hydrochloric acid (HCl, 38.0%), nitric acid (HNO3, 68.0%), sodium hypochlorite (NaClO, 5.50% active chlorine), disodium hydrogen phosphate dodecahydrate (Na2HPO4·12H2O, 99.0%), and zinc sulphate heptahydrate (ZnSO4·7H2O, 99.5%) were purchased from Chengdu Chron Chem. (China). Sodium dihydrogen phosphate (NaH2PO4, 99.0%) and urea (CO(NH2)2, 99.0%) were offered by Chengdu Jinshan Chemical Test (China). Fulvic acid (C14H12O8, 85.0%) was from Shanghai Macklin Reagent (China). Ammonium dihydrogen phosphate (NH4H2PO4, 99.0%) was from Tianjin Zhiyuan Reagent (China). The reactive oxygen species (ROS) assay kit (2′,7′-dichlorofluorescein diacetate, DCFH-DA, 10 mM) was provided by Beyotime Biotech. (China). All chemicals were of reagent grade and used without further purification. Deionized water with 18.25 MΩ cm resistivity was used throughout the experiments.Synthesis of FA–APP@ZnO
ZnO nanorods were prepared by the hydrothermal reaction of ZnAc2 and NaOH at 180 °C for 3 h via the hydrolysis of ZnAc2 in a strongly alkaline environment.20 The details are as follows: firstly, 0.6 g of ZnAc2·2H2O was dissolved in 40 mL water to form solution A, while 2 g of NaOH was dissolved in 20 mL water to form solution B. Solution B was then poured into solution A under constant agitation. The clear solution obtained was transferred into a hydrothermal reaction kettle with Teflon lining and maintained for 3 h in a 180 °C oven. Finally, the product was water-washed three times and centrifuged for 5 min (27![[thin space (1/6-em)]](https://www.rsc.org/images/entities/char_2009.gif) 000g acceleration) after each washing. The solid product was freeze-dried overnight to obtain ZnO nanorods as powder. As for the subsequent copolymerization of FA and APP, 0.1 g of the synthesized ZnO nanorods were mixed and ground with 0.2 g of NH4H2PO4, 0.104 g of urea, and 0.3 g of FA as the precursor powder. The precursor was then loaded in a 20 mL glass vial and calcined in a muffle furnace. The calcination was kept at 170, 200, 230, or 260 °C for 10 min in air. The precursor was finally pyrolyzed and polymerized to form the designed FA–APP@ZnO nano-fertilizer.
000g acceleration) after each washing. The solid product was freeze-dried overnight to obtain ZnO nanorods as powder. As for the subsequent copolymerization of FA and APP, 0.1 g of the synthesized ZnO nanorods were mixed and ground with 0.2 g of NH4H2PO4, 0.104 g of urea, and 0.3 g of FA as the precursor powder. The precursor was then loaded in a 20 mL glass vial and calcined in a muffle furnace. The calcination was kept at 170, 200, 230, or 260 °C for 10 min in air. The precursor was finally pyrolyzed and polymerized to form the designed FA–APP@ZnO nano-fertilizer.
In order to independently evaluate the function of each component of FA–APP@ZnO (FA, APP, and ZnO nanorods), an additional fertilizer containing only APP and ZnO nanorods (APP@ZnO) was prepared to clarify the role of FA by comparing with FA–APP@ZnO. The preparation of APP@ZnO was the same as that of FA–APP@ZnO, with the only difference being that no FA participated during the calcination step.
Material characterization
The morphology and constituent of FA–APP@ZnO were characterized using scanning electron microscopy (SEM, TESCAN, VEGA3) coupled with an energy-dispersive X-ray spectrometer (EDX, Bruker, QUANTAX). The Talos F200S transmission electron microscope (TEM) was used to characterize the ZnO nanorods under a 200 kV acceleration voltage. After that, the sample was subjected to the selected area electron diffraction (SAED) analysis. X-ray diffraction (XRD) patterns were acquired using an Empyrean diffractometer (PANalytical, Netherlands) at a scanning rate of 0.2° s−1 using the Cu Kα radiation. The functional groups in FA–APP@ZnO were detected using a Fourier-transformed infrared spectrometer (FT-IR, PerkinElmer, Frontier) with a scan range of 4000–400 cm−1 and a 1 cm−1 resolution. The quantitative analysis for the various P species in FA–APP@ZnO was conducted using ICS-600 ion chromatography (IC) from Dionex, where the test details can be found in our previous work.21 The surface chemical states of FA–APP@ZnO were measured using Raman spectroscopy (Thermo Fisher, DXR, λex = 780 nm) and X-ray photoelectron spectroscopy (XPS, Kratas, AXI Sultra DLD, Al-Kα X-rays). Thermogravimetric analysis coupled with infrared spectroscopy (TGA-IR) was carried out using a NETZSCH STA449F3 analyzer interfaced with a PerkinElmer Frontier FT-IR spectrometer. The precursor was heated from 30 to 300 °C at a rate of 5 °C min−1 and a 20 mL min−1 nitrogen flow that delivered the pyrolysis gas to the IR analysis chamber. Theoretical calculations of APP adsorbed on the ZnO crystal surface and the APP hydrolysis were conducted on Gaussian 16 platform. Based on the b3lyp density functional theory (DFT), 6-311+G(d,p)/Lanl2dz(Zn) mixed basis was used to optimize the molecular structure and search for the transition states. The ZnO surface was represented by a (ZnO)42 slab model. To stabilize the cluster, we saturated the polar Zn and O-terminated surfaces with four dissociated water molecules. The approximate solvent effects of the water were taken into consideration with the aid of the solvation model based on density. The Laplacian bond order (LBO) calculation was performed using Multiwfn.22Plant cultivation
FA–APP@ZnO was dispersed evenly in an aqueous solution by ultrasound treatment to evaluate its effects on the vegetative growth of pea seedlings. After being bought from a local market in Chengdu, pea seeds were first sterilized using NaClO solution containing 5.50% active chlorine for 5 min. Then, the seeds were washed repeatedly and soaked in water for one night. The soaked seeds were paved on a 33 × 5 cm porous polyethylene pan and covered with wet filter papers. After germination for 2–3 days at 25 °C, seeds with the same germination degree were selected and finally root-exposed to a nutrient solution at a pH of 6.20. Conventional fertilizers of NH4H2PO4 and ZnSO4·7H2O were dissolved in pure water as the control. NH4H2PO4 and ZnO nanorods were dissolved and dispersed as the second treatment (H2PO4− + ZnO). All the four aqueous dispersions used for the pea cultivation (control (H2PO4− + Zn2+), H2PO4− + ZnO, APP@ZnO, and FA–APP@ZnO) were kept the same concentration of P and Zn. The pea seedlings were cultured daily for 16 h in light (50 μmol m−2 s−1) and 8 h in darkness at 75% relative humidity and 20 °C temperature.Plant growth analysis
After 7 days of root exposure, seedlings were harvested and their length/weight of root/stem was measured. Then, a de-enzyme process at 105 °C for 10 min was followed. When dried to a constant weight at 80 °C, the root and stem were weighted to obtain their dry weight. Around 0.02 g of the dried plants were ground into powder, fully immersed in 3 mL of 68.0% HNO3, and digested at 25 °C for 24 h. The solution was diluted to 30 mL and finally filtered through a dried polytetrafluoroethylene filter (0.45 μm). The filtrate was used to determine the accumulation of P and Zn in plants using inductively coupled plasma optically emission spectrometry (ICP-OES) (PerkinElmer, Optima 7000). Regarding the ICP-OES precision, the relative standard deviation (RSD) of measurements for a 1 mg L−1 P/Zn mixed standard solution was within 0.5% after repeated determination, 10 times, and within 2% for a 4 hour continuous determination. The detection limits were 5 μg L−1 for P and 0.5 μg L−1 for Zn. The linearity of the ICP-OES is illustrated in Fig. S1,† the ESI.† DCFH-DA was used to measure the ROS generated in the seeding roots with details exhibited in our previous study.23Zeta potential and hydrodynamic size distribution
Malvern ZS90 dynamic light scattering (DLS) was used for measuring the zeta (ξ) potential measurement at an FA–APP@ZnO concentration of 0.04 wt% (pH = 6.00), and the hydrodynamic size distribution was obtained using the Malvern's Mastersizer 3000E instrument. All the other solutions used for the ξ potential and size distribution measurements were formulated in accordance with the P/Zn content in the FA–APP@ZnO solution.Fluorescence localization in vivo
Based on the commonsensible fluorescence effect of ZnO,24 Synergy H1 microplate reader from Agilent (BioTek) was used to measure the photoluminescence (PL) curves of the ZnO nanorods. Four excitation wavelengths (285, 305, 325, and 345 nm) were selected for the determination. The lower limit of the wavelength range of the received fluorescence signal was the corresponding excitation wavelength plus 30 nm, and the upper limit was uniform at 700 nm. According to the optimal excitation wavelength and the receiving channel determined by the PL curves, the corresponding fluorescence microscope (Nikon, Ts2R FL, DAPI) was used to mark the possible FA–APP@ZnO nanoparticles in plant tissues (ZnO nanorods embedded as the fluorescent markers).Statistics
The plant growth data are represented as mean ± standard deviation (SD) in triplicates for each concentration. Statistical analyses of the data were performed using SPSS Statistics (IBM) using one-way analysis of variance (ANOVA) followed by a Waller–Duncan post hoc test.Results and discussion
Synthesis of FA–APP@ZnO
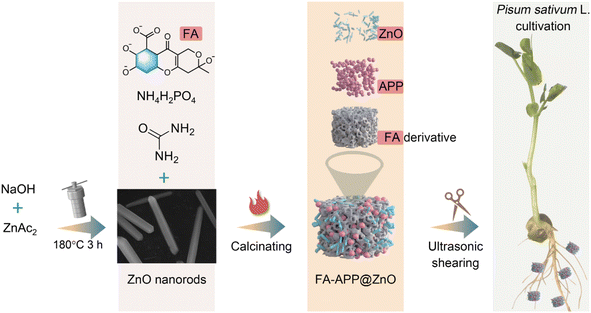
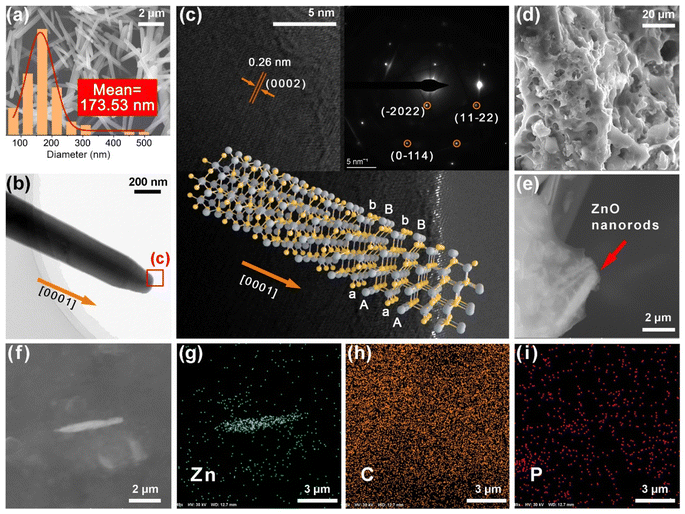
Fig. 1 shows a schematic of the FA–APP@ZnO fabrication process and its application in pea hydroponics. The SEM image and corresponding size statistic in Fig. 2a show that the prepared ZnO nanorods have a mean diameter of 173.53 nm and a length of 2–5 μm. In the high-resolution TEM images (Fig. 2b and c), the crystal planes (0 0 0 2) from ZnO (PDF 01-089-1397) were found with a spacing of 0.26 nm. The SAED pattern showed more ZnO lattices, such as (−2 0 2 2), (1 1 −2 2), and (0 −1 1 4), as shown in the inset of Fig. 2c. The ZnO nanorods belong to the simple hexagonal (hP) system with a wurtzite structure. As a result of the full development in the direction [0 0 0 1], ZnO presents a two-dimensional rod shape with a large aspect ratio.25 As shown in the molecular structure representation in Fig. 2c, layers of O2− (gray balls) and Zn2+ (yellow balls) are alternately stacked along the [0 0 0 1] orientation, forming AaBb closed-packed arrangements. The tetrahedral spaces between the lattices provide sites for the subsequent chemisorption and erosion due to the APP/FA surfactants.Fig. 2d and e are SEM images of the copolymerization product. NH3, H2O, and CO2 escaped when the phosphate monomers condensed into APP molecules via the P–O–P bonding, and reasonable cavities, therefore, remained, forming the porous composite after calcination.26 It can also be observed from Fig. 2e that the ZnO nanorods were interlaced in the formed FA–APP@ZnO. The strip area full of Zn emerged, as shown in Fig. 2f–I, indicating that the major structure of the ZnO nanorods survived the calcination. The distribution of carbon (C) and P in the composite matrix corresponded to the ratio of FA and NH4H2PO4 in the raw material, that is, more C and less P. The formation mechanism of FA–APP@ZnO is discussed as follows.
The Zn2+ concentration in the hydrothermal synthesis was 46 mM; meanwhile, two doses of OH− were tried (833 mM or 333 mM). These two solutions were defined as solutions B1 (pH = 13.35) and B2 (pH = 11.60). The reactant for dehydration in solution B1 was Zn(OH)42−, while in solution B2, the neutral Zn(OH)2 dominated.27 After nucleation, the reactant Zn(OH)42− mainly combined with Zn2+ on the (0 0 0 1) crystal plane and dehydrated, resulting in a more sufficient growth along the [0 0 0 1] direction (Fig. S2†). The causes for this are that the developing ZnO is always prone to the lowest energy of the system, but the (0 0 0 1) plane has the highest energy, so the accumulation tends to occur on the high-energy surface to minimize its area.20 In contrast, Zn(OH)2 in solution B2 will actively attach to O2− on every available crystallographic plane, resulting in the multi-direction developed and flower-like grains (Fig. S2†). The success of the process with solution B2 depends on a considerable dynamic rate of Zn(OH)2 transferring onto the crystal interface rather than the stability of the adsorbents (lower global surface energy). Flower-like ZnO microcrystals should be avoided because their size in all directions reaches the micron scale, and it is difficult for plants to absorb so large particles.28 Therefore, the alkalinity at pH = 13.35 was herein adopted to attain these slender ZnO nanoparticles.
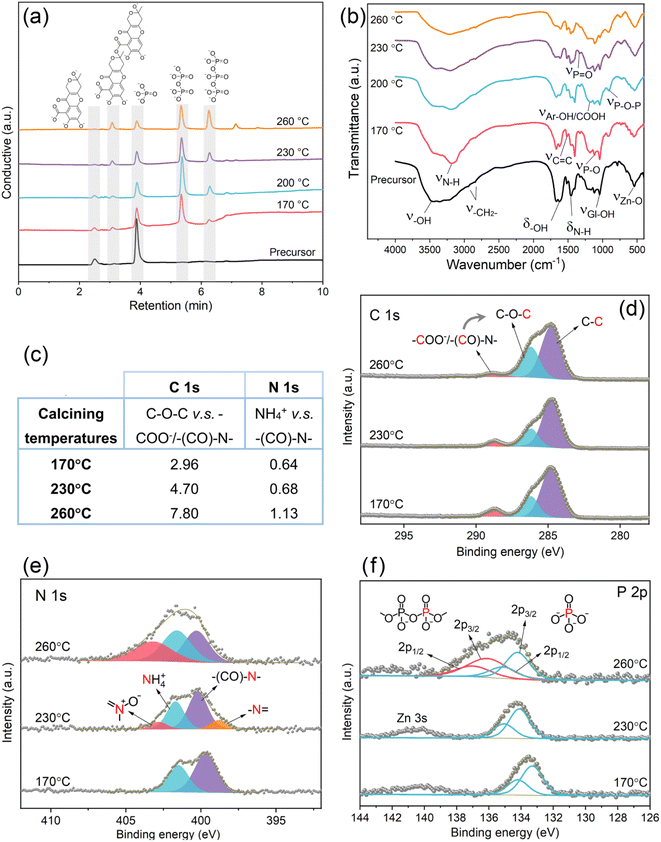
After the conditions for preparing the rod-like ZnO were understood, the focus was shifted to the events, which occurred on the interface of ZnO, APP, and FA in the subsequent calcination. As shown in the IC results (Fig. 3a), the phosphate monomer (PO43−) from the precursor is converted into polyphosphates, and longer molecular chains are obtained with the escalated temperature in the calcination.29 Meanwhile, the chromatographic peak of FA (C14H8O84−) defined at a retention time of around 2.5 min vanished with the enhanced temperature, and FA gradually transformed into fulvic acid dimers (C28H16O156−) with a longer retention time. It can be speculated that FA extended its carbon skeleton through intermolecular dehydration, which might provide a more reliable steric hindrance for the precipitation resistance of ZnO nanorods.
Fig. 3b shows FT-IR spectra of the precursor and products at different calcination temperatures. The wide peak at 400–600 cm−1 is attributed to the stretching vibration (ν) of the Zn–O bond.30 While NH4H2PO4 and CO(NH2)2 from the precursor are responsible for the stretching vibration peaks of P–O, P![[double bond, length as m-dash]](https://www.rsc.org/images/entities/char_e001.gif) O, and N–H bonds.31,32 FA in the raw material shows several peaks such as for ν–OH/δ–OH, ν–CH2−, νC
O, and N–H bonds.31,32 FA in the raw material shows several peaks such as for ν–OH/δ–OH, ν–CH2−, νC![[double bond, length as m-dash]](https://www.rsc.org/images/entities/char_e001.gif) C, and νAr-OH/COOH.33 These active groups imply the potential of chelating ZnO. After calcination, the characteristic peak of the P–O–P bond appears (νP–O–P), indicating that the NH4H2PO4 monomers have initiated polymerization, which coincides with the IC results as well. In Fig. 3b, νN–H and δN–H fade away with the enhanced temperature, which demonstrates the loss of N for both the NH4H2PO4 monomer and CO(NH2)2 as the condensation agent during the chain propagation of APP.21,34 The additional information indicates the occurrence of pyrolytic reactions for FA because from 170 to 260 °C, the peaks of the oxygen-containing groups such as ν–OH/δ–OH, νCOOH, and νAr-OH receded. The result of FA pyrolysis indicates a higher graphitization degree, as shown in the Raman spectra (Fig. S3†), where IG/ID reaches the highest value of 2.32 at 230 °C.35–37 In addition, some polyphosphate-related peaks, such as νP–O–P,sym(Q2), νMO−, and νPO2, sym(Q2) overcome the background caused by ZnO fluorescence and appear at the calcination temperatures of above 230 °C, as shown in Fig. S3.† All these indicate that the APP chains were indeed elongated during calcination.38
C, and νAr-OH/COOH.33 These active groups imply the potential of chelating ZnO. After calcination, the characteristic peak of the P–O–P bond appears (νP–O–P), indicating that the NH4H2PO4 monomers have initiated polymerization, which coincides with the IC results as well. In Fig. 3b, νN–H and δN–H fade away with the enhanced temperature, which demonstrates the loss of N for both the NH4H2PO4 monomer and CO(NH2)2 as the condensation agent during the chain propagation of APP.21,34 The additional information indicates the occurrence of pyrolytic reactions for FA because from 170 to 260 °C, the peaks of the oxygen-containing groups such as ν–OH/δ–OH, νCOOH, and νAr-OH receded. The result of FA pyrolysis indicates a higher graphitization degree, as shown in the Raman spectra (Fig. S3†), where IG/ID reaches the highest value of 2.32 at 230 °C.35–37 In addition, some polyphosphate-related peaks, such as νP–O–P,sym(Q2), νMO−, and νPO2, sym(Q2) overcome the background caused by ZnO fluorescence and appear at the calcination temperatures of above 230 °C, as shown in Fig. S3.† All these indicate that the APP chains were indeed elongated during calcination.38
XPS analyses concerning the C 1s, N 1s, and P 2p scans were performed for more structural information (Fig. 3c–f). As depicted in the C 1s spectra in Fig. 3d, FA–APP@ZnO obtained at each temperature contained carboxyl/amide carbon (–COO−/–(CO)–N–), ester carbon (C–O–C), and aliphatic carbon (C–C).39,40 FA and its pyrolytic derivatives contributed to most of the resulting carbon matrix in FA–APP@ZnO, except for the –(CO)–N– group at the binding energy of 288.7 eV, which is attributed to the original urea. The visible evolution is the relative abundance of these carbon species with the calcination temperatures. The ratio of C–O–C to COO−/–(CO)–N– for peak areas increased from 2.96 at 170 °C to 7.80 at 260 °C (Fig. 3c). Since C–O–C represents the ester or ether formed by the FA's intermolecular dehydration, FA polymerization here indicates a strong temperature dependence, which is also consistent with the IC results (Fig. 3a) that FA monomer-derived polymers with the C–O–C bonding are more generated at a higher calcination temperature.
The N 1s spectra shed light on the transformation of NH4+ in NH4H2PO4 and raw urea, as shown in Fig. 3e. NH4+ and urea nitrogen (–(CO)–N–) are partially converted into pyridine oxide (402.9 eV) and pyridine nitrogen (398.7 eV) with enhanced temperatures.36 Therefore, NH4+ dissociated from urea and NH4H2PO4 during the pyrolysis could be involved in the construction of the carbon skeleton, and their nitrogen was transferred into the FA-derived aromatic rings. Based on the corresponding N 1s peak areas, the ratio of NH4+ to –(CO)–N– was enhanced from 0.64 at 170 °C to 1.13 at 260 °C (Fig. 3c), indicating that the transformation of urea to NH4+ also occurred during the nitrogen doping. This is another corroboration of urea's assistance in the NH4H2PO4 polymerization. NH3 released from urea (CO(NH2)2) eventually ammoniated the –OH of the formed polyphosphates.29
The P 2p spectra also traced the APP chain propagation. As shown in Fig. 3f, the XPS peaks of orthophosphate and polyphosphate are, respectively, split into 2p1/2 and 2p3/2 peaks, while the peaks attributed to polyphosphate arise at higher temperatures (260 °C for example), emphasizing the need of an adequate heat supply for a smooth polymerization.
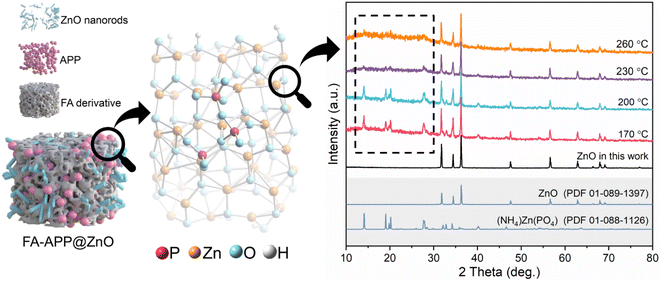
Fig. 4 shows XRD patterns of ZnO nanorods and FA–APP@ZnO calcined at different temperatures. Clearly, the calcined products at all temperatures showed characteristic peaks of raw ZnO. This corroborated the conclusion, drawn from Fig. 2, that the majority of ZnO remained stable during the calcination. More importantly, the (NH4)Zn(PO4) phase (PDF 01-088-1126) was found, indicating that the APP melt eroded the ZnO nanorods via the formation of the P–O–Zn bond on the crystal surface. The peak for the (NH4)Zn(PO4) phase faded slightly with the enhanced temperature. The causes for this might be that the phosphates polymerize to form a mischcrystal containing polyphosphates with different chain lengths, thus, to some extent, disturbing the crystal structure of (NH4)Zn(PO4).
To sum up, 230 °C was considered as the optimal calcination temperature for the FA–APP@ZnO fabrication, at which a satisfactory polymerization degree of APP (Fig. 3a) and uniformity of the carbon skeleton (Fig. S3†) were obtained. A higher temperature, such as 260 °C, causes a large loss of oxygen-containing functional groups in FA (Fig. 3b). In Fig. 5a, the differential thermogravimetric (DTG) curve for this calcination showed two weight-loss peaks at the temperature ranges of 30–130 °C and 130–250 °C. The melting and decomposition of urea occurred in Stage I (30–130 °C). A small amount of CO2 escaped from the degraded urea, as found in the simultaneous IR spectra for the pyrolysis gas, where a weak CO2 absorption peak appears at 30–130 °C (Fig. 5b). The polymerization reactions of phosphates and FA overlapped in Stage II (130–250 °C). NH3/CO2 and H2O were seen in the IR spectra of stage II (Fig. 5b), as a result of the APP chain propagation and the FA dehydration, respectively. Meanwhile, decarboxylating the FA into the corresponding carbon matrix also contributes to CO2 and SO2, as shown in Fig. 5b. By combining the results of XPS and TGA-IR, the process in which the precursor pyrolyzed to FA–APP@ZnO was summarized, as shown in Fig. 5c.21
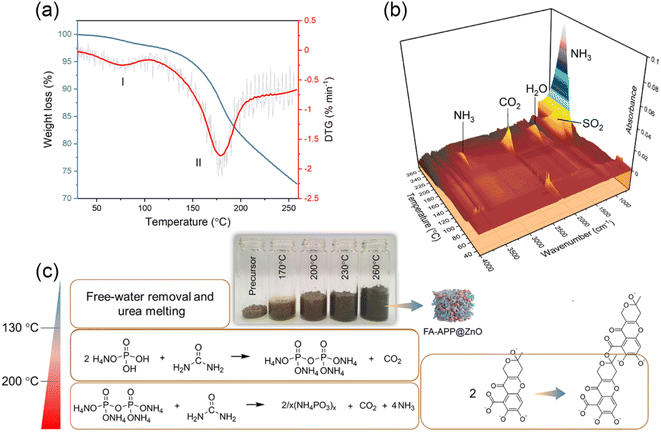 | ||
| Fig. 5 (a) Thermogravimetric analysis coupled with (b) infrared spectroscopy and (c) derived overall reaction processes for the formation of FA–APP@ZnO. | ||
Hydrolysis and release of P/Zn in FA–APP@ZnO
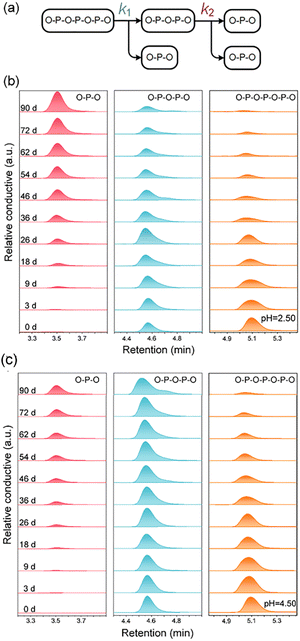
Monitoring the hydrolysis of APP in a model solution will help in understanding the mechanism of molecular degradation. One prerequisite is that the plant can only directly absorb the orthophosphate.23 Therefore, the hydrolysis rate (the rate at which the polyphosphate is broken into the orthophosphate monomer) can be used as an indicator of the P supply intensity to plants. The APP's hydrolysis exhibits a cascade pathway as depicted in Fig. 6a, and the bond cleavage of P2O74− (O–P–O–P–O) and P3O105− (O–P–O–P–O–P–O) are both considered one-order reactions.41In the hydrolysis experiment for up to 90 days, bare APP (Fig. 6b) and APP from FA–APP@ZnO (Fig. 7b) go through different P-species conversion pathways. The lower pH accelerates the hydrolysis of dissociative APP.41 PO43− (O–P–O) always increases gradually with increasing time as a result of O–P–O–P–O and O–P–O–P–O–P–O cleavages. The O–P–O under the bare APP condition is almost derived from O–P–O–P–O–P–O hydrolysis (Fig. 6b) and O–P–O–P–O is kept under dynamic equilibrium. While APP was absorbed on ZnO, it was distinctly different. O–P–O–P–O rapidly hydrolyzes to O–P–O, as shown in Fig. 7b, even at a higher pH of 5.50 than that of the bare APP (pH = 2.50).
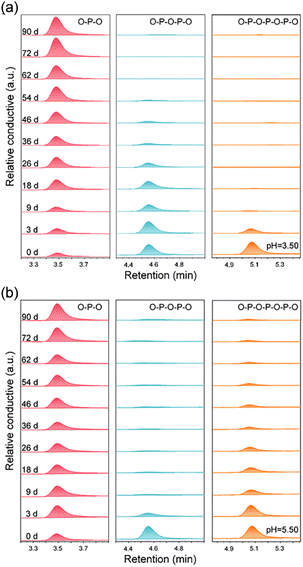 | ||
| Fig. 7 The evolution of the P-species distribution of APP as a function of the hydrolysis time: (a) FA–APP@ZnO hydrolysis at pH = 3.50, and (b) FA–APP@ZnO hydrolysis at pH = 5.50. | ||
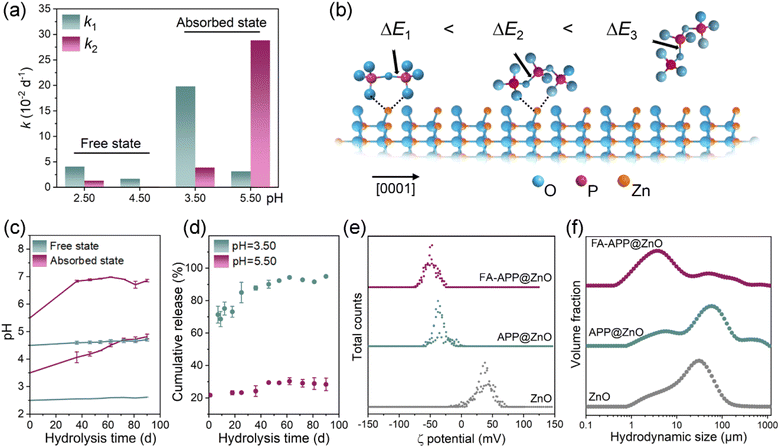
The unusually increased hydrolysis rate of O–P–O–P–O in the FA–APP@ZnO dispersion system might be related to the selective catalysis of the ZnO nanorods. As can be seen from the results of the hydrolysis kinetics analyses (see Text S1 in the ESI† for analytical details), the hydrolysis rate constant k2 of the absorbed O–P–O–P–O in FA–APP@ZnO reaches 3.89 × 10⁻² d−1 at pH = 3.50, which is higher than that of the free state (Fig. 8a). At a higher pH = 5.50, the value of k2 for the absorbed state spurts to 28.84 × 10⁻² d−1, which is 9.2 times that of k1 for the corresponding absorbed state. As the DFT calculations indicated in Fig. S6,† the surface Zn2+ of the ZnO nanorods catalyzes and promotes the hydrolysis of O–P–O–P–O or O–P–O–P–O–P–O due to the absorbed state's ring strain.
As demonstrated by the optimized structural domains in Fig. S6b–d,† the free-state chain, for example, free O–P–O–P–O–P–O in Fig. S6b,† possesses the lowest hydrolysis-rate constant (k1, as shown in Fig. 8a) and the highest activation energy (ΔE3), due to the absence of the ring strain. The ring formed by O–P–O–P–O and Zn2+ (Fig. S6d†) manifests smaller P–O cleavage difficulty than the ring of O–P–O–P–O–P–O and Zn2+ (Fig. S6a,† ΔE1 < ΔE2). The causes are that the oligomeric ring provides the highest ring strain, which is conducive to a water attack. The Laplacian bond order (LBO) can be used to quantify this ring strain and the reactivity of cyclic compounds.42 The LBO values of the corresponding chemical bonds are indicated by the black arrows in Fig. S6b–d.† It can be seen that the LBO value of the end-group P–O bond on the main chain of the adsorbed trimer reaches 0.099 (Fig. S6c†), which is significantly smaller than that of the free trimer at the same P–O position (Fig. S6b,† LBO = 0.150), indicating that the P–O bond of the adsorbed trimer possesses higher reactivity compared to the one in the free state due to the larger ring strain. The P–O bond of the adsorbed dimer shows an even smaller LBO value (Fig. S6d,† LBO = 0.087) due to its larger ring strain than the adsorbed trimer. Therefore, the adsorbed dimers exhibit the highest reaction activity, and their P–O bonds of a lower bond order are liable to the chain cleavage and the hydrolysis by water molecules, thus showing the lowest activation energy (ΔE1) and the largest reaction rate constant (k2). The ZnO nanorod in FA–APP@ZnO acts not only as a nutrient but also as an “accelerator” for the P nutrient release (Fig. 8b).
In the 90-d hydrolysis and the nutrient-release process, the pH values of the FA–APP@ZnO dispersions with different initial acidities increase significantly and tend to approach a neutral value (pH = 7.00), while the free states' acidity kept is nearly constant throughout the investigation period (Fig. 8c). The ammonium fulvic acid (FA–O−NH4+) in the FA–APP@ZnO system might act as a pH buffer. After down-regulating the pH of the dispersion to 5.50 or even 3.50 by HCl, FA–O−NH4+ can consume the strong acid HCl to produce FA (FA–O−H+). Thus, the pH rebounds:
| FA–O−NH4+ + HCl → FA–O−H+ + NH4Cl | (1) |
The initial acidity can affect the dominant form of Zn. As illustrated in Fig. 8d, more than 90% of ZnO dissolves to release Zn2+ at a low pH = 3.50, and the maximum dissolution is accomplished nearly on the 60th day. The release of Zn2+ gradually slows down with time, not only due to the decreasing driving force as a result of the Zn2+ concentration increase in the liquid phase but also because the FA–O−NH4+ buffer lowers the acidity. ZnO can effectively maintain its form of nanoparticles at a higher pH value (Fig. 8d). In the incubation solution with pH = 5.50, only 30% of ZnO was dissolved to release Zn2+ at the end of 90 days. During actual plant cultivation, the pH of the growth medium may get to 5.50–7.50, so it can be speculated that most of the Zn nutrients in the FA–APP@ZnO would preserve the morphology of the original ZnO nanorods and participate in the plant nutrient supply. The absolute ξ potential of the FA–APP@ZnO dispersion is higher than that of ZnO and APP@ZnO (Fig. 8e). Besides, the hydrodynamic size of FA–APP@ZnO in the dispersion is the smallest (Fig. 8f). FA derivatives and APP in FA–APP@ZnO may act as surfactants to disperse the colloidal particles of ZnO nanorods. ZnO can be thus smoothly assimilated by plants rather than coagulated on the root surface.
Effect of FA–APP@ZnO on plant growth
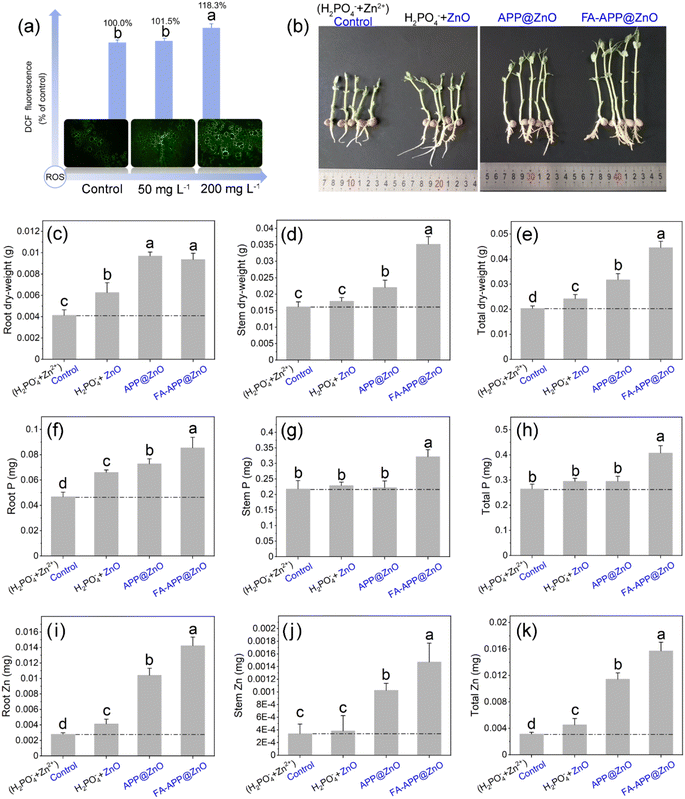
The safe dose range of the nano-fertilizers for the pea seedlings should be determined before their widespread application. Then, ROS accumulation (oxidative stress) was evaluated by detecting the reactive oxygen evoked DCF fluorescence (Fig. 9a). An overdose of the FA–APP@ZnO (200 mg L−1) can cause a significant oxidative stress reaction in plant cells. Therefore, 50 mg L−1 was considered to be a more desirable concentration here, where the biomass accumulation reaches a peak in our preliminary experiments.In order to clarify the functions of each component in FA–APP@ZnO, a set of experiments with different treatments were carried out at the concentration of 50 mg L−1 (Fig. 9b–k). The ZnO nanorod part was assessed by comparing the H2PO4− + ZnO group with the control (H2PO4− + Zn2+). It can be seen from Fig. 9b that the bare ZnO nanorods had little effect on the growth. The application of the ZnO nanorods can increase the total Zn accumulation (Fig. 9k), which, however, is mainly ascribed to the ZnO agglomerated on the root surface (Fig. 9i). The larger ZnO aggregates are difficult to be internalized and are transported to the aboveground part along the vessel system (Fig. 9j). The bare ZnO nanorod treatment consequently causes limited growth enhancement, as indicated in Fig. 9c–e.
The comparison between APP@ZnO (ZnO nanorods/APP copolymer) and the H2PO4− + ZnO treatment can bring out the APP's effects. As shown in Fig. 9b–e, the APP@ZnO treatment has gained superior plant growth than the bare ZnO nanorods (superior to the control as well). The APP with unfolded molecular chains can disperse the ZnO nanorods (Fig. 8e), and the resulting ZnO particles with small hydrodynamic size (Fig. 8f) can be better internalized into roots and stems (Fig. 9i–k). As a result, the seedling length (Fig. 9b) and the dry weight (Fig. 9c–e) are significantly improved under the APP@ZnO treatment compared to the H2PO4− + ZnO treatment. At the same time, due to ZnO's promotion of APP hydrolysis, the enhanced P assimilation of seedlings resulted in only 7 days' cultivation, especially for the root P (Fig. 9f–h).
The function of IA in the FA–APP@ZnO is revealed by comparing the FA–APP@ZnO treatment with the APP@ZnO treatment, as shown in Fig. 9. The seedling length (Fig. 9b), biomass accumulation (Fig. 9d and e), and P/Zn uptake (Fig. 9f–k) were significantly improved by adding FA to the nano-fertilizer system. FA in the FA–APP@ZnO also acts as a surfactant to limit the size of the ZnO nanorods together with APP (Fig. 8e and f). It is more important than the FA-derived FA–O−NH4+ that can buffer pH up to neutral, while the reaction of the pyrophosphate (O–P–O–P–O) hydrolyzation into orthophosphate (O–P–O) can be further accelerated by ZnO's catalyzation with the increased pH, so the supply and assimilation of orthophosphate can be significantly enhanced (Fig. 9f–h). Therefore, the nutrient form of FA–APP@ZnO can deliver more P and Zn nutrients into plants, and the P/Zn assimilation in root and stem is the highest among all the experimental groups (Fig. 9f–k).
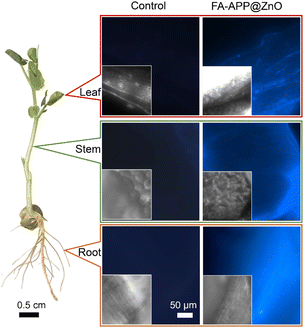
The fluorescence of the ZnO nanorods can be used to label FA–APP@ZnO translocated in the plant rhizosphere and in vivo. Fig. S7† shows the PL curves of the ZnO nanorods, in which the maximum fluorescence intensity arises at the excitation wavelength of 325 nm. The main fluorescence emitted by ZnO nanorods shows a wide wavelength range (450–700 nm) and can be captured by a fluorescence microscope via the DAPI channel. Based on this, fluorescence microscopy was conducted and images of the root, stem, and leaf tissues of pea seedlings were gathered with incident light at around 325 nm (Fig. 10). The ZnO fluorescence was conspicuous in roots, stems, and leaves for the FA–APP@ZnO treatment while none in the control, indicating that the FA–APP@ZnO was absorbed by plants in a nano-state indeed. Herein, the nano-state Zn nutrients are more durably assimilated by the plant and transported to its aboveground parts in contrast to the corresponding ionic-state derived zinc phosphate sediments.
The industrialization prospect of the FA–APP@ZnO fabrication process was preliminarily evaluated by comparing the product capacity (cost) and the growth promotion (benefit) with other reported P/Zn nano-fertilizers. As depicted in Fig. 11, the FA–APP@ZnO nano-fertilizer in this work outperforms the analogues, especially in its laboratory efficiency, which can improve plant growth by 120%. The output of the FA–APP@ZnO per cubic meter and per hour reaches 5.00 kg (P + Zn), which is second only to the nano-hydroxyapatite (23.71 kg (P + Zn) m−3 h−1),43 ensuring a low equipment investment to reach the expected productivity. Without expensive raw materials, organic solvents, or further purifications, this FA–APP@ZnO fabrication process exhibited a considerable atom efficiency for scaling up.
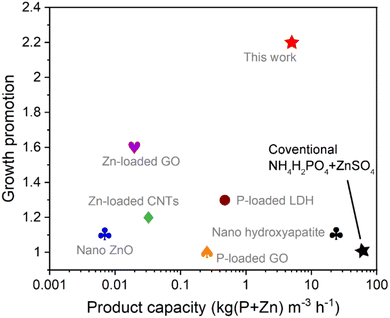 | ||
| Fig. 11 Comparison of the production capacity and the growth promotion of the FA–APP@ZnO with those of other reported P/Zn nano-fertilizers: nano ZnO for mung bean foliar-spray,19 Zn-loaded graphene oxide (GO) for wheat root-application,2 Zn-loaded carbon nanotubes (CNTs) for onion root-application,44 P-loaded GO for wheat root-application,45 P-loaded layered double hydroxides (LDH) for maize root-application,46 nano hydroxyapatite for rice root-application.43 The growth promotion represents the ratio of biomass accumulation obtained from a nano-fertilizer compared to the corresponding conventional control nutrients. | ||
Conclusions
In summary, a highly effective P/Zn co-application came into reality by hierarchically arranging FA, APP, and ZnO nanorods. Our results show that each component of the FA–APP@ZnO composite can benefit from this synergistic system, but not merely as corresponding nutrients (C, P, and Zn) for pea plants. In particular, FA buffers the acidity environment, thus being suitable for root growth. APP acts as a surfactant to better disperse ZnO through the electrostatic repulsion and steric hindrance from polyphosphate chains. While the ZnO nanorods, in return, catalyze, especially the pyrophosphate's hydrolysis, meeting the urgent demand of peas for orthophosphates in the seedling stage. A high mineral nutrient-uptake efficiency brought improved growth, and the current FA–APP@ZnO strategy might be a candidate for reversing the unfavorable P/Zn antagonism in plants. Future studies should focus on whether the slowly but continuously released orthophosphate (FA–APP@ZnO) can induce strong roots to better intercept the dissolved Zn2+ in real edaphic planting. Meanwhile, whether FA in FA–APP@ZnO can promote mycorrhizal for the Zn2+ assimilation has also become an urgent issue.Conflicts of interest
There are no conflicts of interest to declare.Acknowledgements
We are grateful for the financial support from the National Natural Science Foundation of China (Project No. 32172677) and the Engineering Characteristic Team Project of Sichuan University (Project No. 0030904151004/013). We also thank the help of R. Deng at Sichuan University in plant cultivation and H. Ren at Sichuan University in theoretical calculations.References
- T. M. McBeath and M. J. McLaughlin, Efficacy of Zinc Oxides as Fertilisers, Plant Soil, 2014, 374, 843–855, DOI:10.1007/s11104-013-1919-2.
- S. Kabiri, F. Degryse, D. N. H. Tran, R. C. da Silva, M. J. McLaughlin and D. Losic, Graphene Oxide: A New Carrier for Slow Release of Plant Micronutrients, ACS Appl. Mater. Interfaces, 2017, 9, 43325–43335, DOI:10.1021/acsami.7b07890.
- K. Mikula, G. Izydorczyk, D. Skrzypczak, M. Mironiuk, K. Moustakas, A. Witek-Krowiak and K. Chojnacka, Controlled Release Micronutrient Fertilizers for Precision Agriculture - A Review, Sci. Total Environ., 2020, 712, 136365, DOI:10.1016/j.scitotenv.2019.136365.
- Y. Wang, Effects of Phosphorus and Zinc Antagonism on the Nutrition of Maize Zinc, MS Thesis, College of Resources and Environment, Southwest University, 2018; pp. 1–61–.
- Y. Q. Zhang, Y. Deng, R. Y. Chen, Z. L. Cui, X. P. Chen, R. Yost, F. S. Zhang and C. Q. Zou, The Reduction in Zinc Concentration of Wheat Grain upon Increased Phosphorus-Fertilization and its Mitigation by Foliar Zinc Application, Plant Soil, 2012, 361, 143–152, DOI:10.1007/s11104-012-1238-z.
- J. F. Loneragan, T. S. Grove, A. D. Robson and K. Snowball, Phosphorus Toxicity as a Factor in Zinc-Phosphorus Interactions in Plants, Soil Sci. Soc. Am. J., 1979, 43, 966–972, DOI:10.2136/sssaj1979.03615995004300050031x.
- M. Geisler, B. Wang and J. Zhu, Auxin Transport during Root Gravitropism: Transporters and Techniques, Plant Biology, 2014, 16, 50–57, DOI:10.1111/plb.12030.
- Y. F. Xue, S. C. Yue, W. Zhang, D. Y. Liu, Z. L. Cui, X. P. Chen, Y. L. Ye and C. Q. Zou, Zinc, Iron, Manganese and Copper Uptake Requirement in Response to Nitrogen Supply and the Increased Grain Yield of Summer Maize, PLoS One, 2014, 9, e93895, DOI:10.1371/journal.pone.0093895.
- S. J. Watts-Williams, F. A. Smith, M. J. McLaughlin, A. F. Patti and T. R. Cavagnaro, How Important is the Mycorrhizal Pathway for Plant Zn Uptake?, Plant Soil, 2015, 390, 157–166, DOI:10.1007/s11104-014-2374-4.
- G. Feng, F. S. Zhang, X. L. Li, J. L. Zhang and J. P. Gai, Functions of Arbuscular Mycorrhizal Fungi in Agriculture and Their Manipulation, Acta Pedol. Sin., 2010, 47, 995–1004, DOI:10.11766/trxb200907220329.
- R. S. Dwivedi, N. S. Randhawa and R. L. Bansal, Phosphorus-Zinc Interaction, Plant Soil, 1975, 43, 639–648 CrossRef CAS.
- Z. Izsáki, Effects of Phosphorus Supplies on the Nutritional Status of Maize (Zea mays L.), Commun. Soil Sci. Plant Anal., 2014, 45, 516–529 CrossRef.
- Y. G. Zhu, F. A. Smith and S. E. Smith, Phosphorus Efficiencies and Their Effects on Zn, Cu, and Mn Nutrition of Different Barley (Hordeum Vulgare) Cultivars Grown in Sand Culture, Aust. J. Agric. Res., 2002, 53, 211–216 CrossRef CAS.
- M. P. Bernardo, G. G. F. Guimaraes, V. F. Majaron and C. Ribeiro, Controlled Release of Phosphate from Layered Double Hydroxide Structures: Dynamics in Soil and Application as Smart Fertilizer, ACS Sustainable Chem. Eng., 2018, 6, 5152–5161, DOI:10.1021/acssuschemeng.7b04806.
- S. Kabiri, I. B. Andelkovic, R. C. da Silva, F. Degryse, R. Baird, E. Tavakkoli, D. Losic and M. J. McLaughlin, Engineered Phosphate Fertilizers with Dual-Release Properties, Ind. Eng. Chem. Res., 2020, 59, 5512–5524, DOI:10.1021/acs.iecr.0c00403.
- X. Cao, C. Wang, X. Luo, L. Yue, J. C. White, W. Elmer, O. P. Dhankher, Z. Wang and B. Xing, Elemental Sulfur Nanoparticles Enhance Disease Resistance in Tomatoes, ACS Nano, 2021, 15, 11817–11827, DOI:10.1021/acsnano.1c02917.
- M. Kah, R. S. Kookana, A. Gogos and T. D. Bucheli, A Critical Evaluation of Nanopesticides and Nanofertilizers against Their Conventional Analogues, Nat. Nanotechnol., 2018, 13, 677–684, DOI:10.1038/s41565-018-0131-1.
- C. Y. Wang, J. Yang, J. C. Qin and Y. W. Yang, Eco-Friendly Nanoplatforms for Crop Quality Control, Protection, and Nutrition, Adv. Sci., 2021, 2004525, DOI:10.1002/advs.202004525.
- R. Raliya, J. C. Tarafdar and P. Biswas, Enhancing the Mobilization of Native Phosphorus in the Mung Bean Rhizosphere Using ZnO Nanoparticles Synthesized by Soil Fungi, J. Agric. Food Chem., 2016, 64, 3111–3118, DOI:10.1021/acs.jafc.5b05224.
- S. Xu and Z. L. Wang, One-Dimensional ZnO Nanostructures: Solution Growth and Functional Properties, Nano Res., 2011, 4, 1013–1098, DOI:10.1007/s12274-011-0160-7.
- J. X. Yang, X. J. Kong, D. H. Xu, W. J. Xie and X. L. Wang, Evolution of the Polydispersity of Ammonium Polyphosphate in a Reactive Extrusion Process: Polycondensation Mechanism and Kinetics, Chem. Eng. J., 2019, 359, 1453–1462, DOI:10.1016/j.cej.2018.11.031.
- T. Lu and F. W. Chen, Multiwfn: A Multifunctional Wavefunction Analyzer, J. Comput. Chem., 2012, 33, 580–592, DOI:10.1002/jcc.22885.
- J. X. Yang, Z. J. Yan, D. H. Xu and X. L. Wang, Enhanced Growth of Broad Beans (Vicia faba L.) through Separating Antagonistic Nutrients Using Nitrogen-Doped Carbon Nanotubes, ACS Sustainable Chem. Eng., 2021, 9, 16437–16449, DOI:10.1021/acssuschemeng.1c06465.
- B. Cao, X. Teng, S. H. Heo, Y. Li, S. O. Cho, G. Li and W. Cai, Different ZnO Nanostructures Fabricated by a Seed-Layer Assisted Electrochemical Route and Their Photoluminescence and Field Emission Properties, J. Phys. Chem. C, 2007, 111, 2470–2476, DOI:10.1021/jp066661l.
- A. Galdámez-Martinez, G. Santana, F. Güell, P. R. Martínez-Alanis and A. Dutt, Photoluminescence of ZnO Nanowires: A Review, Nanomaterials, 2020, 10, 857, DOI:10.3390/nano10050857.
- H. P. Cong, X. C. Ren, P. Wang and S. H. Yu, Macroscopic Multifunctional Graphene-Based Hydrogels and Aerogels by a Metal Ion Induced Self-Assembly Process, ACS Nano, 2012, 6, 2693–2703, DOI:10.1021/nn300082k.
- S. Yamabi and H. Imai, Growth Conditions for Wurtzite Zinc Oxide Films in Aqueous Solutions, J. Mater. Chem., 2002, 12, 3773–3778, 10.1039/b205384e.
- P. Wang, E. Lombi, F. J. Zhao and P. M. Kopittke, Nanotechnology: A New Opportunity in Plant Sciences, Trends Plant Sci., 2016, 21, 699–712, DOI:10.1016/j.tplants.2016.04.005.
- J. X. Yang, W. J. Xie, X. J. Kong, D. H. Xu and X. L. Wang, Reactive Extrusion of Ammonium Polyphosphate in a Twin-Screw Extruder: Polydispersity Improvement, Chem. Eng. Process., 2018, 133, 58–65, DOI:10.1016/j.cep.2018.09.019.
- C. Z. Chen and Z. W. Zhou, The Preparation of Nano-ZnO and its Middle Infrared-Ultraviolet-Visible Light Absorption Properties, J. Funct. Biomater., 2004, 34, 97–98 Search PubMed.
- Ammonium dihydrogen phosphate, https://sdbs.db.aist.go.jp/.
- Urea, https://sdbs.db.aist.go.jp/.
- S. P. Wei, M. Wu and Z. P. Li, Comparative Study on Infrared Spectroscopy of Humic Acid from Different Sources, Humic Acid, 2018, 20–25, DOI:10.19451/j.cnki.issn1671-9212.2018.01.003.
- C. Y. Shen, N. E. Stahlheber and D. R. Dyroff, Preparation and Characterization of Crystalline Long-Chain Ammonium Polyphosphates, J. Am. Chem. Soc., 1969, 91, 62–67, DOI:10.1021/ja01029a013.
- S. Ghosh and S. Ramaprabhu, Green Synthesis of Transition Metal Nanocrystals Encapsulated into Nitrogen-Doped Carbon Nanotubes for Efficient Carbon Dioxide Capture, Carbon, 2019, 141, 692–703, DOI:10.1016/j.carbon.2018.09.083.
- Y. N. Shang, C. Chen, P. Zhang, Q. Y. Yue, Y. W. Li, B. Y. Gao and X. Xu, Removal of Sulfamethoxazole from Water via Activation of Persulfate by Fe3C@NCNTs including Mechanism of Radical and Nonradical Process, Chem. Eng. J., 2019, 375, 122004, DOI:10.1016/j.cej.2019.122004.
- Y. Q. Lai, Y. F. Jiao, J. X. Song, K. Zhang, J. Li and Z. A. Zhang, Fe/Fe3C@Graphitic Carbon Shell Embedded in Carbon Nanotubes Derived from Prussian Blue as Cathodes for Li–O2 Batteries, Mater. Chem. Front., 2018, 2, 376–384, 10.1039/c7qm00503b.
- T. Ishiyama, T. Yamaguchi, J. Nishii, T. Yamashita, H. Kawazoe, N. Kuwata, J. Kawamura and T. Omata, Structural Change of NaO1/2-WO3-NbO5/2-LaO3/2–PO5/2 Glass Induced by Electrochemical Substitution of Sodium Ions with Protons, Phys. Chem. Chem. Phys., 2015, 17, 13640–13646, 10.1039/c4cp05999a.
- M. S. Akhtar, S. Kwon, F. J. Stadler and O. B. Yang, High Efficiency Solid State Dye Sensitized Solar Cells with Graphene-Polyethylene Oxide Composite Electrolytes, Nanoscale, 2013, 5, 5403–5411, 10.1039/c3nr00390f.
- T. H. Lee and J. W. Rabalais, X-ray Photoelectron Spectra and Electronic Structure of Some Diamine Componds, J. Electron Spectrosc. Relat. Phenom., 1977, 11, 123–127, DOI:10.1016/0368-2048(77)85052-4.
- J. W. Williard, T. D. Farr and J. D. Hatfield, Hydrolysis of Ammonium Pyro-, Tripoly-, and Tetrapolyphosphate at 25 °C and 50 °C, J. Chem. Eng. Data, 1975, 20, 276–283, DOI:10.1021/je60066a012.
- T. Lu and F. W. Chen, Bond Order Analysis Based on the Laplacian of Electron Density in Fuzzy Overlap Space, J. Phys. Chem. A, 2013, 117, 3100–3108, DOI:10.1021/jp4010345.
- N. Kottegoda, C. Sandaruwan, G. Priyadarshana, A. Siriwardhana, U. A. Rathnayake, D. M. B. Arachchige, A. R. Kumarasinghe, D. Dahanayake, V. Karunaratne and G. A. J. Amaratunga, Urea-Hydroxyapatite Nanohybrids for Slow Release of Nitrogen, ACS Nano, 2017, 11, 1214–1221, DOI:10.1021/acsnano.6b07781.
- V. Kumar, D. Sachdev, R. Pasricha, P. H. Maheshwari and N. K. Taneja, Zinc-Supported Multiwalled Carbon Nanotube Nanocomposite: A Synergism to Micronutrient Release and a Smart Distributor to Promote the Growth of Onion Seeds in Arid Conditions, ACS Appl. Mater. Interfaces, 2018, 10, 36733–36745, DOI:10.1021/acsami.8b13464.
- V. Kumar, D. Sachdev, R. Pasricha, P. H. Maheshwari and N. K. Taneja, Zinc-Supported Multiwalled Carbon Nanotube Nanocomposite: A Synergism to Micronutrient Release and a Smart Distributor to Promote the Growth of Onion Seeds in Arid Conditions, ACS Appl. Mater. Interfaces, 2018, 10, 36733–36745, DOI:10.1021/acsami.8b13464.
- L. Benício, R. L. Constantino, F. G. Pinto, L. Vergütz, J. Tronto and L. Costa, Layered Double Hydroxides: New Technology in Phosphate Fertilizers Based on Nanostructured Materials, ACS Sustainable Chem. Eng., 2017, 5, 399–409, DOI:10.1021/acssuschemeng.6b01784.
Footnote |
| † Electronic supplementary information (ESI) available: Fig. S1: the calibration curves of ICP-OES; Fig. S2: schematic of the different growth modes of the ZnO crystals; Fig. S3: Raman spectra of FA–APP@ZnO; Fig. S4: overall reaction processes for the formation of FA–APP@ZnO; Text S1 (Table S1, Table S2, Fig. S4, and Fig. S5): hydrolysis kinetics analyses of APP; Fig. S6: DFT-calculated APP hydrolysis; Fig. S7: PL emission spectra of ZnO nanorods. See DOI: https://doi.org/10.1039/d2ra05480a |
| This journal is © The Royal Society of Chemistry 2022 |

