 Open Access Article
Synthesis and optical properties of Gd4Al2O9:Eu3+, a red emitting phosphor with a strong negative thermal quenching effect
Junyu Minga,
Chaolian Luoa,
Shaokun Linga,
Chang Chena,
Yaxiong Wang a,
Sen Liao
 *ab,
Yingheng Huang*ab and
Jie Liang*b
aSchool of Resources, Environment and Materials, Guangxi University, Nanning, Guangxi 530004, China. E-mail: liaosen@gxu.edu.cn; huangyingheng@163.com
bSchool of Chemistry and Chemical Engineering, Guangxi University, Nanning, Guangxi 530004, China. E-mail: liangj@gxu.edu.cn; Fax: +86 771 3233718; Tel: +86 771 3233718
First published on 3rd November 2022
Abstract
For the purpose of obtaining red-light phosphors with excellent luminescence thermal stability, a series of Gd4Al2O9:Eu3+ (GAO:Eu3+) phosphors were synthesized by combining the sol-gel method with high-temperature calcination, and a detailed series of study and analysis of their room temperature and high temperature luminescence properties was carried out. In GAO, the emission peaks corresponding to the 5D0 → 7Fj (j = 0, 1, 2, 3 and 4) transitions of Eu3+ were observed at 578, 590, 610, 654, and 707 nm, with the strongest emission peak at 610 nm, and the obtained samples were red-light phosphors. The sample GAO:Eu3+ synthesized by combining the sol-gel method with high-temperature calcination has a negative thermal quenching (NTQ) effect, and the best doped sample GAO:0.16Eu3+ has an optimal luminescence temperature of 120 °C, and the corresponding integrated PL intensity is 183.2% of the initial value at 30 °C. The presence of the NTQ effect makes GAO:0.16Eu3+ have good luminescence thermal stability, which manifests as thermal-optical energy conversion at the macroscopic level. A detailed study of the thermal quenching mechanism was carried out.
1. Introduction
White light emitting diodes (WLEDs) are considered to be the most promising green solid-state lighting devices for the twenty-first century, with applications in lighting, exhibitions, electronic devices and other fields. Compared to previous incandescent and fluorescent lamps, WLEDs have excellent properties such as high luminous efficiency, energy efficiency, long lifetime and environmental friendliness.1 Some phosphor-converted white light emitting LEDs (Pc-WLEDs) currently on the market are a combination of three phosphors that can produce red, green and blue light (RGB) respectively, but the WLEDs prepared by this method are sensitive to the device operating temperature, and the color rendering index (CRI) and correlated color temperature (CCT) are prone to change. The performance of red emitting phosphors is relatively poor compared to the luminescent performance of green and blue emitting phosphors available in the market. Conventional sulphide red emitting phosphors such as (Ca,Sr)S:Eu2+ and Y2O2S:Eu3+ are unstable at high temperatures and under humid conditions. The synthesis of Eu2+ doped (oxygenated) nitrides require harsh preparation conditions and often suffers from blue–green light reabsorption, resulting in imbalance in color and reduced luminous efficiency.2,3 A good quality red emitting phosphor for lamps should be able to be excited by near-UV light (370–410 nm) without reabsorption of visible light and have good chemical stability. In addition, the operating temperature of Pc-WLEDs is over 150 °C, so the ability to maintain excellent fluorescence emission at operating temperature is an important indicator to evaluate the phosphor performance. For most phosphors, the emission intensity decreases with increasing temperature, i.e., a thermal quenching phenomenon, which severely degrades the white light quality of WLEDs.4 Therefore, the synthesis of red emitting phosphors with high luminescence thermal stability is very important to obtain high quality warm white light.Eu3+ is recognized as an excellent choice for emitting phosphor luminescence centers,5,6 and in various matrixes under near-UV excitation can emit high-quality red light produced by the 5D0 → 7Fj (j = 0, 1, 2, 3 and 4) transition, such as Mg2LaTaO6,7 Na2Ca2Nb4O13,8 KGdF4,9 NaLaTi2O6,10 etc. For Eu3+, the choice of substrate is very important. In recent years, a lot of research has been carried out on Ln2O3–Al2O3 (Ln = rare earth ion) compounds, which are widely used in solid-state laser materials, scintillators for medical imaging, WLEDs lighting, displays, etc., because of their high chemical and thermal stability, high creep resistance, and ability to incorporate different lanthanide ions for better luminescence.11–14 GAO, a member of the Ln2O3–Al2O3 family of compounds, also has these characteristics and is an excellent choice as a matrix for Eu3+-doped phosphors. For example, Li et al.15 reported the synthesis of GAO:Eu3+ phosphors by applying a co-precipitation method, Singh et al.14 applied a urea-assisted combustion method to synthesize GAO:Eu3+ phosphors, and Deng et al.16 synthesized GAO:Er3+/Yb3+ upconversion phosphors by co-precipitation method. However, in our limited literature research, we have not found any report on the synthesis of near-UV-excited GAO:Eu3+ red phosphors by combining a sol-gel method with two-stage high-temperature calcination.
The operating temperature of high-power WLEDs is around 200 °C, therefore, if the phosphor in the WLEDs operating temperature range exists thermal quenching will seriously affect the light quality of WLEDs, while the current commercial phosphors in this problem has not been well solved, for example, commercial phosphors YAG:Ce3+, (Sr,Ca)AlSiN3:Eu2+ and SrSi2O2N2:Eu2+ at 200 °C corresponding to the percentage loss of emitted light intensity of 12%, 18% and 20%, respectively. In order to overcome thermal quenching, researchers have tried to develop a variety of zero-thermal-quenching phosphors, of which more typically such as: Kang et al.17 reported that LuVO4:Bi3+ phosphor with an optimal luminescence temperature at 100 °C, Zhong et al.18 reported that La3Si6N11:Ce3+ zero-thermal-quenching phosphor with an optimal luminescence temperature at 75 °C, Chen et al.19 reported that Ba3Y(PO4)3:Ce3+/Tb3+/Mn2+phosphor at an optimal luminescence temperature of 152 °C, Qiao et al.20 reported that K2BaCa(PO4)2:Eu2+ phosphor at 200 °C still has 96% of the integrated luminescence intensity at an initial temperature of 25 °C, Fang et al.21 reported that LaAlO3:Ca2+, Bi3+, Mn4+ red light phosphor at 150 °C shows an integrated luminescence intensity 103% of the initial integrated intensity at 25 °C, etc. However, only a few reported Eu3+-activated red phosphors showed zero-thermal-quenching, such as Zhao et al.22 reported that K5Y(P2O7):Eu3+ at the optimal luminescence temperature of 100 °C with a luminescence integral intensity about 100.7% of that at the initial temperature of 25 °C, Wang et al.23 reported that LaSc3(BO3)4:Eu3+ red phosphor at the optimum luminescence temperature of 225 °C is about 132.5% of the integrated luminescence intensity at the initial temperature of 25 °C. Therefore, more research is needed to obtain Eu3+-activated red phosphors with excellent high-temperature fluorescence stability. After a series of explorations, we obtained a GAO:Eu3+ red phosphor with excellent high-temperature fluorescence stability, the integrated luminescence intensity in the operating temperature range of 150–210 °C in high-power WLEDs always higher than 148.7% of the integrated luminescence intensity at the initial temperature of 30 °C, which was further improved than the previous ones in terms of fluorescence thermal stability.
In this paper, we prepared a series of GAO:Eu3+ phosphors by combining the sol-gel method with high-temperature calcination. The experimental results show that the synthesized GAO:Eu3+ phosphors have a strong NTQ effect and are near-UV excited red phosphors with excellent high-temperature fluorescence properties.
2. Experimental section
2.1. Reagent and apparatus
All chemicals were reagent-grade pure and purchased from the Sinopharm Chemical Reagent Co. Ltd, China.Powder X-ray diffraction (XRD) was performed at a scanning rate of 5° min−1 from 5 to 70° for 2θ at room temperature by using a Rigaku D/max 2500 V diffractometer. It was equipped with a graphite monochromator by utilizing monochromatic CuKα radiation (λ = 0.154178 nm). Excitation and emission (PLE&PL) spectra were recorded at room temperature by a Horiba Fluoro Max-4-R F6000 equipped with a xenon lamp as the excitation source, the morphology was observed by SEM, and the elements were analyzed by EDS (EDS, Oxford INCA300, England).
2.2. Preparation of the samples
A series of GAO:Eu3+ phosphors were prepared by combining the sol-gel method with high-temperature calcination. Take the synthesis of 0.005 mol GAO:0.16Eu3+ as an example: (i) all kind of metal nitrates required for synthesis of 0.005 mol GAO:0.16Eu3+ ware weighted according to stoichiometric ratio, dissolved in 30 ml deionized water, and moved into a magnetic stirrer, and stirred evenly during water both heating; (ii) weight 0.06 mol citric acid and dissolve it in 20 ml deionized water; (iii) the citric acid solution obtained in step (ii) was added to the nitrate mixture in step (i) using a rubber-tipped burette in a uniform drop, after completion of the dropwise addition, a clear and viscous gel is obtained by adjusting the water bath temperature of the magnetic stirrer to 80 °C and stirring continuously for 4 h; (iv) the gel was dried in an oven at 120 °C for 15 h; (v) the fluffy dry gel from (iv) was removed and ground in a mortar to obtain a pale yellow powder; (vi) the yellowish powder was pre-fired at 900 °C for 4 h. After annealing, the powder was removed and ground, and then calcined in a muffle furnace at 1400 °C for 5 h. After annealing, the powder was removed and ground to obtain a white powder, i.e., the target product.3. Results and discussion
3.1 Structure, morphology and composition
As shown in Fig. 1(a), the XRD spectra of GAO:xEu3+ (x = 0.14–0.19) are compared with the standard card of GAO (PDF#46 – 0396). It can be seen from the Fig. 1(a) that the diffraction peaks of the sample basically correspond to the standard card, which proves that the pure phase GAO crystals without other heterogeneous phases generated. The indexed results of GAO:0.16Eu3+ are shown in Table 1. Because of lanthanide shrinkage, the radius of Gd3+ is smaller than that of Eu3+. Since some of Gd3+ ions have been replaced by Eu3+ ions in GAO:0.16Eu3+, Table 1 shows that the unit cell volume of sample GAO:0.16Eu3+ is slightly larger than that of PDF#46 – 0396.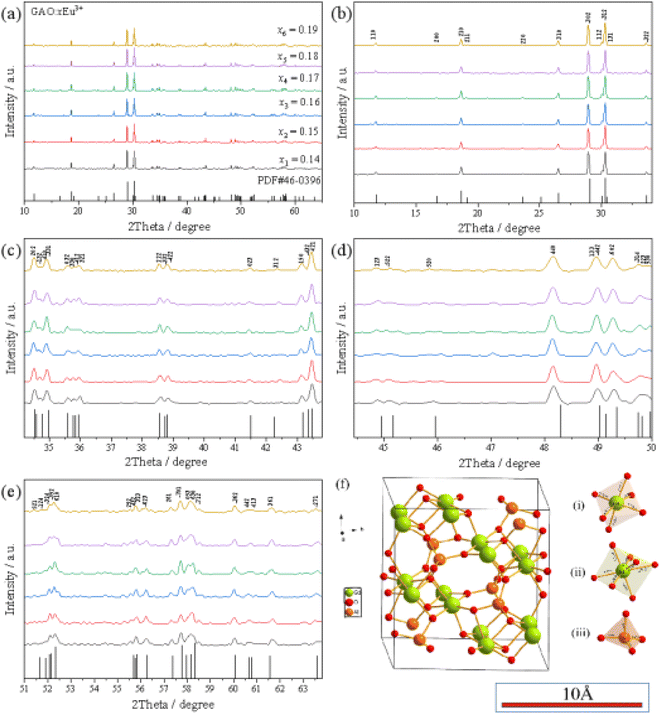 | ||
| Fig. 1 The structure of samples: (a–e) XRD pattern of GAO:xEu3+, (f) schematic diagram of three dimensional cell structure. | ||
| Sample | a/Å | b/Å | c/Å | V/Å3 |
|---|---|---|---|---|
| GAO:0.16Eu3+ | 11.255 | 10.669 | 7.580 | 859.31 |
| PDF#46 – 0396 | 11.246 | 10.676 | 7.564 | 857.60 |
According to Vegard's law,8 the radius of metal ions does not exceed 15% and they can easily replace each other. The difference in ionic radius between Gd3+ and Eu3+ is within 15%, and the difference in radius with Al3+ is large, so Eu3+ is more inclined than Al3+ to replace the Gd3+ lattice in GAO. Fig. 1(b) is the 3D cell structure schematic diagram of GAO, which shows the coordination between Gd3+ and O2−, and Al3+ and O3+, respectively. The crystal of GAO belongs to monoclinic structure14 (PDF#46 – 0396). In GAO, Gd3+ is in two different positions: coordination with seven oxygen atoms to form GdO7 polyhedra and coordination with six oxygen atoms to form GdO6 octahedra, respectively. Al3+ coordination with four O2− to form AlO4 tetrahedral sites.16
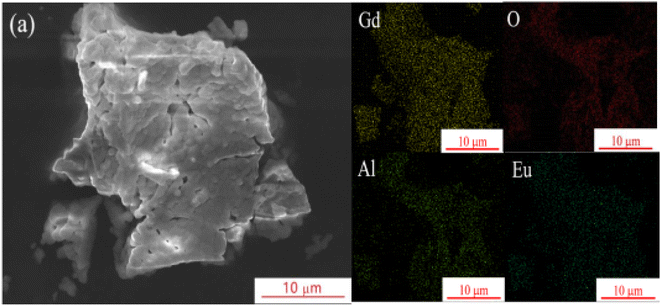
Fig. 2 shows the SEM and EDS test results of the sample GAO:0.16Eu3+. The SEM image shows that the sample is composed of irregular agglomerated particles with size of 1–5 μm. The EDS test results show the corresponding face scan of each element, showing that the sample consists of Gd, Al, O, Eu elements, and each element is uniformly distributed in the phosphor particles. This can prove that Eu3+ has been doped into the GAO.
3.2 Luminescence properties
Fig. 3(a) shows the PLE&PL spectra of the GAO:0.16Eu3+. First, the PLE spectrum of GAO:0.16Eu3+ was obtained by monitoring the emission of 5D0 → 7F2 at 610 nm. The strong broadband excitation peak in the 240–340 nm region is the charge transfer band of O2− → Eu3+, resulting from the transition of electrons from the 2p orbital of O2− to the 4f orbital of Eu3+ and the peak is located at 274 nm. In addition, the charge transfer band of O2− → Eu3+ overlaps with the peaks of Gd3+ at 274 nm (8S7/2 → 6IJ), 308 nm (8S7/2 → 6P7/2) and 314 nm (8S7/2 → 6P5/2), so that Eu3+ can receive energy from Gd3+ when the sample is excited at 274 nm, thus enhancing the emission. The presence of the 8S7/2 → 6IJ transition peak is direct evidence of the energy transfer of Gd3+ → Eu3+.24 Fig. 3(b) shows the energy level transition of the energy transfer process of Gd3+ → Eu3+. When the GAO:0.16Eu3+ excited at 274 nm, the ground state electrons at the 8S7/2 of Gd3+ are excited to the 6IJ, with some electrons returning to the ground state by non-radiative transitions and others transferring to the 5L6 energy level of Eu3+. Because the 6IJ energy level is higher than the 5L6 energy level of Eu3+, the energy transfer of Gd3+ → Eu3+ is irreversible. This phenomenon was also observed in the GAO:Eu3+ phosphor synthesized by co-precipitation and urea-assisted combustion methods.14,15 Different from these two reports, our sample showed strong characteristic absorption peaks of Eu3+ in the range of 350–500 nm, the peaks at 7F0 → 5H6 (321 nm), 7F0 → 5H3 (327 nm), 7F0 → 5D4 (361 nm), 7F0 → 5G3 (384 nm), 7F0 → 5L6 (392 nm), 7F0 → 5D3 (414 nm), 7F0 → 5D2 (466 nm), are ascribed to 4f–4f transitions of Eu3+ ions. In the PLE part, the strongest absorption peak of the sample was located at 274 nm and the secondary absorption peak was located at 392 nm, moreover, the peak of the secondary absorption peak was 93.98% of the value of the strongest absorption peak, which indicated that our prepared GAO:0.16Eu3+ phosphor was able to work at two different excitation wavelengths of 274 nm and 392 nm, respectively.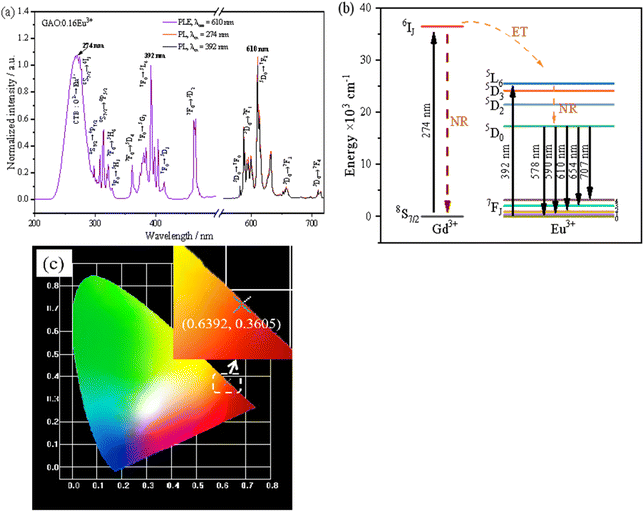 | ||
| Fig. 3 The fluorescence characteristic of GAO:0.16Eu3+: (a) PLE&PL spectra, (b) mechanism of energy transfer process of Gd3+ → Eu3+, (c) chromaticity diagram. | ||
The PL portion of Fig. 3(a) is described as follows: emission spectra obtained from GAO:0.16Eu3+ phosphors excited by 274 nm (red line) and 392 nm (blue line). The PL spectra excited by 392 nm and 274 nm differ only in intensity, the integrated luminescence intensity obtained for GAO:0.16Eu3+ under 392 nm excitation (integration range: 570–720 nm) is 92.65% of that obtained under 274 nm excitation. The weak emission peaks at 578, 590, 654 and 707 nm were due to the transitions of Eu3+ ion from 5D0 to 7F0, 7F1, 7F3 and 7F4 levels, respectively. The strongest emission peak around 610 nm were assigned to the Eu3+ electric dipole transition of 5D0 → 7F2, so that Eu3+ is in a non-inversion symmetry site in the GAO. Our aim is to explore high-temperature red phosphors with near-UV excitation, so follow-up analysis was performed with data obtained from samples excited under 392 nm.
Fig. 3(c) obtained from PL spectrum excited by 392 nm excitation in Fig. 3(a), which shows that the luminescence of the sample is in the red region, and the emission spectrum data were converted to color coordinates (0.6392, 0.3605) by the calculation software “1931CIE”. To find out the color purity of the sample GAO:0.16Eu3+, the color purity (CP) can be calculated by the following equation:25
 | (1) |
3.3 Luminescent properties at different concentrations of Eu3+
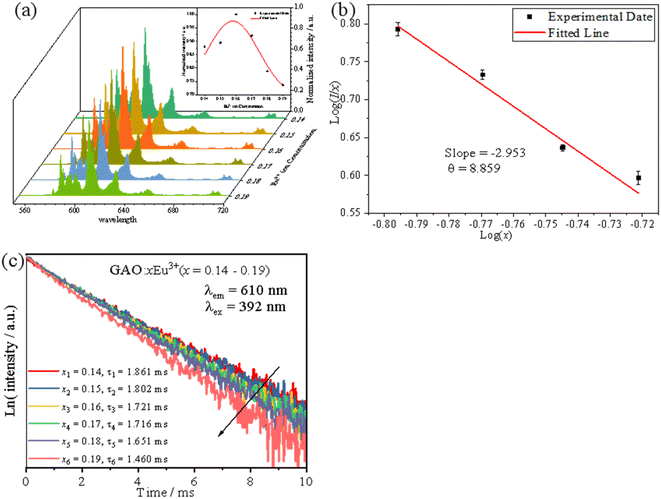
The emission intensity of GAO with different concentrations of Eu3+ was shown in Fig. 4(a). The PL intensity increased with increasing Eu3+ ion concentration, reaching a maximum at 16 mol%, and then decreased with increasing Eu3+ ion concentration due to concentration quenching. With respect to the mechanism of energy transfer in phosphors, Blasse has pointed out that the critical transfer distance (Rc) at which the probability of transfer was equal to the probability of radiative emission, can be calculated using the formula:26
 | (2) |
In general, the concentration quenching effect works by activating three types of energy transfer between ions: mutual exchange interaction, radiation resorption and electrical multipole interaction. Reciprocal exchange can only be accomplished at Rc less than 0.5 nm. As for the radiation reabsorption mechanism, the excitation and emission spectra of the GAO:0.16Eu3+ phosphor do not have a clear overlap region. Therefore, in GAO:0.16Eu3+, electric multipole interactions should dominate the concentration burst effect of Eu3+. The type of electrical multilevel interaction can be judged by the following equation:27,28
 | (3) |
Fig. 4(c) shows the fluorescence decline curves for GAO:xEu3+. The fit was performed with a single exponential equation as follows:29
 | (4) |
3.4 Luminescent thermal stabilities
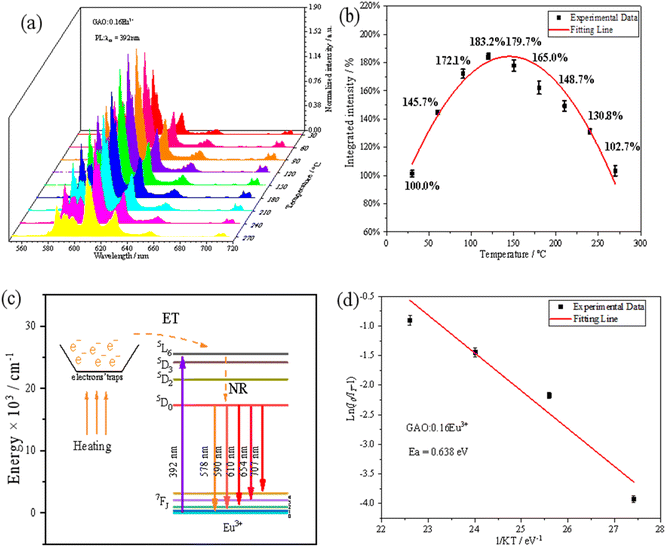
The high-temperature fluorescence performance of the sample GAO:0.16Eu3+ was shown in Fig. 5(a) and (b). When the test temperature was increased from 30 °C to 120 °C, the emission of Eu3+ is enhanced with the increase of temperature, and the shape and position of the emission spectrum did not change. When the temperature reaches 120 °C, integrated intensity of the emission has a maximum value, and it is 183% of the initial one at 30 °C. When the temperature is over 120 °C, the luminous intensity decreases with the increase of temperature due to the thermal quenching effect, and at 270 °C, the integrated intensity is as high as 101.5% of the initial one at 30 °C, proving that GAO:0.16Eu3+ has an excellent luminous thermal stability.The mechanism of NTQ effect has been discussed in a number of other reports.30–32 That is, with the increasing of temperature, the electrons obtain energy compensation from the electron traps formed from the matrix defects and then they transfer the energy to Eu3+ to formation the effect,33–36 which is described with Fig. 5(e). In this paper, electron traps formed from the substitution of Eu3+ for Gd3+ lattice sites that are in two different coordination sites.33–36 The mechanism is shown in Fig. 5(c), where the number of excited electrons in Eu3+ through nonradiative relaxation to the ground state increases with increasing temperature, while electron traps are released from the defects into the 5L6 energy level of Eu3+ upon heating, leading to an increase in the number of electrons in the radiative transition and thus enhanced emission of Eu3+. In the whole high-temperature fluorescence test system, the only variable is the temperature of the phosphor. Due to the NTQ effect, the luminescence intensity of the sample is always stronger in the test temperature range (30–270 °C) than the initial one at 30 °C. First, the intensity is enhanced before 120 °C. The is attributed to radiative transition probability being larger than that of non-radiative transition, which is supported by energy compensation from the electron traps. Then, after 120 °C, the intensity weakened with the increase of temperature, due to high temperature quenching, which radiative transition probability is smaller than that of non-radiative transition. From a macroscopic point of view, the mechanism of the NTQ effect should be considered as thermal-to-optical energy conversion mechanism.
In order to further understand the thermal stability of GAO:0.16Eu3+, the thermal quenching activation energy of the samples was calculated by the Arrhenius equation based on the emission intensity of the samples at different temperatures, as shown in the following equation:37
 | (5) |
3.5 Luminescent performances of prototype red light LEDs
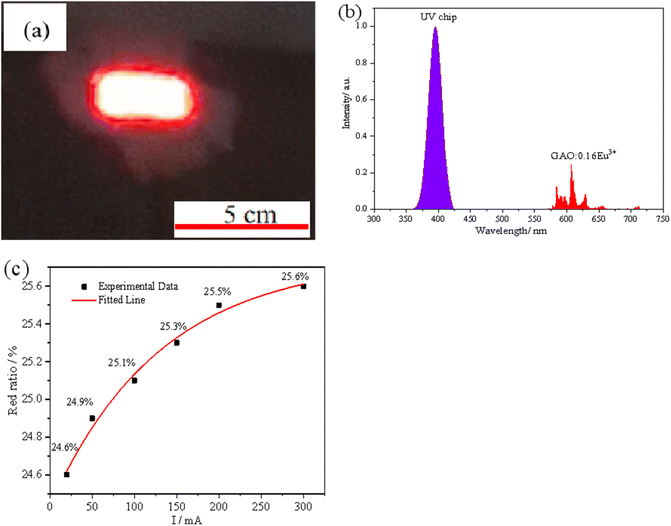
In order to further explore the performance of the sample GAO:0.16Eu3+ in actual working conditions, the sample GAO:0.16Eu3+ was assembled with a 395 nm UV chip to get a prototype red LED using a modified acrylate adhesive and tested under different driving currents, and the test results are shown in Fig. 6. Fig. 6(a) shows the luminescence of the assembled prototype red LED under a 20 mA drive current, and the sample emits bright red light under the excitation of 395 nm.Fig. 6(b) shows the electroluminescence spectrum under 20 mA driving current, the purple emission band is the PL spectrum of the chip, and the red emission band is the PL spectrum of the sample, where red ratio of the LED is about 24.6%. Fig. 6(c) shows the variation of the red ratio of the prototype LED at different drive currents, which are 24.6%, 24.9%, 25.1%, 25.3%, 25.5%, and 25.6% at 20, 50, 100, 150, 200, and 300 mA drive currents, respectively. The temperature of the chip increases with the increase of the drive current, and the red-light ratio increases nonlinearly with the increase of the chip operating temperature in the range of 20 to 300 mA drive current, proving that there is a NTQ phenomenon in the actual use of the sample, which confirms the test results in Fig. 5(b).
4. Conclusions
In summary, we have synthesized a series of GAO:Eu3+ red emitting phosphors with high fluorescence thermal stability by combining the sol-gel method with high-temperature calcination. Their structure, morphology and composition, room temperature luminescence properties, NTQ effect and luminescence performance of the red LED prototypes were investigated in detail. The optimal sample GAO:0.16Eu3+ has strong absorption at both 274 nm and 392 nm and strong red emission at 610 nm with chromaticity coordinates of (0.6392, 0.3605). Surprisingly, GAO:0.16Eu3+ has a very excellent high-temperature fluorescence performance with the strongest integrated PL intensity at 120 °C, the corresponding integrated PL intensity is 183.2% of the initial value at 30 °C, and the luminescence intensity at the maximum test temperature of 270 °C still has 102.7% of the initial value at 30 °C. Therefore, GAO:0.16Eu3+ phosphor has a great potential to be used in the manufacture of the red part of WLEDs.Author contributions
Junyu Ming: methodology, formal analysis, investigation, writing – original draft. Chaolian Luo: investigation. Shaokun Ling: investigation. Chang Chen: investigation. Yaxiong Wang: investigation. Sen Liao: conceptualization, supervision. Yingheng Huang: review & editing, visualization. Jie Liang: review & editing, visualization.Conflicts of interest
The authors declare that they have no conflict of interest.Acknowledgements
This research is supported by the National Natural Science Foundation of China (Grant No. 21661006 and No. 21965004), the Natural Science Foundation of Guangxi Zhuang Autonomous Region, China (Grant No. 2019GXNSFDA245022), the Scientific Research Foundation of Guangxi University (Grant No. XDZ140116), the innovation Project of Guangxi Graduate Education (Grant No. YCSW2020015), the Students Experimental Skills and Innovation Ability Training Fund Project of Guangxi University (No. S202210593143).References
- S. A. Khan, N. Z. Khan, M. Sohail, J. Ahmed, N. Alhokbany, S. M. Alshehri, X. Xu, J. F. Zhu and S. Agathopoulosf, J. Mater. Chem. C, 2021, 9, 1341–1371 Search PubMed.
- Y. C. Lin, M. Karlsson1 and M. Bettinelli, Top. Curr. Chem., 2016, 374, 21 CrossRef.
- E. Erol, N. Vahedigharehchopogh, O. Kıbrıslı, M. Ç. Ersundu and A. E. Ersundu, J. Phys.: Condens. Matter, 2021, 33, 1–23 CrossRef PubMed.
- L. Wu, Y. Bai, L. Wu, H. Yi, Y. Kong, Y. Zhang and J. Xu, RSC Adv., 2017, 7, 1146–1153 RSC.
- X. Li, C. Yang, Q. S. Liu, X. C. Wang and X. Y. Mi, Ceram. Int., 2020, 46, 17376–17382 CrossRef CAS.
- J. Lakde, C. M. Mehare, K. K. Pandey, N. S. Dhoble and S. J. Dhoble, J. Phys.: Conf. Ser., 2018, 18, 8047–8069 Search PubMed.
- H. Guo, X. Y. Huang and Y. J. Zeng, J. Alloys Compd., 2018, 741, 300–306 CrossRef CAS.
- Z. Jia, X. L. Zhang, X. Y. Hua, Y. Dong, H. L. Li, C. Q. Feng, Y. G. Wang and M. J. Xia, J. Alloys Compd., 2020, 844, 155875 CrossRef CAS.
- K. Li and R. V. Deun, Dyes Pigm., 2018, 155, 258–264 CrossRef CAS.
- M. E. Alvarez-Ramosa, R. C. Carrillo-Torresa, R. Sánchez-Zeferinoa, U. Caldiñob and J. Alvarado-Rivera, J. Non-Cryst. Solids, 2019, 521, 119462 CrossRef.
- E. E. Hertle, L. Chepyga, A. Osvet, C. J. Brabec, M. Batentschuk, S. Will and L. Zigan, Meas. Sci. Technol., 2019, 30, 34001 CrossRef CAS.
- W. Chewpraditkul, N. Pattanaboonmee, O. Sakthong, W. Chewpraditkul, T. Szczesniak, M. Moszynski, K. Kamada, A. Yoshikawa and M. Nikl, Opt. Mater., 2018, 76, 162–168 CrossRef CAS.
- A. Morán-Ruiz, K. Vidal, A. Larrañaga and M. I. Arriortua, Ceram. Int., 2018, 44, 8761–8767 CrossRef.
- D. Singh and S. Kadyan, J. Mater. Sci.: Mater. Electron., 2017, 28, 11142–11150 CrossRef CAS.
- J. Li, J. G. Li, L. Jing, S. Liu and Y. Sakka, J. Solid State Chem., 2013, 206, 104–112 CrossRef CAS.
- T. Deng and X. Jiang, Opt. Mater., 2018, 78, 27–34 CrossRef CAS.
- F. W. Kang, M. J. Peng, Q. Y. Zhang and J. R. Qiu, Chem.–Eur. J., 2014, 20, 11522–11530 CrossRef CAS PubMed.
- J. Y. Zhong, W. R. Zhao, F. Du, J. Wen, W. D. Zhuang, R. H. Liu, C. K. Duan, L. G. Wang and K. Lin, J. Phys. Chem. C, 2018, 122, 7849–7858 CrossRef CAS.
- Y. Chen, Z. Y. Wang, W. G. Ding, X. Li, Q. Bao, J. J. Liu, K. L. Qiu, X. Y. Meng, Z. P. Yang and L. P. Li, RSC Adv., 2019, 9, 30406–30418 RSC.
- J. Qiao, L. Ning, M. S. Molokeev, Y.-C. Chuang, Q. Liu and Z. Xia, J. Am. Chem. Soc., 2018, 140, 9730–9736 CrossRef CAS PubMed.
- S. Q. Fang, T. C. Lang, T. Han, J. Y. Wang, J. Y. Yang, S. X. Cao, L. L. Peng, B. T. Liu, A. N. Yakovlev and V. I. Korepanov, Chem. Eng. J., 2020, 389, 124297 CrossRef CAS.
- D. Zhao, Y. L. Xue and S. R. Zhang, J. Mater. Chem. C, 2019, 7, 14264–14274 RSC.
- S. H. Wang, Y. Q. Xu, T. Chen, W. H. Jiang, J. M. Liu, X. Zhang, W. Jiang and L. J. Wang, Chem. Eng. J., 2021, 404, 125912 CrossRef CAS.
- K. Upadhyay, R. K. Tamrakar and V. Dubey, Superlattices Microstruct., 2015, 78, 116–124 CrossRef CAS.
- Q. Dong, F. Yang, J. Cui, Y. Tian, S. Liu, F. Du, J. Peng and X. Ye, Ceram. Int., 2019, 45, 11868–11875 CrossRef CAS.
- L. Jing, X. Liu and Y. Li, J. Lumin., 2015, 158, 351–355 CrossRef CAS.
- A. Hooda, A. Khatkar, S. Chahar, S. Singh, P. Dhankhar, S. P. Khatkar and V. B. Taxak, Ceram. Int., 2020, 46, 4204–4214 CrossRef CAS.
- S. Chahar, R. Devi, M. Dalal, M. Bala, J. Dalal, P. Boora, V. B. Taxak, R. Lather and S. P. Khatkar, Ceram. Int., 2019, 45, 606–613 CrossRef CAS.
- S. Y. Xin, F. G. Zhou, L. Zhao, B. T. Liu, C. Wang, X. J. Wang, Z. W. Li and G. Zhu, ECS J. Solid State Sci. Technol., 2018, 7, R94–R98 CrossRef CAS.
- F. Kang, M. Peng, Q. Zhang and J. Qiu, Chem.–Eur. J., 2014, 20, 11522–11530 CrossRef CAS.
- J. Y. Zhong, W. R. Zhao, F. Du, J. Wen, W. D. Zhuang, R. H. Liu, C. K. Duan, L. G. Wang and K. Lin, J. Phys. Chem. C, 2018, 122, 7849–7858 CrossRef CAS.
- W. Wang, M. Q. Fu, S. W. Liu, X. Y. Zhang, Y. Wei and G. G. Li, J. Lumin., 2022, 242, 118536 CrossRef CAS.
- S. Q. Fang, T. C. Lang, T. Han, J. Y. Wang, J. Y. Yang, S. X. Cao, L. L. Peng, B. T. Liu, A. N. Yakovlevb and V. I. Korepanovb, Chem. Eng. J., 2020, 389, 124297 CrossRef CAS.
- X. T. Fan, W. B. Chen, S. Y. Xin, Z. C. Liu and M. Zhou, J. Mater. Chem. C, 2018, 6, 2978–2982 RSC.
- J. Y. Ming, Y. X. Wang, S. K. Ling, S. Liao, Y. H. Huang and H. X. Zhang, Inorg. Chem. Commun., 2021, 127, 108549 CrossRef CAS.
- D. Zhao, Y. L. Xue and S. R. Zhang, J. Mater. Chem. C, 2019, 7, 14264–14274 RSC.
- L. Zhao, F. Y. Fan and X. Chen, J. Mater. Sci.: Mater. Electron., 2018, 29, 5975–5981 CrossRef CAS.
| This journal is © The Royal Society of Chemistry 2022 |

