 Open Access Article
A quinazolin-based Schiff-base chemosensor for colorimetric detection of Ni2+ and Zn2+ ions and ‘turn-on’ fluorometric detection of Zn2+ ion†
Vanshika Sharma,
Meman Sahu,
Amit Kumar Manna,
Dinesh De and
Goutam Kumar Patra *
*
Department of Chemistry, Guru Ghasidas Vishwavidyalaya, Bilaspur (C. G), India. E-mail: patra29in@yahoo.co.in; Tel: +91 7587312992
First published on 30th November 2022
Abstract
Herein, we have reported a novel quinazolin-based Schiff base chemosensor (E)-2-benzamido-N′-(1-(pyridin-2-yl)ethylidene)benzohydrazide (L). L has been designed, synthesised and characterised by 1H-NMR, IR spectroscopy, ESI-MS spectrometry and theoretical studies. The receptor showed appreciable colorimetric λmax shift for both Ni2+ and Zn2+ ions and fluorometric “turn on” response in presence of only Zn2+ ion. The Jobs plot analysis revealed that receptor forms 2![[thin space (1/6-em)]](https://www.rsc.org/images/entities/char_2009.gif) :
:![[thin space (1/6-em)]](https://www.rsc.org/images/entities/char_2009.gif) 1 complex with both the ions Ni2+ and Zn2+, further confirmed by ESI-MS analysis. The single crystal structure of L–Ni2+ complex (1) has also been determined. The colorimetric detection limits were calculated to 7.9 nM and 7.5 nM respectively for Ni2+ and Zn2+ in methanol–Tris–HCl buffer medium (10 mM, pH 7.2, 1
1 complex with both the ions Ni2+ and Zn2+, further confirmed by ESI-MS analysis. The single crystal structure of L–Ni2+ complex (1) has also been determined. The colorimetric detection limits were calculated to 7.9 nM and 7.5 nM respectively for Ni2+ and Zn2+ in methanol–Tris–HCl buffer medium (10 mM, pH 7.2, 1![[thin space (1/6-em)]](https://www.rsc.org/images/entities/char_2009.gif) :
:![[thin space (1/6-em)]](https://www.rsc.org/images/entities/char_2009.gif) 1 v/v). The chemosensor L can be applied for the recovery of contaminated water samples.
1 v/v). The chemosensor L can be applied for the recovery of contaminated water samples.
Introduction
Metal ion detection continues to be an important area of research both in the environment and in biological systems.1 Nickel has long been thought of as a potentially toxic metal. Decomposition or degradation of rocks and soil, biological cycles, particularly industrial processes, and water disposal are the main sources of nickel in aquatic systems.2 The tolerable concentration of Ni(II) ions in drinking water is 2.5 mg mL−1.3 Among the transition metal series, Ni2+ plays a significant part in biological activities like metabolism, respiration, and biosynthesis. It is a necessary component of various metallo-enzymes such hydrogenases, carbon monoxide dehydrogenases, and acireductone dioxygenases.4–6 In the chemical industry, it is widely used for the manufacture of practical electronics devices including Ni–Cd batteries, electroplating, and electroforming.7,8 One of the nickel alloys utilised in the manufacture of tools, machinery, and weapons is stainless steel.9 The adverse effects of excessive Ni2+ accumulation over the recommended limits on human physical health include respiratory issues, lung cancer, pneumonitis, allergies, and central nervous system disorders.10,11 Thus, one of the difficult issues in current research is the specific detection of Ni2+ ion at the biological and environmental level.Zinc ion is the second-most prevalent heavy metal ion and it is well known that zinc plays a significant role in cellular processes.12 Because of its structural characteristics, the zinc, a biologically significant metal ion, is essential for many pathophysiologic processes, including gene expression, cell apoptosis, enzymatic regulation, and neurotransmission.13–15 The breakdown of Zn2+ ion homeostasis, which is toxic in excess or absence may in the pathology of intellectual development as well as other neurological issues including Alzheimer's and Parkinson's diseases.16,17 Due to this, the detection of Zn2+ has been studied intensively. Many selective colorimetric and/or fluorescent probes targeting Zn2+ have been reported, that are mostly based on quinoline, fluorescein, benzazole, anthracene, coumarin, BODIPY, Schiff bases, indole, thiazole, terpyridin, naphthalimide, nanoparticles and so on.18–40
From the above reports most of them are fluorescent based and few are colorimetric fluorescent chemosensors. Xu et al. (2009) has reported an NBD-based colorimetric and fluorescent chemosensor for Zn2+ and its use for detection of intracellular zinc ions.41 S. Lee et al. (2016) has reported a Zn2+ colorimetric sensor using label-free silver nanoparticles.42 On the other hand, a fluorescent chemosensor that is “switching on” and selective to Zn2+ was described by Li et al.43 and applied in MCF-7 cells. Two new ratiometric chemosensors were also created and tested by Lee et al.44 for the detection of potentially harmful free Zn2+ ions in aqueous media. A novel fluorescent chemosensor was recently created by Chen and Li et al.45 using a cyclen moiety as the ionophore and a helical imide as the fluorophore. Moreover, Ding et al.46 developed selective and responsive “turn-on” fluorescentric Zn2+ sensors based on di- and tri-pyridines with easily modulatable emission wavelengths.
Inspired by the above research and our search on fluorescent colorimetric chemosensor,47,48 in this work, we have reported an optical sensor for colorimetric detection of Ni2+ and Zn2+ ions and selective fluorometric detection of Zn2+ ion. A quinazolinone derived Schiff base chemosensor (E)-2-benzamido-N′-(1-(pyridin-2-yl)ethylidene)benzohydrazide (L) has been designed, synthesised and characterised by 1H-NMR, IR spectroscopy, ESI-MS spectrometry and single crystal XRD analysis. The receptor showed colorimetric λmax shift for Ni2+ and Zn2+ (detection limit was 7.9 nM and 7.5 nM respectively) and fluorometric “turn-on” response for Zn2+ ion with detection limit 1.7 nM in methanol–Tris–HCl buffer medium (10 mM, pH 7.2, 1![[thin space (1/6-em)]](https://www.rsc.org/images/entities/char_2009.gif) :
:![[thin space (1/6-em)]](https://www.rsc.org/images/entities/char_2009.gif) 1 v/v). The Jobs plot analysis revealed that receptor forms 2
1 v/v). The Jobs plot analysis revealed that receptor forms 2![[thin space (1/6-em)]](https://www.rsc.org/images/entities/char_2009.gif) :
:![[thin space (1/6-em)]](https://www.rsc.org/images/entities/char_2009.gif) 1 complex with both the ions Ni2+ and Zn2+, further confirmed by ESI-MS analysis. The single crystal structure of L–Ni2+ complex, 3 has also been isolated. The chemosensor L can be applied to the recovery of contaminated water samples.
1 complex with both the ions Ni2+ and Zn2+, further confirmed by ESI-MS analysis. The single crystal structure of L–Ni2+ complex, 3 has also been isolated. The chemosensor L can be applied to the recovery of contaminated water samples.
Experimental
Materials and general information
The necessary components were purchased from Sigma-Aldrich and employed for synthesis without further purification. For the majority of the experiments, analytical-grade solvents were utilised, and double-deionized water was used for dilution and the preparation of Tris buffer (pH = 7.2) solution. The metal ion solutions were made from their nitrate salts. 1H-NMR and 13C-NMR spectra were recorded on a Bruker DRX spectrometer operating at 400 MHz in CDCl3 and chemical shifts were recorded in ppm relative to TMS. On a Shimadzu UV 1800 spectrophotometer, absorption spectra were captured using a quartz cuvette with a 10 mm path length and a wavelength of between 200 and 800 nm. Using a Waters mass spectrometer with mixed solvent HPLC methanol and triple-distilled water, high resolution mass (HRMs) spectra were captured. The pH measurements were done using a digital pH meter (Merck) by adjusting dilute hydrochloric acid and sodium hydroxide in buffer solution. Solutions of the receptor L (1 × 10⁻⁵ M) and metal salts (1 × 10⁻⁴ M) were prepared in CH3OH–H2O (1![[thin space (1/6-em)]](https://www.rsc.org/images/entities/char_2009.gif) :
:![[thin space (1/6-em)]](https://www.rsc.org/images/entities/char_2009.gif) 1, v/v) and H2O respectively.
1, v/v) and H2O respectively.
X-ray data collection and structural determination
X-ray single crystal data were collected using MoKα (λ = 0.7107 Å) radiation on a BRUKER APEX II diffractometer equipped with CCD area detector. Data collection, data reduction, structure solution/refinement were carried out using the software package of SMART APEX.49 The structures were solved by direct methods (SHELXS-97) and standard Fourier techniques, and refined on F2 using full matrix least squares procedures (SHELXL-97) using the SHELX-97 package50 incorporated in WinGX.51 In most of the cases, non-hydrogen atoms were treated anisotropically. Hydrogen atoms were fixed geometrically at their calculated positions following riding atom model. Structural information of 3 have been deposited at the Cambridge Crystallographic Data Center (CCDC number 2205292†).Synthesis of 2-phenyl-4(3H)-3,1-benzoxazinone (1)
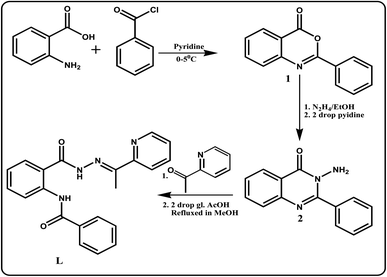
The 2-phenyl-4H-benzoxalin-4-one (1) has been synthesized by following the reported procedure52 with some modification. To a stirred solution of anthranilic acid (2.74 g, 0.020 mol) in pyridine (12 mL), benzoyl chloride (2.81 g, 0.020 mol) was added dropwise, maintaining the temperature about 0–5 °C for 1 h. The reaction mixture was stirred for another 3 h at room temperature until a solid product was formed. The reaction mixture was neutralized with saturated sodium bicarbonate solution and the pale yellow solid which separated was filtered, washed with water and re-crystallized from ethanol. Yield, 3.8 g, 85%; mp 112–115 °C. 13C NMR (400 MHz, CDCl3, TMS): δ 100.2 (1C, C![[double bond, length as m-dash]](https://www.rsc.org/images/entities/char_e001.gif) N), 130.4–137.0 (12C, aromatic carbons), 172.1 (1C, C
N), 130.4–137.0 (12C, aromatic carbons), 172.1 (1C, C![[double bond, length as m-dash]](https://www.rsc.org/images/entities/char_e001.gif) O). 1H NMR (400 MHz, CDCl3, TMS): δ 8.31 (d, 2H), 8.24 (d, 1H), 7.82 (t, 1H), 7.69 (d, 1H), 7.58 (t, 1H), 7.51 (m, 3H) (Fig. S1†).
O). 1H NMR (400 MHz, CDCl3, TMS): δ 8.31 (d, 2H), 8.24 (d, 1H), 7.82 (t, 1H), 7.69 (d, 1H), 7.58 (t, 1H), 7.51 (m, 3H) (Fig. S1†).
Synthesis of 3-amino-2-phenyl-4(3H)-quinazolinone (2)
To a stirred solution of 1 (2.23 g, 0.01 mol) in ethanol (20 mL), 80% N2H4·H2O (0.5 g, 0.01 mol) and a catalytic amount of pyridine (2–4 drop) was added. The reaction mixture was stirred and refluxed for 2 h at 117 °C. After cooling, the crude product was obtained by filtration and the crude product was recrystallized from ethanol to afford 2 as a white product.53 Yield, 2.15 g, 90%; mp 178–180 °C. 13C NMR (400 MHz, CDCl3, TMS): δ 110.5 (1C, C![[double bond, length as m-dash]](https://www.rsc.org/images/entities/char_e001.gif) N), 126.6–140.3 (12C, aromatic carbons), 167.4 (1C, C
N), 126.6–140.3 (12C, aromatic carbons), 167.4 (1C, C![[double bond, length as m-dash]](https://www.rsc.org/images/entities/char_e001.gif) O). 1H NMR (400 MHz, CDCl3, TMS): δ 8.45 (d, 2H), 7.92 (s, 1H), 7.68 (m, 4H), 7.51 (d, 2H), 6.85 (s, 2H) (Fig. S2†).
O). 1H NMR (400 MHz, CDCl3, TMS): δ 8.45 (d, 2H), 7.92 (s, 1H), 7.68 (m, 4H), 7.51 (d, 2H), 6.85 (s, 2H) (Fig. S2†).
Synthesis of N-(E)-N′-(4-(diethylamino)-2-hydroxybenzylidene)-2-(benzamido) benzohydrazide (L)
2.37 g (0.01 mol) of 2 was dissolved in 20 mL of absolute ethanol and to this solution 1.21 g (0.01 mol) 1-(pyridin-2-yl)ethanone was added dropwise with constant stirring. Then the reaction mixture was refluxed for 12 h under dry condition. The resulting mixture was kept in air for 24 h. Needle shaped crystals separated out was filtered, washed with methanol and dried in air. Yield, 3.15 g, 87%; mp = 235–237 °C. Single crystals suitable for X-ray analysis were obtained from the slow evaporation of dichloromethane solution of L. Anal. calc. for C21H18N4O2: C, 70.38; H, 5.06; N, 15.63. Found C, 70.68; H, 5.05; N, 15.07%. EI-MS: m/z 359.14 (M + Na+, 100%); (Fig. S3†). FTIR/cm−1 (KBr): 3216 (-NH), 3040 (m, aromatic CH– str), 1676 (vs., C![[double bond, length as m-dash]](https://www.rsc.org/images/entities/char_e001.gif) O), 1631 (vs., C
O), 1631 (vs., C![[double bond, length as m-dash]](https://www.rsc.org/images/entities/char_e001.gif) N), 1525 (s), 1454 (s), 1370 (m), 1316 (s), 1260 (s), 1167 (s), 1092 (s), 1037 (m), 972 (s), 934 (s) (S4). 1H NMR (400 MHz, CDCl3, TMS): δ 11.57 (s, NH), 11.32 (s, 1H, NH), 8.87 (s, 1H, azomethine), 8.1–6.9 (m, 12H, aromatic), 1.19 (s, 3H, methyl) (Fig. S5†). 13C NMR (CDCl3, δ ppm, TMS): 165.81, 158.93, 151.27, 139.01, 134.09, 132.67, 131.31, 130.38, 129.39, 129.22, 128.35, 128.09, 127.61, 127.02, 126.76, 123.63, 122.34, 119.60, 117.72, 117.52, 19.45 (Fig. S6†).
N), 1525 (s), 1454 (s), 1370 (m), 1316 (s), 1260 (s), 1167 (s), 1092 (s), 1037 (m), 972 (s), 934 (s) (S4). 1H NMR (400 MHz, CDCl3, TMS): δ 11.57 (s, NH), 11.32 (s, 1H, NH), 8.87 (s, 1H, azomethine), 8.1–6.9 (m, 12H, aromatic), 1.19 (s, 3H, methyl) (Fig. S5†). 13C NMR (CDCl3, δ ppm, TMS): 165.81, 158.93, 151.27, 139.01, 134.09, 132.67, 131.31, 130.38, 129.39, 129.22, 128.35, 128.09, 127.61, 127.02, 126.76, 123.63, 122.34, 119.60, 117.72, 117.52, 19.45 (Fig. S6†).
Synthesis of Ni2+ complex of L (NiL2, 3)
A methanolic solution (10 mL) of Ni(NO3)2·3H2O (0.120 g, 0.5 mmol) was added dropwise with stirring to the saturated solution of L (0.181 g, 0.5 mmol) in methanol (20 mL). The resulting mixture was continuously stirred for 1 h at room temperature and then filtered. Yield, 69%. Anal. calc. for C42H36N8NiO4: C, 65.05; H, 4.68; N, 14.45%. Found C, 64.96; H, 4.59; N, 14.53%. EI-MS: m/z 772.2 (2L–2H+ + Ni2+) (Fig. S7†). FTIR/cm−1 (KBr):3440 (–NH), 3024 (m, aromatic CH– str), 1660 (vs., C![[double bond, length as m-dash]](https://www.rsc.org/images/entities/char_e001.gif) O), 1606 (vs., C
O), 1606 (vs., C![[double bond, length as m-dash]](https://www.rsc.org/images/entities/char_e001.gif) N), 1504 (s), 1443 (m), 1385 (s), 1313 (s), 1216 (s), 1167 (s), 1037 (m), 708 (s) (Fig. S8†). Slow evaporation of the methanol solution of 3 yielded dark red crystalline solid (suitable for X-ray analysis).
N), 1504 (s), 1443 (m), 1385 (s), 1313 (s), 1216 (s), 1167 (s), 1037 (m), 708 (s) (Fig. S8†). Slow evaporation of the methanol solution of 3 yielded dark red crystalline solid (suitable for X-ray analysis).
Synthesis of Zn2+ complex of L (ZnL2, 4)
A methanolic solution (10 mL) of Zn(NO3)2·6H2O (0.150 g, 0.5 mmol) was added dropwise with stirring to the saturated solution of L (0.181 g, 0.5 mmol) in methanol (20 mL). The resulting mixture was continuously stirred for 1 h at room temperature and then filtered. Yield, 72%. Anal. calc. for C42H36N8ZnO4: C, 64.49; H, 4.64; N, 14.33%. Found C, 64.56; H, 4.55; N, 14.47%. EI-MS: m/z 803.2 (2L + Zn2+ + Na+) (Fig. S9†). FTIR/cm−1 (KBr): 3068 (w), 2928 (m), 1665 (vs., C![[double bond, length as m-dash]](https://www.rsc.org/images/entities/char_e001.gif) O), 1643 (vs., C
O), 1643 (vs., C![[double bond, length as m-dash]](https://www.rsc.org/images/entities/char_e001.gif) N), 1595 (s), 1519 (s), 1446 (m), 1342 (m), 1242 (s), 1137 (m), 762 (m), (Fig. S10†).
N), 1595 (s), 1519 (s), 1446 (m), 1342 (m), 1242 (s), 1137 (m), 762 (m), (Fig. S10†).
Photo physical measurements
Chemosensor L (3.58 mg) was dissolved separately in 10 mL of homogeneous solvent CH3OH–H2O (1![[thin space (1/6-em)]](https://www.rsc.org/images/entities/char_2009.gif) :
:![[thin space (1/6-em)]](https://www.rsc.org/images/entities/char_2009.gif) 1, v/v) to make a solution of 1 × 10⁻³ M and 30 μL of each of this solution were diluted with 2.97 mL of CH3OH–Tris buffer (1
1, v/v) to make a solution of 1 × 10⁻³ M and 30 μL of each of this solution were diluted with 2.97 mL of CH3OH–Tris buffer (1![[thin space (1/6-em)]](https://www.rsc.org/images/entities/char_2009.gif) :
:![[thin space (1/6-em)]](https://www.rsc.org/images/entities/char_2009.gif) 1 v/v) mixture to make a final concentration of 10 μM. The analyte solutions have been prepared using nitrate salt of metals in the order of 10−4 M in double-distilled water. After mixing L with each of the metal ions for a few seconds, absorption and fluorescence spectra were obtained at room temperature.
1 v/v) mixture to make a final concentration of 10 μM. The analyte solutions have been prepared using nitrate salt of metals in the order of 10−4 M in double-distilled water. After mixing L with each of the metal ions for a few seconds, absorption and fluorescence spectra were obtained at room temperature.
Job's plot measurements
A methanol–Tris buffer (1![[thin space (1/6-em)]](https://www.rsc.org/images/entities/char_2009.gif) :
:![[thin space (1/6-em)]](https://www.rsc.org/images/entities/char_2009.gif) 1) solutions containing L (10 μM) and aqueous solution of Ni(NO3)2 and Zn(NO3)2 (10 μM each) were prepared separately. Then changing the mole ratio of the L from 0.1 to 0.9 in such a manner that the sum of the total metal ion and L volume remained constant (2 mL). All the solutions were diluted to 3 mL. After shaking them for a minute, UV-vis spectra were obtained at room temperature.
1) solutions containing L (10 μM) and aqueous solution of Ni(NO3)2 and Zn(NO3)2 (10 μM each) were prepared separately. Then changing the mole ratio of the L from 0.1 to 0.9 in such a manner that the sum of the total metal ion and L volume remained constant (2 mL). All the solutions were diluted to 3 mL. After shaking them for a minute, UV-vis spectra were obtained at room temperature.
Computational details
The program package GAUSSIAN-09 Revision C.01 was employed for all calculations.54 The gas phase geometries of the compound were fully optimized symmetry restrictions in singlet ground state with the gradient-corrected DFT level coupled with B3LYP.55 Basis set LanL2DZ was used for the whole molecules L and NiL2 (3). The HOMOs and LUMOs of molecular ions were calculated with the same basis set and functional.Result and discussion
Synthesis and structure of L
The coupling reaction between aldehyde and amine generate the imine functionalised ligand L (Scheme 1) with high yield (over 85%) and it was characterised by elemental analysis, FTIR, 1H NMR and ESI-mass spectra.UV-vis spectroscopic studies of L towards different metal ions
The receptor contains imine linker as well as several amide functional moieties thus interaction with cations and anions were expected. Thus absorption studies of L in presence of common cations and anions were performed at room temperature in methanol–Tris–HCl buffer (1![[thin space (1/6-em)]](https://www.rsc.org/images/entities/char_2009.gif) :
:![[thin space (1/6-em)]](https://www.rsc.org/images/entities/char_2009.gif) 1 v/v, 10 mM, pH 7.2) solution. The receptor L shows main absorption band at 280 nm due to π–π* transition. This absorption band of L significantly red shifted to around 375 nm only in presence of 2 equiv. of Ni2+ and Zn2+ ions with the change of colour of the solution from colourless to yellow. Addition of same amount of several metal like Cu2+, Co2+, Cd2+, Cr3+, Mn7+, Sm3+, Al3+ to the solution of receptor L, also absorption band shift observed, but the color and absorbance intensity produced by these ions is not very prominent when compare with Ni2+ and Zn2+ ions. The remaining cations and anions e.g. Fe3+, Hg2+, Pb2+, Cr3+, Ag+, Mn2+, Fe2+ etc. cannot produced any significant change of receptor solution at that condition (Fig. S11†).
1 v/v, 10 mM, pH 7.2) solution. The receptor L shows main absorption band at 280 nm due to π–π* transition. This absorption band of L significantly red shifted to around 375 nm only in presence of 2 equiv. of Ni2+ and Zn2+ ions with the change of colour of the solution from colourless to yellow. Addition of same amount of several metal like Cu2+, Co2+, Cd2+, Cr3+, Mn7+, Sm3+, Al3+ to the solution of receptor L, also absorption band shift observed, but the color and absorbance intensity produced by these ions is not very prominent when compare with Ni2+ and Zn2+ ions. The remaining cations and anions e.g. Fe3+, Hg2+, Pb2+, Cr3+, Ag+, Mn2+, Fe2+ etc. cannot produced any significant change of receptor solution at that condition (Fig. S11†).
After that, using same UV-vis spectrophotometer, receptor L was titrated separately in presence of Ni2+ and Zn2+ ions in methanol–Tris–HCl buffer (1![[thin space (1/6-em)]](https://www.rsc.org/images/entities/char_2009.gif) :
:![[thin space (1/6-em)]](https://www.rsc.org/images/entities/char_2009.gif) 1 v/v, 10 mM, pH 7.2) solution. Here successive amount addition of analyte ions to the ligand L, absorption band gradually enhanced at ∼375 nm for Ni2+ whereas 333 nm and 375 nm for Zn2+ ion. As a results the absorption band at 280 nm goes on decreasing simultaneously and well-defined isosbestic point developed at 332 nm and 331 nm for Ni2+ and Zn2+ ions respectively. This change in absorption behaviour of L with addition of Ni2+ and Zn2+ ions remained consistent up to 0.5 equiv. for both ions and then remained well saturated (Fig. 1).
1 v/v, 10 mM, pH 7.2) solution. Here successive amount addition of analyte ions to the ligand L, absorption band gradually enhanced at ∼375 nm for Ni2+ whereas 333 nm and 375 nm for Zn2+ ion. As a results the absorption band at 280 nm goes on decreasing simultaneously and well-defined isosbestic point developed at 332 nm and 331 nm for Ni2+ and Zn2+ ions respectively. This change in absorption behaviour of L with addition of Ni2+ and Zn2+ ions remained consistent up to 0.5 equiv. for both ions and then remained well saturated (Fig. 1).
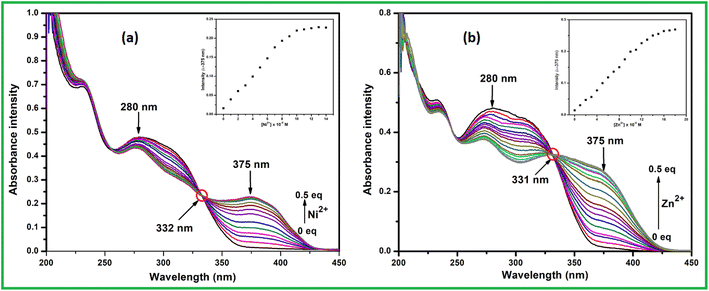 | ||
| Fig. 1 UV-vis titration of L with (a) Ni2+ and (b) Zn2+ in methanol–Tris–HCl buffer. (Inset) Plot of intensity vs. analyte concentration. | ||
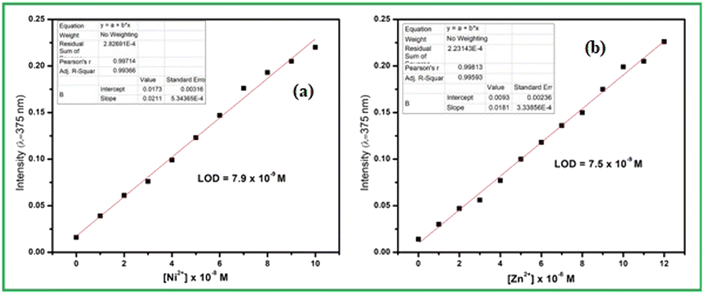
From the titration experiments the calibration curves were plotted where the absorbance intensity around 375 nm for both the metal ions varies almost linearly with the concentration. Thus detection limit was calculated to 7.9 × 10⁻⁹ M for Ni2+ and 7.9 × 10⁻⁹ M for Zn2+ using convenient formula DL = 3σ/m, here ‘σ’ is standard deviation of the blank measurement and ‘m’ is the slope of the linear calibration curve (Fig. 2). This low level DL values are far below the guideline provided by WHO in drinking water and several reported Ni2+ and Zn2+ sensors. As per WHO, the permissible limits of Ni2+ and Zn2+ ions in drinking waters are 0.0008 and 5.0 mg L−1 respectively.56
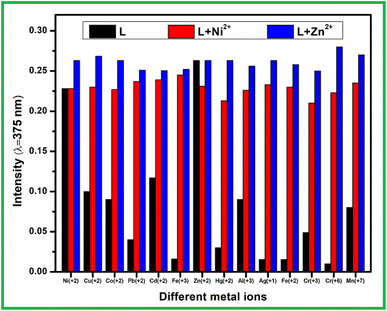
The precise detection of analyte like Zn2+ and Ni2+ ion in real water sample can be hampered in presence of other interfering ions due to their cross responses. Thus analyte signalling of receptor L was performed in presence of common competiting ions as a background. The presence of same equivalent of other interfering cations with analyte ion, the absorption spectra of host–guest complex cannot be disturbed (Fig. 3). Even 3 fold excessive addition of competitive metal ions than analyte, the original peak intensity of L + M2+ remained almost negligible change. Moreover, presence of equal amount of Zn2+ ion to the L–Ni2+ solution can replace Ni2+, thus corresponding absorbance band intensity to L–Zn2+ complex was observed.
The Job's plot indicates that here 2![[thin space (1/6-em)]](https://www.rsc.org/images/entities/char_2009.gif) :
:![[thin space (1/6-em)]](https://www.rsc.org/images/entities/char_2009.gif) 1 binding stoichiometric ratio obtained between receptor L and both the analyte metal ions Ni2+ and Zn2+ (Fig. S12†), which was further confirmed by ESI-MS analysis (Fig. S7 and S9†) and single crystal structure of the L–Ni2+ (3) was isolated complex (vide infra). In the ESI-MS spectra peaks at m/z 772.2 (Fig. S7†) and m/z at m/z 803.2 (Fig. S9†) indicated 2
1 binding stoichiometric ratio obtained between receptor L and both the analyte metal ions Ni2+ and Zn2+ (Fig. S12†), which was further confirmed by ESI-MS analysis (Fig. S7 and S9†) and single crystal structure of the L–Ni2+ (3) was isolated complex (vide infra). In the ESI-MS spectra peaks at m/z 772.2 (Fig. S7†) and m/z at m/z 803.2 (Fig. S9†) indicated 2![[thin space (1/6-em)]](https://www.rsc.org/images/entities/char_2009.gif) :
:![[thin space (1/6-em)]](https://www.rsc.org/images/entities/char_2009.gif) 1 binding stoichiometric ratio between the ligand L and the metal ions Ni2+ and Zn2+ respectively. Assuming 2
1 binding stoichiometric ratio between the ligand L and the metal ions Ni2+ and Zn2+ respectively. Assuming 2![[thin space (1/6-em)]](https://www.rsc.org/images/entities/char_2009.gif) :
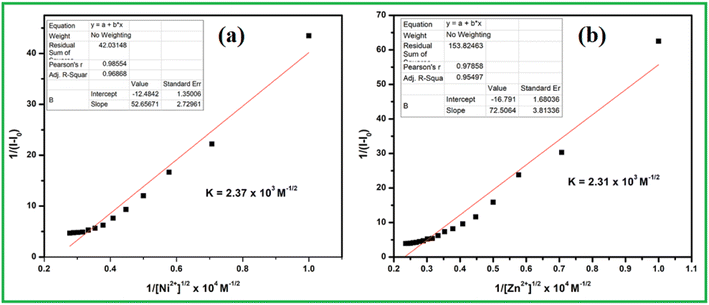
:![[thin space (1/6-em)]](https://www.rsc.org/images/entities/char_2009.gif) 1 host–guest ratio, the association constants were calculated from Benesi–Hildebrand (B–H) equation by the linear fitting of graph 1/(A − A0) vs. 1/[M2+]1/2 (Fig. 4). The values obtained as 2.37 × 10³ M−1/2 and 2.31 × 10³ M−1/2 for Ni2+ and Zn2+ ion respectively, indicates very strong affinity between receptor and analytes.
1 host–guest ratio, the association constants were calculated from Benesi–Hildebrand (B–H) equation by the linear fitting of graph 1/(A − A0) vs. 1/[M2+]1/2 (Fig. 4). The values obtained as 2.37 × 10³ M−1/2 and 2.31 × 10³ M−1/2 for Ni2+ and Zn2+ ion respectively, indicates very strong affinity between receptor and analytes.
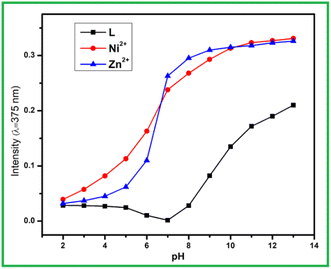
As we are interested on analyte sensing in aqueous or semi aqueous medium, thus pH of this medium plays a very crucial role as receptor contain pH sensitive amide (–CONH–) and imine (>C![[double bond, length as m-dash]](https://www.rsc.org/images/entities/char_e001.gif) N) moieties. For that purpose, receptor solutions with variable pH range 2 to 12 were adjusted by dilute HCl and NaOH and then analyte ions were added independently. The sequential UV-vis studies of each set of solution indicates that absorbance intensity at 375 nm for L and its metal complexes are mostly increases with pH. At pH = 2–4, there is less absorbance intensity difference observed between L and L + M2+ (M = Zn and Ni), thus not very suitable to sense at this pH range. Thus in a wide range of pH = 5–12 the proposed chemosensor can successfully sense both Ni2+ and Zn2+ ion including physiological environment (Fig. 5).
N) moieties. For that purpose, receptor solutions with variable pH range 2 to 12 were adjusted by dilute HCl and NaOH and then analyte ions were added independently. The sequential UV-vis studies of each set of solution indicates that absorbance intensity at 375 nm for L and its metal complexes are mostly increases with pH. At pH = 2–4, there is less absorbance intensity difference observed between L and L + M2+ (M = Zn and Ni), thus not very suitable to sense at this pH range. Thus in a wide range of pH = 5–12 the proposed chemosensor can successfully sense both Ni2+ and Zn2+ ion including physiological environment (Fig. 5).
Generally, metal ions like Ni2+ and Zn2+ ion form stable chelate complex with multidentate ligand Na2EDTA. Thus reversibility was checked by absorption studies L + M2+ (M = Zn and Ni) solution with Na2EDTA in working medium. The characteristic absorption bands of host–guest complexes around 375 nm, instantly disappeared when L + M2+ (M = Zn and Ni) complex reacted with 1 equiv. Na2EDTA (Fig. 6). Thus absorbance intensity at 280 nm restored with solution turns yellow to colourless due to generation of L. Further addition of analytes, the absorbance intensity at 375 nm was almost recovered. The alternative addition of chelator and analytes, absorption switching between L and L + M2+ were almost consistent up to 4 cycles with negligible loss of absorbance intensity which indicate that sensing process is reversible than any irreversible metal catalysed reaction.
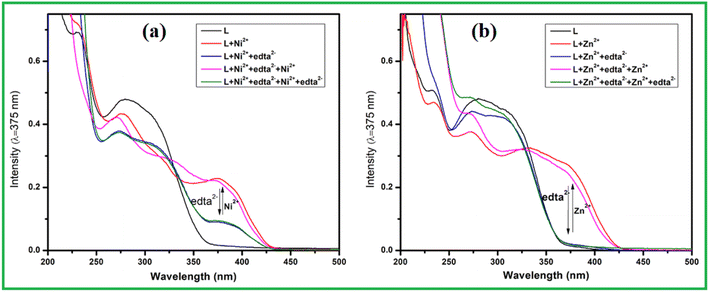 | ||
| Fig. 6 Absorbance spectra of L in the absence and presence of (a) Ni2+ and Na2EDTA, and (b) Zn2+ and Na2EDTA. | ||
Fluorescence studies
The emission properties of the receptor L in presence of selective metal ions was also examined in methanol–Tris–HCl buffer (10 mM, pH 7.2) mixture (1![[thin space (1/6-em)]](https://www.rsc.org/images/entities/char_2009.gif) :
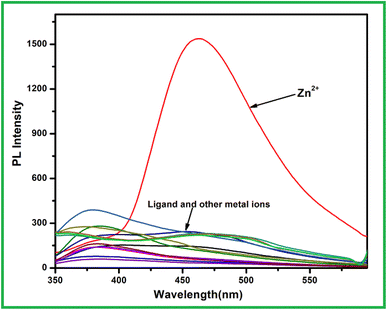
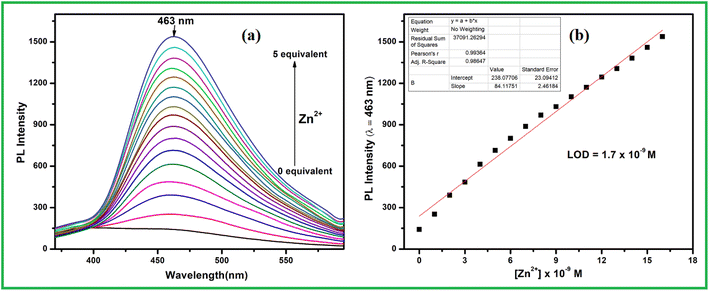
:![[thin space (1/6-em)]](https://www.rsc.org/images/entities/char_2009.gif) 1 v/v). Among the selected metal ions like Fe3+, Cu2+, Co2+, Ni2+, Zn2+, Cd2+, Hg2+, Pb2+, Cr3+, Ag+, Al3+, Mn2+ and Fe2+ only addition of 2 equiv. Zn2+ ion to the ligand solution emission intensity at 463 nm significantly enhanced whereas the same amount of other metal ions including Ni2+ induced very significant emission change of receptor L (Fig. 7). To get the details aspect of the emission spectra, titration experiment was conducted. When excited at 290 nm free receptor L showed weak emission at 455 nm. Upon increasing the Zn2+ ion concentration in the receptor solution, emission intensity gradually enhanced with slightly red shifted to 463 nm that got saturated up to 5 equiv. of Zn2+ ion (Fig. 8a). The metal ion coordination with receptor L via imine side probably restricted both the non-radiative PET and >C
1 v/v). Among the selected metal ions like Fe3+, Cu2+, Co2+, Ni2+, Zn2+, Cd2+, Hg2+, Pb2+, Cr3+, Ag+, Al3+, Mn2+ and Fe2+ only addition of 2 equiv. Zn2+ ion to the ligand solution emission intensity at 463 nm significantly enhanced whereas the same amount of other metal ions including Ni2+ induced very significant emission change of receptor L (Fig. 7). To get the details aspect of the emission spectra, titration experiment was conducted. When excited at 290 nm free receptor L showed weak emission at 455 nm. Upon increasing the Zn2+ ion concentration in the receptor solution, emission intensity gradually enhanced with slightly red shifted to 463 nm that got saturated up to 5 equiv. of Zn2+ ion (Fig. 8a). The metal ion coordination with receptor L via imine side probably restricted both the non-radiative PET and >C![[double bond, length as m-dash]](https://www.rsc.org/images/entities/char_e001.gif) N isomerisation process, thus emission intensity increase due to chelation enhancement fluorescence effect (CHEF). At the same time, there is no change in emission intensity of L in case of Ni2+ ion indicate that in L–Ni2+ complex both the opposing process i.e. paramagnetic fluorescence quenching and chelation enhancement fluorescence effect mutually compensate to each other. The emission enhancement of L in presence of Zn2+ ion, cannot be disturbed in addition of 2-fold higher concentration of other metal ions. The fluorometric detection limit was found to 1.7 × 10⁻⁹ M calculated using the same formula 3σ/m (Fig. 8b).
N isomerisation process, thus emission intensity increase due to chelation enhancement fluorescence effect (CHEF). At the same time, there is no change in emission intensity of L in case of Ni2+ ion indicate that in L–Ni2+ complex both the opposing process i.e. paramagnetic fluorescence quenching and chelation enhancement fluorescence effect mutually compensate to each other. The emission enhancement of L in presence of Zn2+ ion, cannot be disturbed in addition of 2-fold higher concentration of other metal ions. The fluorometric detection limit was found to 1.7 × 10⁻⁹ M calculated using the same formula 3σ/m (Fig. 8b).
DFT calculation
The geometry optimizations staring from the Gauss-view structure of L lead to a global minimum as a stationary level. The optimized structures of the L and its Ni2+ complex (3) and schematic representation of the energy of MOs and contours of selected HOMO and LUMO orbitals of L and 3 are presented in Fig. 9. The HOMO to LUMO energy gap for L is 3.25 eV, whereas for 3, the gap is 2.92 eV.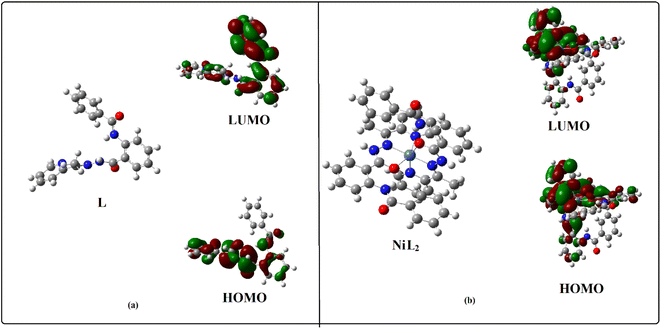 | ||
| Fig. 9 (a) Energy minimized structure of the L and NiL2 (3); (b) a schematic representation of the energy of MOs and contours of selected HOMO and LUMO orbitals of L and NiL2. | ||
X-ray single crystal structure of NiL2 (3)
The ligand L reacts with Ni(NO3)2 (2![[thin space (1/6-em)]](https://www.rsc.org/images/entities/char_2009.gif) :
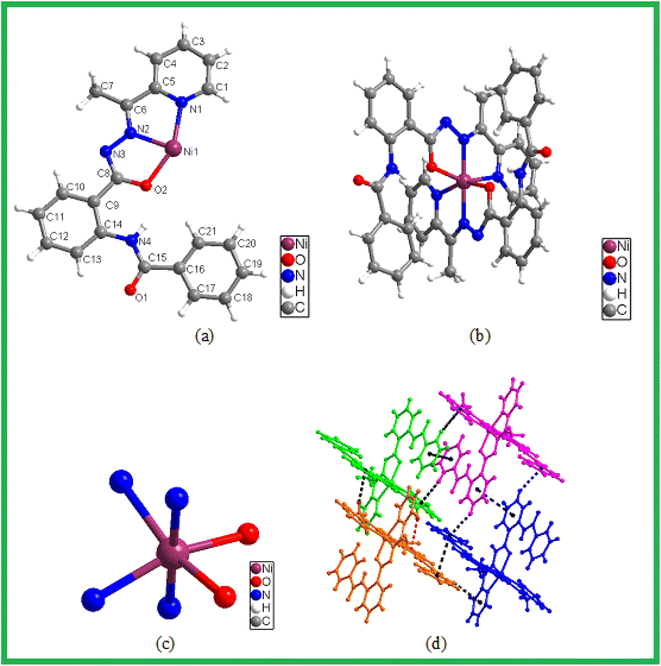
:![[thin space (1/6-em)]](https://www.rsc.org/images/entities/char_2009.gif) 1 molar ratio) in methanol at room temperature to form the complex 3. It crystallizes in the monoclinic space group C2/c (Table 1). The asymmetric unit consists of one L ligand and one Ni2+ ion (Fig. 10a) with occupancy half. The overall complex contains one Ni2+ ion and two L ligands (Fig. 10b). The metal ion shows distorted octahedral coordination with N4O2 donor sets from two pyridyl N, two amide O and two hydrazide N (Fig. 10c). The Ni–N and Ni–O bond distances and bond angles (Tables S1 and S2†) were found to be within normal ranges. The charges on Ni(II) ion were internally compensated by two deprotonated hydrazide NH originating from two L. Carefully looking into the structure of 1 revealed that the complex is associated through intermolecular π–π stacking and CH–π interactions (Fig. 10d).
1 molar ratio) in methanol at room temperature to form the complex 3. It crystallizes in the monoclinic space group C2/c (Table 1). The asymmetric unit consists of one L ligand and one Ni2+ ion (Fig. 10a) with occupancy half. The overall complex contains one Ni2+ ion and two L ligands (Fig. 10b). The metal ion shows distorted octahedral coordination with N4O2 donor sets from two pyridyl N, two amide O and two hydrazide N (Fig. 10c). The Ni–N and Ni–O bond distances and bond angles (Tables S1 and S2†) were found to be within normal ranges. The charges on Ni(II) ion were internally compensated by two deprotonated hydrazide NH originating from two L. Carefully looking into the structure of 1 revealed that the complex is associated through intermolecular π–π stacking and CH–π interactions (Fig. 10d).
| Empirical formula | C42H34N8NiO4 |
|---|---|
| Formula weight | 773.48 |
| Temperature/K | 221.68 |
| Crystal system | Monoclinic |
| Space group | C2/c |
| a/Å | 24.902(7) |
| b/Å | 11.539(3) |
| c/Å | 16.250(6) |
| α/° | 90 |
| β/° | 127.330(17) |
| γ/° | 90 |
| Volume/Å3 | 3713(2) |
| Z | 4 |
| ρcalc g cm−3 | 1.384 |
| μ/mm−1 | 0.578 |
| F(000) | 1608.0 |
| Crystal size/mm3 | 0.25 × 0.22 × 0.18 |
| Radiation | MoKα (λ = 0.71073) |
| 2θ range for data collection/° | 5.022 to 50.208 |
| Index ranges | −29 ≤ h ≤ 29, −13 ≤ k ≤ 13, −19 ≤ l ≤ 19 |
| Reflections collected | 17![[thin space (1/6-em)]](https://www.rsc.org/images/entities/char_2009.gif) 858 858 |
| Independent reflections | 2761 [Rint = 0.2075, Rsigma = 0.1661] |
| Data/restraints/parameters | 2761/0/250 |
| Goodness-of-fit on F2 | 1.073 |
| Final R indexes [I ≧ 2σ (I)] | R1 = 0.0978, wR2 = 0.1692 |
| Final R indexes [all data] | R1 = 0.1542, wR2 = 0.1924 |
| Largest diff. peak/hole/e Å−3 | 0.43/−1.11 |
Comparison of the performance of L with other reported fluorescent and colorimetric chemosensors
Colorimetric detection of Ni2+ and Zn2+ ions and ‘turn-on’ fluorometric detection of Zn2+ ion using a single probe is not very common in the literature. Compared to the other systems, our system has several attractive analytical features, such as high sensitivity, wide linear range, high selectivity, lower detection limit, simple operation technology, good solubility, sensitive visualization and good practical applicability (Table 2). Moreover, the synthesis of our proposed chemosensor L requires only two steps and less hazardous reagents, and no hazardous by-product is formed.| Type of sensors | Ion sensing | Limit of detection (M) | Reference | |
|---|---|---|---|---|
| Colorimetrically | Fluorometrically | |||
| Aminopyridine Schiff bases based | Ni2+, Zn2+ | 6.96 × 10⁻⁷ and 4.17 × 10⁻⁷ | — | 57 |
| Zn2+ | — | 1.13 × 10⁻⁷, 2.95 × 10⁻⁷ | 57 | |
| Aminoantipyrine based | Zn2+ | — | 1.4 × 10⁻⁸ | 58 |
| Octopamine-based | Zn2+ | — | 9.9 × 10⁻⁷ | 59 |
| Benzothiazole-based | Ni2+, Zn2+ | Not provided | 2.50 × 10⁻⁷ and 3.0 × 10⁻⁷ | 60 |
| Naphthalimide-based | Ni2+, Zn2+ | — | 3.3 × 10⁻⁷ and 1.8 × 10⁻⁷ | 61 |
| Quinazolin-based | Ni2+, Zn2+ | 7.9 × 10⁻⁹ and 7.5 × 10⁻⁹ | — | This work |
| Zn2+ | — | 1.7 × 10⁻⁹ M | This work | |
Application
To explore the Ni2+ and Zn2+ sensing ability of the present chemosensor L in real water samples, we have tested the probe L in waste water and we got some result. Artificial M2+ (M = Ni, Zn) polluted tap water samples have been made by adding known amounts of standard M2+ solutions in order to test its sensing in various samples. The prepared samples were analyzed by the same UV-vis spectrometer and the recovery amounts were calculated using the calibration curve (intensity vs. conc.) with the help of Lambert–Beer law. As shown in Table 3, the M2+ concentration recovered for each sample are close in agreement with spiked amount with good precision. Thus, the receptor L can be suitable to detect M2+ ion quantitatively in real water samples, indicating that it could be applied in real environments (Table 3).| Sample | M2+ added | M2+ found | Recovery (%) | Relative error (%) |
|---|---|---|---|---|
| Ni2+ | 5 | 5.02 ± 1.5 | 100.5 | 0.4 |
| 10 | 10.15 ± 1.54 | 101.5 | 1.5 | |
| 20 | 19.70 ± 0.87 | 98.5 | 2.0 | |
| Zn2+ | 5 | 5.13 ± 0.97 | 102.6 | 2.6 |
| 10 | 9.87 ± 1.1 | 98.7 | 1.3 | |
| 20 | 20.06 ± 1.2 | 100.3 | 0.6 |
Conclusion
In summary, we have successfully designed and synthesized a quinazolinone derived Schiff base chemosensor L for colorimetric nanomolar detection of Ni2+ and colorimetric fluorescent detection of Zn2+ with high selectivity and sensitivity over other competitive ions in aqueous medium. A 2![[thin space (1/6-em)]](https://www.rsc.org/images/entities/char_2009.gif) :
:![[thin space (1/6-em)]](https://www.rsc.org/images/entities/char_2009.gif) 1 stoichiometry between L and Ni2+ were supported by Job-plot, ESI-mass spectral analysis and DFT studies. The single crystal of the L + Ni2+ was also isolated. The colorimetric detection limits reached up to 7.9 nM for Ni2+ and 7.5 nM for Zn2+ respectively. Fluorescent measurement of Zn2+ were obtained with the detection limit of 1.70 nM, which were far lower than those recommended by the WHO guidelines for drinking water. The reversible response to Ni2+ and Zn2+ ion was established by the Na2EDTA experiments. Moreover, L could operate in a wide range of pH and can be successfully applied for detection and quantification of Ni2+ in environmental samples.
1 stoichiometry between L and Ni2+ were supported by Job-plot, ESI-mass spectral analysis and DFT studies. The single crystal of the L + Ni2+ was also isolated. The colorimetric detection limits reached up to 7.9 nM for Ni2+ and 7.5 nM for Zn2+ respectively. Fluorescent measurement of Zn2+ were obtained with the detection limit of 1.70 nM, which were far lower than those recommended by the WHO guidelines for drinking water. The reversible response to Ni2+ and Zn2+ ion was established by the Na2EDTA experiments. Moreover, L could operate in a wide range of pH and can be successfully applied for detection and quantification of Ni2+ in environmental samples.
Conflicts of interest
Authors declare no conflicts of interest.Acknowledgements
G. K. P. would like to thank the Department of Science and Technology (SR/FST/CSI-264/2014 and EMR/2017/001789) New Delhi for financial support.References
- P. de Silva, H. Q. N. Gunaratne, T. Gunnlaugsson, A. J. M. Huxley, C. P. McCoy, J. T. Rademacher and T. E. Rice, Chem. Rev., 1997, 97, 1515 CrossRef PubMed.
- Elements and their compounds in the environment, ed. E. Merian, M. Anke, M. Ihnat and M. Stoepppler, Wiley-VCH, Weinheim, 2nd edn, 2004, pp. 1113–1124 Search PubMed.
- H. L. Bohn, B. L. McNeal, and G. A. O'Connor, Soil Chemistry, Wiley Interscience, Chichester, UK, 2nd edn, 1985 Search PubMed.
- B. Zambelli, F. Musiani, S. Benini and S. Ciurli, Acc. Chem. Res., 2011, 44, 520 CrossRef CAS PubMed.
- S. W. Ragsdale, J. Biol. Chem., 2009, 284, 18571 CrossRef CAS PubMed.
- R. J. Maier, Biochem. Soc. Trans., 2005, 33, 83 CrossRef CAS PubMed.
- K. S. Kasprzak, F. W. Sunderman and K. Salnikowa, Mutat. Res., 2003, 533, 67 CrossRef CAS PubMed.
- P. H. Kuck, Mineral Commodity Summaries: Nickel, United States Geological Survey, 2006 Search PubMed.
- J. R. Davis, Nickel, cobalt, and their alloys, ASM International, 2000, vol. 7 Search PubMed.
- W. Lee, K. A. Davis, R. L. Rettmer and R. F. Labbe, Am. J. Clin. Nutr., 1988, 48, 286 CrossRef CAS PubMed.
- X. Q. Liu, X. Zhou, X. Shu and J. Zhu, Macromolecules, 2009, 42, 7634 CrossRef CAS.
- J. M. Berg and Y. Shi, Science, 1996, 271, 1081 CrossRef CAS PubMed.
- K. H. Falchuk, Mol. Cell. Biochem., 1998, 188, 41–48 CrossRef CAS PubMed.
- W. Maret, C. Jacob, B. L. Vallee and E. H. Fischer, Proc. Natl. Acad. Sci. U. S. A., 1999, 96, 1936–1940 CrossRef CAS PubMed.
- H. H. Sandstead, J. Trace Elem. Exp. Med., 2003, 16(4), 165–173 CrossRef CAS.
- J. A. Duce, A. Tsatsanis and M. A. Cater, et al., Cell, 2010, 142, 857–867 CrossRef CAS PubMed.
- E. M. Alvarez, R. S. Otero, A. H. Ameijeiras, A. M. L. Real and J. L. L. Garcia, Biochim. Biophys. Acta, 2002, 1586, 155–168 CrossRef PubMed.
- T. Liu and S. Liu, Anal. Chem., 2011, 83, 2775–2785 CrossRef CAS PubMed.
- D. Dong, X. Jing, X. Zhang, X. Hu, Y. Wu and C. Duan, Tetrahedron, 2012, 68, 306–310 CrossRef CAS.
- A. Helal, M. Harun, M. Rashid, C. H. Choi and H. S. Kim, Tetrahedron, 2012, 68, 647–653 CrossRef CAS.
- P. Ashokkumar, V. T. Ramakrishnan and P. Ramamurthy, J. Phys. Chem. A, 2011, 115, 14292–14299 CrossRef CAS PubMed.
- Z. Xu, J. Yoon and D. R. Spring, Chem. Soc. Rev., 2010, 39(6), 1996–2006 RSC.
- L. Xue, C. Liu and H. Jiang, Chem. Commun., 2009, 9, 1061–1063 RSC.
- Y. Liu, N. Zhang, Y. Chen and L. H. Wang, Org. Lett., 2007, 9, 315–318 CrossRef CAS PubMed.
- H. A. Michaels, C. S. Murphy, R. J. Clark, M. W. Davidson and L. Zhu, Inorg. Chem., 2010, 49, 4278–4287 CrossRef CAS PubMed.
- H. K. Jin, Y. N. Jin, I. H. Hwang, J. Kang, J. Kim and C. Kim, Tetrahedron Lett., 2013, 54, 2415–2418 CrossRef.
- D. Maity and T. Govindaraju, Chem. Commun., 2012, 48, 1039–1041 RSC.
- J. Li, C. F. Zhang, Z. Z. Ming, G. F. Hao, W. C. Yang and G. F. Yang, Tetrahedron, 2013, 69, 4743–4748 CrossRef CAS.
- N. Boens, V. Leen and W. Dehaen, Chem. Soc. Rev., 2012, 41, 1130 RSC.
- A. N. Kursunlu, E. Guler, H. I. Ucan and R. W. Boyle, Dyes Pigm., 2012, 94, 496–502 CrossRef CAS.
- G. Consiglio, S. Failla, I. P. Oliveri, R. Purrello and B. S. Di, Dalton Trans., 2009, 47, 10426–10428 RSC.
- Y. Zhou, Z. X. Li, S. Q. Zang, Y. Y. Zhu, H. Y. Zhang, H. W. Hou and T. C. Mak, Org. Lett., 2012, 14, 1214 CrossRef CAS PubMed.
- K. Hanaoka, K. Kikuchi, H. Kojima, Y. Urano and T. Nagano, J. Am. Chem. Soc., 2004, 126, 12470–12476 CrossRef CAS PubMed.
- A. Ding, F. Tang, T. Wang, X. Tao and J. Yang, J. Chem. Sci., 2015, 127, 375–382 CrossRef CAS.
- A. Helal and H. S. Kim, Tetrahedron Lett., 2009, 50, 5510–5515 CrossRef CAS.
- O. David, S. Maisonneuve and J. Xie, Tetrahedron Lett., 2007, 48, 6527–6530 CrossRef CAS.
- S. Yin, J. Zhang, H. Feng, Z. Zhao, L. Xu, H. Qiu and B. Tang, Dyes Pigm., 2012, 95, 174–179 CrossRef CAS.
- S. Lee, J. H. Lee, T. Pradhan, S. L. Chang, B. R. Cho, S. Bhuniya, S. Kim and J. S. Kim, Sens. Actuators, B, 2011, 160, 1489–1493 CrossRef CAS.
- S. A. El-Safty, M. Khairy and M. Ismael, Sens. Actuators, B, 2012, 166–167, 253–263 CrossRef CAS.
- W. Li, Z. Nie, K. He, X. Xu, Y. Li, Y. Huang and S. Yao, Chem. Commun., 2011, 47, 4412–4414 RSC.
- Z. Xu, G.-H. Kim, S. J. Han, M. J. Jou, C. Lee, I. Shin and J. Yoon, Tetrahedron, 2009, 65, 2307–2312 CrossRef CAS.
- S. Lee, Y.-S. Nam, Ho-J. Lee, Y. Lee and K.-B. Lee, Sens. Actuators, B, 2016, 237, 643–651 CrossRef CAS.
- Z. Li, M. Yu and L. Zhang, et al., Chem. Commun., 2010, 46, 7169–7171 RSC.
- A. E. Lee, M. R. Grace, A. G. Meyer and K. L. Tuck, Tetrahedron Lett., 2010, 51, 1161–1165 CrossRef CAS.
- M. Li, H. Lu, R. Liu, J. Chen and C. Chen, J. Org. Chem., 2012, 77, 3670–3673 CrossRef CAS PubMed.
- Y. Ding, Y. Xie, X. Li, J. P. Hill, W. Zhang and W. Zhu, Chem. Commun., 2011, 47, 5431–5433 RSC.
- (a) A. Ghorai, J. Mondal and G. K. Patra, New J. Chem., 2016, 40, 7821–7830 RSC; (b) A. K. Manna, J. Mondal, K. Rout and G. K. Patra, J. Photochem. Photobiol., A, 2018, 367, 74 CrossRef CAS.
- (a) K. Rout, A. K. Manna, M. Sahu and G. K. Patra, Inorg. Chim. Acta, 2019, 486, 733–741 CrossRef CAS; (b) G. K. Patra, R. Chandra, A. Ghorai and K. K. Shrivas, Inorg. Chim. Acta, 2017, 462, 315–322 CrossRef CAS.
- SMART & SAINT Software Reference manuals, version 5.0, Bruker AXS Inc., Madison, WI, 1998 Search PubMed.
- T. Gruene, H. W. Hahn, A. V. Luebben, F. Meilleur and G. M. Sheldrick, J. Appl. Crystallogr., 2014, 47, 462 CrossRef CAS PubMed.
- (a) L. J. Farrugia, WinGX: An Integrated System of Windows Programs for the Solution, Refinement and Analysis for Single Crystal X-ray Diffraction Data, version 1.80.01, Department of Chemistry: University of Glasgow, 2003 Search PubMed; (b) L. J. Farrugia, WinGX suite for small-molecule single-crystal crystallography, J. Appl. Crystallogr., 1999, 32, 837 CrossRef CAS.
- S. Ganguli, M. K. Panigrahi, P. Singh and P. K. Shukla, One-pot synthesis of novel quinazoline derivatives and their antimicrobial activity, Int. J. Pharm. Pharm. Sci., 2012, 4, 434 CAS.
- A. K. Manna, S. Chowdhury and G. K. Patra, Dalton Trans., 2019, 48, 12336–12348 RSC.
- M. J. Frisch, G. W. Trucks, H. B. Schlegel, G. E. Scuseria, M. A. Robb, J. R. Cheeseman, G. Scalmani, V. Barone, B. Mennucci, G. A. Petersson, H. Nakatsuji, M. Caricato, X. Li, H. P. Hratchian, A. F. Izmaylov, J. Bloino, G. Zheng, J. L. Sonnenberg, M. Hada, M. Ehara, K. Toyota, R. Fukuda, J. Hasegawa, M. Ishida, T. Nakajima, Y. Honda, O. Kitao, H. Nakai, T. Vreven, J. A. Montgomery Jr, J. E. Peralta, F. Ogliaro, M. Bearpark, J. J. Heyd, E. Brothers, K. N. Kudin, V. N. Staroverov, R. Kobayashi, J. Normand, K. Raghavachari, A. Rendell, J. C. Burant, S. S. Iyengar, J. Tomasi, M. Cossi, N. Rega, J. M. Millam, M. Klene, J. E. Knox, J. B. Cross, V. Bakken, C. Adamo, J. Jaramillo, R. Gomperts, R. E. Stratmann, O. Yazyev, A. J. Austin, R. Cammi, C. Pomelli, J. W. Ochterski, R. L. Martin, K. Morokuma, V. G. Zakrzewski, G. A. Voth, P. Salvador, J. J. Dannenberg, S. Dapprich, A. D. Daniels, Ö. Farkas, J. B. Foresman, J. V. Ortiz, J. Cioslowski and D. J. Fox, Gaussian 09, Revision C.01, GaussianInc., Wallingford, CT, 2009 Search PubMed.
- (a) A. D. Becke, J. Chem. Phys., 1993, 98, 5648 CrossRef CAS; (b) C. Lee, W. Yang and R. G. Parr, Phys. Rev. B: Condens. Matter Mater. Phys., 1988, 37, 785 CrossRef CAS PubMed.
- M. K. Goshisht, G. K. Patra and N. Tripathi, Mater. Adv., 2022, 3, 2612 RSC.
- V. K. Gupta, A. K. Singh, L. K. Kumawat and N. Mergu, Sens. Actuators, B, 2016, 222, 468 CrossRef CAS.
- Y. Wang, C. Xi, Z. Han, Y. Jiao, X. Yao, Z. Lun, S. Fu, H. Zhang, P. Hou and D. Ning, J. Photochem. Photobiol., B, 2019, 199, 111602 CrossRef CAS PubMed.
- J. H. Kang and C. Kim, Photochem. Photobiol. Sci., 2018, 17, 442 CrossRef CAS PubMed.
- C. A. S. Pothulapadu, A. Jayaraj, N. Swathi, R. N. Priyanka and G. Sivaraman, ACS Omega, 2021, 6, 24473 CrossRef CAS PubMed.
- V. Kumar, D. Singh, P. Kumar, G. Chaudhary, A. P. Singh and R. Gupta, J. Mol. Struct., 2022, 1261, 132901 CrossRef CAS.
Footnote |
| † Electronic supplementary information (ESI) available: Contains the supplementary crystallographic data for the Ni2+ complex 3. Supplementary data containing Fig. S1–S12 and Tables S1 and S2 of this article. CCDC 2205292. For ESI and crystallographic data in CIF or other electronic format see DOI: https://doi.org/10.1039/d2ra05564c |
| This journal is © The Royal Society of Chemistry 2022 |

