 Open Access Article
Creative Commons Attribution 3.0 Unported Licence
Synthesis, characterization, antitumor potential, and investigation of mechanism of action of copper(II) complexes with acylpyruvates as ligands: interactions with biomolecules and kinetic study†
Nenad Joksimović *a,
Jelena Petronijevića,
Snežana Radisavljevića,
Biljana Petrović
 a,
Kristina Mihajlovića,
Nenad Janković
 b,
Emilija Milovićb,
Dušan Milivojevićc,
Bojana Ilić
 d and
Ana Djurić*e
aUniversity of Kragujevac, Faculty of Science, Department of Chemistry, Radoja Domanovića 12, 34000 Kragujevac, Serbia. E-mail: nenad.joksimovic@pmf.kg.ac.rs
bUniversity of Kragujevac, Institute for Information Technologies Kragujevac, Department of Sciences, Jovana Cvijića bb, 34000 Kragujevac, Serbia
cVinča Institute of Nuclear Science University of Belgrade, P.O. Box 522, 11001, Belgrade, Serbia
dClinic for Endocrinology, Diabetes and Metabolic Diseases, University Clinical Centre of Serbia, Belgrade, Serbia
eInstitute of Oncology and Radiology of Serbia, Pasterova 14, 11000 Belgrade, Serbia
First published on 26th October 2022
Abstract
Considering the urgency of finding a cure for vicious diseases such as tumors, we have synthesized and characterized a small series of new copper(II) complexes with biologically important ligands such as acylpyruvate. In addition to this, we used another four copper(II) complexes, with ligands of the same type to examine the antitumor potential. The antitumor potential of the copper(II) complexes was examined on three tumor cell lines and one normal human cell line using the MTT assay. All seven tested complexes showed very good cytotoxic effects. Two copper complexes that showed the best antitumor potential were selected for further testing that showed the best potential for potential application in the future. The mechanism of activity of these complexes was examined in detail using tests such as cell cycle, ROS level, oxidative DNA damage, and proteins related to hypoxia analysis. In addition, we examined the binding abilities of these complexes with biomolecules (Guo, Ino, 5′-GMP, BSA, and DNA). The results showed that the tested compounds bind strongly to DNA molecules through intercalation. Also, it has been shown that the tested compounds adequately bind to the BSA molecule, which indicates an even greater potential for some future application of these compounds in clinical practice.
Introduction
People have been struggling with many vicious and deadly diseases from ancient times for which there was no adequate cure. With the development of medical chemistry and science in general, we have discovered a large number of drugs for the treatment of these vicious diseases. However, even in the modern world, there are some difficult-to-treat and widespread diseases for which there is no adequate drug therapy. It can be freely said that cancer is one of those diseases and is one of the most common causes of death today. Therefore, research in this area is of great importance, and finding a cure for this vicious disease is vital to humanity.1–5 With the discovery of cisplatin, significant progress has been made in the struggle against various types of cancer.6 However, cisplatin is not an ideal drug due to several side effects such as nephrotoxicity, neurotoxicity, ototoxicity, and resistance to certain types of tumors.7–10 All this has forced the scientific community around the world to discover a new drug that would have a similar effect as cleavage but with fewer side effects. Numerous studies have been conducted with different strategies.11–15 One of the most important is the replacement of platinum metal ions with some other metal that shows less toxicity or, in an even better case, with some essential metal.16–18 Keeping in mind the previous and knowing that copper is an essential element with numerous biological functions in the human organism, as well as our previous experiences with copper compounds, we came up with the idea to examine the antitumor potential of a series of copper(II) complexes. A small series of new copper(II) complexes with biologically significant ligands such as acylpyruvate (Fig. 1.) were synthesized for these studies. In addition to this, the same investigations were also performed on four copper(II) complexes, which we previously synthesized with ligands of the same type.19 All complexes were tested on four cell lines. A mechanism of antitumor activity was performed and interactions with biomacromolecules such as deoxyribonucleic acid (DNA) and bovine serum albumin (BSA). Studies of the interaction of a molecule and DNA are crucial for its potential antitumor activity.20,21 In addition, although a potential drug exhibits exceptional biological potential, it is important to examine its binding capacity for transport proteins such as serum albumins.22,23 One of the prominent roles of bovine serum albumin is the transport of endogenous and exogenous ligands and drugs in the bloodstream. Investigations of the binding capacity of a potential drug to BSA are very important because of the similar structure of this molecule to human serum albumin.Results and discussion
Chemistry
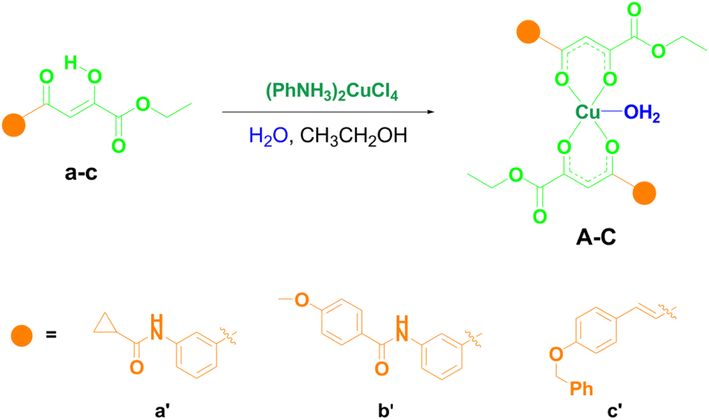
Three new copper(II) complexes were synthesized in a simple reaction between different substituted O,O-bidentate ligands acylpyruvates and (PhNH3)2CuCl4 in ethanol at room temperature by the procedure we described earlier.24 In terms of the functional groups, these specific structures of ligands were chosen for the investigations since some of its derivatives have shown good biological potential in some of our previous studies.19,24 The synthesis of novel copper(II) complexes A–C with acylpyruvates a–c is shown in Scheme 1. All ligands were previously synthesized.25 As can be seen, in the reaction between acylpyruvate a–c and (PhNH3)2CuCl4 in a ratio of 2![[thin space (1/6-em)]](https://www.rsc.org/images/entities/char_2009.gif) :
:![[thin space (1/6-em)]](https://www.rsc.org/images/entities/char_2009.gif) 1 we obtained three novel copper(II) complexes with square-pyramidal geometry, where the base of the pyramid is engaged by four oxygen from two acylpyruvate ligands. At the same time, the fifth coordination place is occupied by a molecule of water, the molecular geometry confirmed using X-ray diffraction and electron paramagnetic resonance analysis in our previous study.24 All the complexes were obtained in high yields.
1 we obtained three novel copper(II) complexes with square-pyramidal geometry, where the base of the pyramid is engaged by four oxygen from two acylpyruvate ligands. At the same time, the fifth coordination place is occupied by a molecule of water, the molecular geometry confirmed using X-ray diffraction and electron paramagnetic resonance analysis in our previous study.24 All the complexes were obtained in high yields.
The novel copper complexes were characterized using UV-vis, IR, EPR, and MS spectroscopy, and elemental analysis. The IR spectra of complexes A–C displayed bands near 1570 and 1510 cm−1 that correspond to v(C![[double bond, length as m-dash]](https://www.rsc.org/images/entities/char_e001.gif) C) (coupled with ν(C
C) (coupled with ν(C![[double bond, length as m-dash]](https://www.rsc.org/images/entities/char_e001.gif) O)) and ν(C
O)) and ν(C![[double bond, length as m-dash]](https://www.rsc.org/images/entities/char_e001.gif) O) (coupled with ν(C
O) (coupled with ν(C![[double bond, length as m-dash]](https://www.rsc.org/images/entities/char_e001.gif) C)), respectively. Therefore, in IR spectra of complexes, the v(C
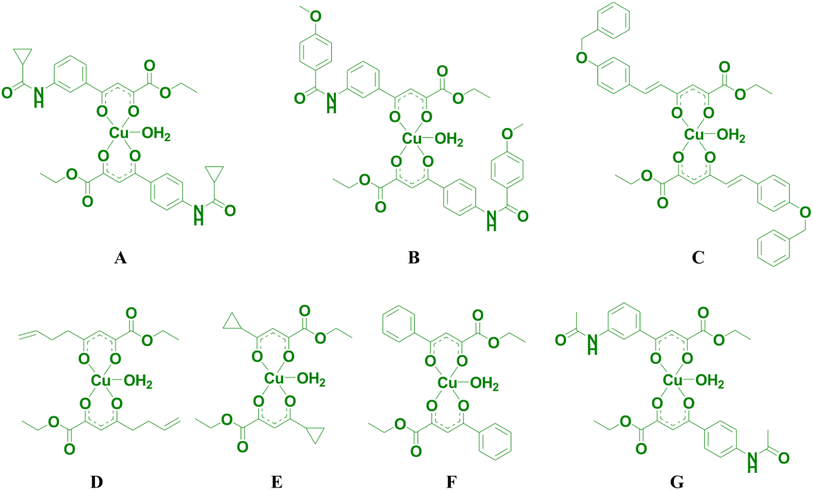
C)), respectively. Therefore, in IR spectra of complexes, the v(C![[double bond, length as m-dash]](https://www.rsc.org/images/entities/char_e001.gif) O) band is negatively shifted by approximately 15 cm−1, compared to the corresponding spectra of ligand. The presence of the bands near 1270 cm−1, which is intense, in the spectra of ligands a–c occurs due to bending O–H vibrations in the plane.26,27 The nonexistence of these bands in the spectra of complexes A–C is the consequence of the coordination of the ligands to copper(II) ions. Lastly, three novel A–C and four previously obtained copper(II) complexes D–G (ref. 19) (Fig. 2) were used to study their antitumor potential.
O) band is negatively shifted by approximately 15 cm−1, compared to the corresponding spectra of ligand. The presence of the bands near 1270 cm−1, which is intense, in the spectra of ligands a–c occurs due to bending O–H vibrations in the plane.26,27 The nonexistence of these bands in the spectra of complexes A–C is the consequence of the coordination of the ligands to copper(II) ions. Lastly, three novel A–C and four previously obtained copper(II) complexes D–G (ref. 19) (Fig. 2) were used to study their antitumor potential.
EPR study
Magnetic resonance techniques are very sensitive inner probes into the structure and properties of materials. g-Factor and the hyperfine interaction are very sensitive to the environment, coordination, and symmetry around Cu2+. Orbital (2L + 1) degeneracy is removed according to the symmetry formed by surrounding ligands. The spin–orbit interaction between the spin only orbital quenched ground state (E0) and the excited states (En) reintroduces a little orbital contribution and the g is anisotropic with values that deviate from 2.0023.19,28i = x, y, z, λ is the spin–orbit coupling constant, while k defines the degree of orbital mixing.
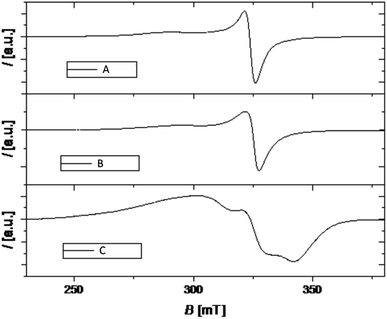
The g-factor reflects the nature of the ground state. For elongated octahedral, square pyramidal, or square planar the ground state is dx2−y2 orbital the EPR spectrum is axial and g‖ > g⊥ > ge is expected (g‖ = gz, g⊥ = gx = g). When the geometry is compressed octahedral or trigonal bipyramidal the ground state is dz2 and g⊥ > g‖ = ge is expected. In intermediate situations, a rhombic spectrum, gx > gy > gz, is expected. The EPR spectra of compounds A–C are presented in Fig. 3. For such complexes, a parameter R can indicate the predominance of the dz2 or dx2−y2 orbital. R = (gy − gz)/(gx − gy). If R > 1 (R < 1) the greater contribution to the ground state arises from the dz2 (dx2−y2).19,28
The values of g-tensor are presented in Table 1. The g values for samples A and B resemble relation g‖ > g⊥ > ge and since the coordination number of investigated complexes around Cu ion is five, we conclude that the geometry around Cu is square pyramidal.
| Sample | g1 | g2 | g3 |
|---|---|---|---|
| A | 2.076 | 2.079 | 2.36 |
| B | 2.068 | 2.069 | 2.34 |
| C | 1.97 | 2.08 | 2.33 |
Sample C shows noticeable rhombic symmetry but calculated R = 0.44 (<1) is indicative of dx2−y2 ground state and square pyramidal geometry.
Anticancer evaluation
The molecular structures of the copper(II) complexes (A–G) that are used for testing the anticancer potential are shown in Fig. 2. All the complexes are tested on one normal (human embryonic lung fibroblast (MRC-5)) and three cancer (human cervical adenocarcinoma (HeLa), human colon adenocarcinoma (LS174T), and human lung adenocarcinoma (A549)) cell lines.Cytotoxic activity
The seven copper complexes were assessed for cytotoxic activity (72 h of incubation), against one normal cell line (MRC-5) and three cancer cell lines (HeLa, LS174T, and A549) (Table 2). According to the obtained results compounds B, D, and F showed the most potent cytotoxic activity against all tested malignant cell lines. While compounds E and G showed significant reductive activities against A549 and MRC5 cell lines. For further biological assessment, compounds D and F were selected. We also examined the cytotoxic activity of chosen compounds, D and F, at 24 h of treatment, against HeLa cells. Our results have shown that the IC50 value for substance F decreases with the time of exposure, while IC50 values for substance D are similar at 24 h and 72 h treatment (Table 3).| Compounds | MRC5 IC50 (μM) | LS174T IC50 (μM) | A549 IC50 (μM) | HeLa IC50 (μM) |
|---|---|---|---|---|
| a IC50 values (μM) were expressed as the mean ± SD determined from the results of the MTT assay in three independent experiments. | ||||
| A | 86.65 ± 1.40 | >200 | 74.65 ± 8.84 | 182.17 ± 4.95 |
| B | 11.44 ± 1.8 | 19.61 ± 2.73 | 12.90 ± 1.24 | 15.24 ± 2.33 |
| C | 45.07 ± 1.79 | 47.00 ± 0.63 | 48.55 ± 2.65 | 46.37 ± 4.5 |
| D | 15.45 ± 2.70 | 35.55 ± 2.89 | 14.94 ± 1.96 | 17.86 ± 0.15 |
| E | 18.85 ± 1.11 | 39.95 ± 1.31 | 13.98 ± 3.17 | 26.79 ± 1.5 |
| F | 13.12 ± 2.64 | 22.93 ± 2.33 | 12.74 ± 1.82 | 15.41 ± 1.23 |
| G | 20.77 ± 3.5 | 24.98 ± 2.69 | 15.67 ± 0.23 | 36.12 ± 0.73 |
| cisPt | 9.35 ± 1.29 | 5.54 ± 1.03 | 13.21 ± 0.89 | 4.91 ± 0.74 |
| Compounds | HeLa IC50 (μM) |
|---|---|
| a IC50 values (μM) were expressed as the mean ± SD determined from the results of the MTT assay in three independent experiments. | |
| D | 15.41 ± 1.23 |
| F | 17.86 ± 0.15 |
By examining the dependence of the activity on the structure of the tested compounds, we came to the conclusions that the copper(II) complexes showed the best activity when the allyl or phenyl group was located on the acylpyruvate residue. Complexes with ligands that contained cyclopropyl, 3-acetamidophenyl or 3-(4-methoxybenzamido)phenyl groups in a row also showed good activity. The weakest activity was shown by complexes with ligands whose residues were 3-(cyclopropanecarboxamido)phenyl or 4-benzyloxystyryl groups.
Cell cycle analysis
The effect of selected newly synthesized substances on the cell cycle distribution was evaluated to better understand the mechanism of their cytotoxicity against HeLa cells. The distribution of HeLa cells (%) in different phases of the cell cycle treated with tested compounds is presented in Table 4. The results presented in Fig. 4 correspond to the distribution of the cell cycle of HeLa cells treated with compounds D and F (IC50 and 2IC50) for 24 h and 48 h. Assessment of the changes in the cell cycle of HeLa cells upon incubation with two doses, IC50 and 2IC50, of tested compounds (D and F) for 24 h and 48 h revealed that tested substances cause the increase in the percentage of HeLa cells in G2/M phase and the decrease in G1 phase, compared to control (untreated cells) (Fig. 4).| Cell cycle phase | Sub-G1 | G1 | S | G2/M |
|---|---|---|---|---|
| Treatment for 24 h | ||||
| CONTROL | 0.48 | 61.29 | 13.85 | 22.77 |
| D (IC50) | 0.72 | 53.69 | 16.01 | 28.11 |
| D (2IC50) | 0.86 | 49.63 | 15.58 | 31.73 |
| F (IC50) | 0.87 | 50.91 | 16.24 | 32.34 |
| F (2IC50) | 0.96 | 51.77 | 15.58 | 32.16 |
![[thin space (1/6-em)]](https://www.rsc.org/images/entities/char_2009.gif) |
||||
| Treatment for 48 h | ||||
| CONTROL | 2.05 | 65.40 | 11.58 | 21.31 |
| D (IC50) | 2.17 | 55.28 | 13.90 | 29.22 |
| D (2IC50) | 2.31 | 53.03 | 15.03 | 30.11 |
| F (IC50) | 2.08 | 50.44 | 12.93 | 35.03 |
| F (2IC50) | 3.70 | 43.34 | 15.06 | 38.32 |
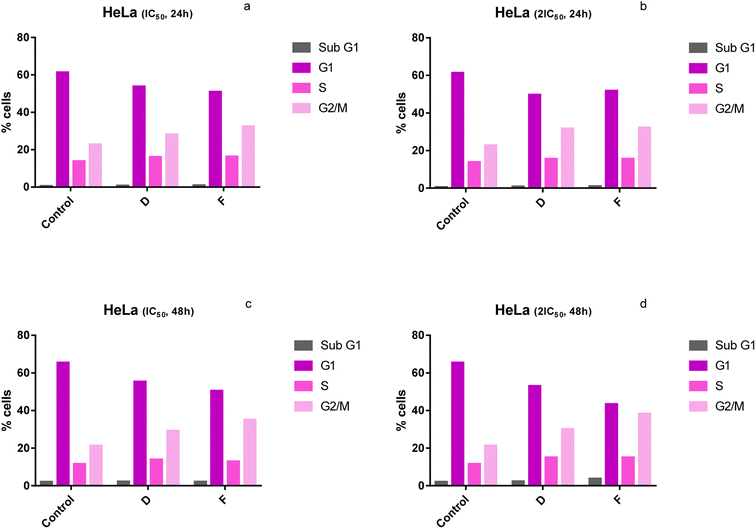 | ||
| Fig. 4 (a–d) Changes in the cell cycle of HeLa cells treated with tested compounds (concentrations correspond to IC50 and 2IC50) at 24 h and 48 h of treatment. | ||
Our results have demonstrated that after the 24 h-exposure to compounds D and F, the percentage of HeLa cells in the G1 phase was 50.4% and 55.3%, respectively, for IC50 51.8% and 53%, respectively, for 2IC50, compared to 61.3% (control) (Fig. 4a and b). While, for 48 h-exposure to compounds D and F the observed proportions of cells in the G1 phase were 50.4% and 55.3%, respectively, for IC50 and 43.3% and 53%, respectively, for 2IC50, compared to 65.4% (control) (Fig. 3c and d). We have shown that treatment with substances D and F caused a significant increase in the percentage of HeLa cells in the G2/M phase of the cell cycle (Fig. 4). After the treatment of 24 h to compounds D and F percentage of HeLa cells in the G2/M phase, phases were 32.4% and 28.1%, respectively, for IC50 and 32.2% and 31.7%, respectively, for 2IC50, compared to 22.8% (control) (Fig. 4a and b). While, after the 48 h-treatment of compounds D and F the observed concentrations of cells in the G2/M phase were 35% and 29.2%, respectively, for IC50 and 38.3% and 30.1%, respectively, for 2IC50, compared to 21.3% (control) (Fig. 4c and d).
Cell growth and division are precisely regulated by complex signaling pathways that affect the cell cycle to determine the cell's fate. Many different mechanisms influence the normal cell cycle. Cancer cells divide constantly and excessively thanks to cancer-related mutations that influence cell cycle control mainly by compromising the ability of cells to exit the cell cycle.29,30 Previous studies have revealed that many anti-cancer drugs have caused the arrest of the cell cycle at a certain phase.31 In the present study, the results indicate that tested compounds caused cell cycle arrest of HeLa cells at the G2/M phase. Therefore, tested newly synthesized copper compounds have the potential to achieve an anticancer effect. The cell cycle arrest at the G2/M phase indicates that DNA damage cannot be repaired and the cell undergoes apoptosis.32
Analyzes of ROS level
The endogenous ROS level in HeLa cells after 24 h-treatment with 2IC50 of compound D was reduced compared to ROS levels in the control group, while treatment with compound F did not change the ROS level in treated HeLa cells (Fig. 5).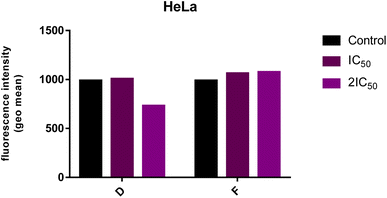 | ||
| Fig. 5 Level of endogenous ROS in the HeLa cells following the 24 h-exposure to tested compounds (IC50 and 2IC50). The intensity of fluorescence corresponds to the level of ROS. | ||
Elevated ROS levels are connected to several pathologic conditions, including cancer, and they are involved in different signaling pathways and the triggering of DNA mutations. One of the approaches in cancer treatment is based on lowering ROS levels in cancer cells. According to this therapeutic approach,33 compound D could achieve a potential anticancer effect by reducing the level of ROS in the treated malignant cells. This possibility should be further investigated.
For normal cell survival, maintaining the physiological concentration of ROS is necessary. Overproduction of ROS promotes cell proliferation and induces the malignant transformation of normal cells through different signaling pathways.33 Therefore, scavenging elevated ROS levels prevent the formation of early neoplasia.34 This is in line with the recent studies that have shown an increase in tumor development and metastasis in mouse models treated with vitamin E.35 On the other hand, abnormally ROS production specifically kills cancer cells, which also can be used as a promising anticancer therapeutic strategy.33
Analyzes of DNA damage
After 24 h treatment with subtoxic IC20 concentrations of selected compounds (D and F), the degree of DNA damage in HeLa cells was evaluated. Our results point out that exposure to compound F caused DNA damage, which is significantly higher compared to the values in the control group (untreated cells) (p < 0.001) (Fig. 6).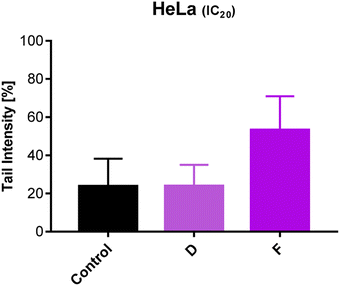 | ||
| Fig. 6 Effect of 24 h-treatment with tested compounds on DNA damage in HeLa cells using the Comet assay. | ||
Analyzes of western blot
The expression levels of PDK-3 and HIF-1α proteins (normalized to β-actin) in HeLa cells treated with compounds D and F, and untreated (control) HeLa cells are presented in Fig. 7 and 8. HeLa cells treated with compounds D and F at concentration IC50 demonstrated lower expression level of HIF-1α protein in comparison to HeLa cells treated with concentration IC20 and to control HeLa cells. Irrespective of treatment, HeLa cells similarly expressed PDK-3 protein. | ||
| Fig. 7 (a and b). Expression of HIF-1α and PDK-3 in HeLa cells after 24 h treatment with tested compounds (concentrations correspond to IC20 and IC50). | ||
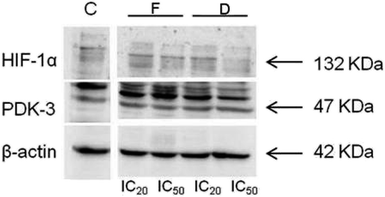 | ||
| Fig. 8 Immunoblots for HIF-1α, PDK-3, and β-actin of HeLa whole-cell lysates after 24 h treatment with tested compounds (concentrations correspond to IC20 and IC50). | ||
Binding properties of compounds D and F with bovine serum albumin
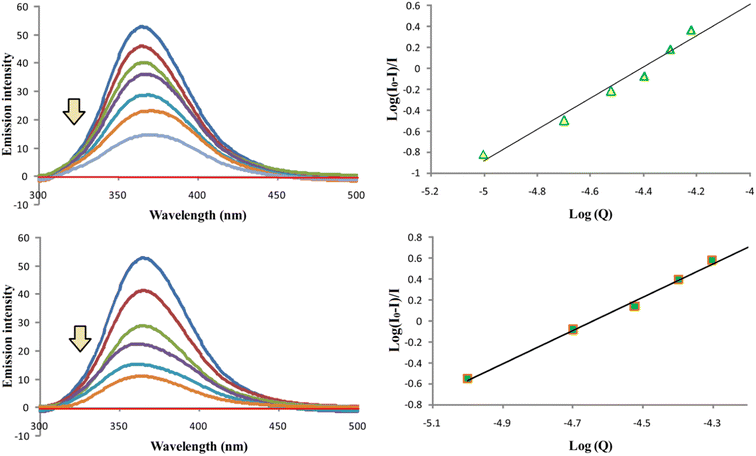
Compounds D and F were used to investigate the binding properties of these compounds to BSA. The fluorescent titration method was used for these investigations. All the measurements were done according to the previous procedure we used.36 We measured the fluorescence intensity of BSA in the absence (most intense blue line) and in the presence of compounds D and F (Fig. 9). The emission spectra are recorded in the wavelength range from 300 to 500 nm, while λex was set at 280 nm. The molar ratios of BSA with compound D followed orders: 1![[thin space (1/6-em)]](https://www.rsc.org/images/entities/char_2009.gif) :
:![[thin space (1/6-em)]](https://www.rsc.org/images/entities/char_2009.gif) 0 (control), 1
0 (control), 1![[thin space (1/6-em)]](https://www.rsc.org/images/entities/char_2009.gif) :
:![[thin space (1/6-em)]](https://www.rsc.org/images/entities/char_2009.gif) 0.5, 1
0.5, 1![[thin space (1/6-em)]](https://www.rsc.org/images/entities/char_2009.gif) :
:![[thin space (1/6-em)]](https://www.rsc.org/images/entities/char_2009.gif) 1, 1
1, 1![[thin space (1/6-em)]](https://www.rsc.org/images/entities/char_2009.gif) :
:![[thin space (1/6-em)]](https://www.rsc.org/images/entities/char_2009.gif) 1.5, 1
1.5, 1![[thin space (1/6-em)]](https://www.rsc.org/images/entities/char_2009.gif) :
:![[thin space (1/6-em)]](https://www.rsc.org/images/entities/char_2009.gif) 2, 1
2, 1![[thin space (1/6-em)]](https://www.rsc.org/images/entities/char_2009.gif) :
:![[thin space (1/6-em)]](https://www.rsc.org/images/entities/char_2009.gif) 2.5, and 1
2.5, and 1![[thin space (1/6-em)]](https://www.rsc.org/images/entities/char_2009.gif) :
:![[thin space (1/6-em)]](https://www.rsc.org/images/entities/char_2009.gif) 3, while for F followed orders: 1
3, while for F followed orders: 1![[thin space (1/6-em)]](https://www.rsc.org/images/entities/char_2009.gif) :
:![[thin space (1/6-em)]](https://www.rsc.org/images/entities/char_2009.gif) 0 (control), 1
0 (control), 1![[thin space (1/6-em)]](https://www.rsc.org/images/entities/char_2009.gif) :
:![[thin space (1/6-em)]](https://www.rsc.org/images/entities/char_2009.gif) 0.5, 1
0.5, 1![[thin space (1/6-em)]](https://www.rsc.org/images/entities/char_2009.gif) :
:![[thin space (1/6-em)]](https://www.rsc.org/images/entities/char_2009.gif) 1, 1
1, 1![[thin space (1/6-em)]](https://www.rsc.org/images/entities/char_2009.gif) :
:![[thin space (1/6-em)]](https://www.rsc.org/images/entities/char_2009.gif) 1.5, 1
1.5, 1![[thin space (1/6-em)]](https://www.rsc.org/images/entities/char_2009.gif) :
:![[thin space (1/6-em)]](https://www.rsc.org/images/entities/char_2009.gif) 2, and 1
2, and 1![[thin space (1/6-em)]](https://www.rsc.org/images/entities/char_2009.gif) :
:![[thin space (1/6-em)]](https://www.rsc.org/images/entities/char_2009.gif) 2.5. Based on the obtained results, it can be seen that fluorescence intensity of BSA decreases with increasing concentration of the compounds D and F, which occurs as a result of the formation of the BSA-D or F complex. Based on the obtained results, by observing the dependence of log(I0 − I)/I on log(Q) (Fig. 9), binding parameters were calculated. Where I0 is the fluorescence intensity of BSA in the absence of compounds D and F, I is the fluorescence intensity of BSA in the presence of compounds D and F, and Q is the concentration of compounds D and F. Based on the obtained linear dependence and the equation log(I0 − I/I) = log
2.5. Based on the obtained results, it can be seen that fluorescence intensity of BSA decreases with increasing concentration of the compounds D and F, which occurs as a result of the formation of the BSA-D or F complex. Based on the obtained results, by observing the dependence of log(I0 − I)/I on log(Q) (Fig. 9), binding parameters were calculated. Where I0 is the fluorescence intensity of BSA in the absence of compounds D and F, I is the fluorescence intensity of BSA in the presence of compounds D and F, and Q is the concentration of compounds D and F. Based on the obtained linear dependence and the equation log(I0 − I/I) = log![[thin space (1/6-em)]](https://www.rsc.org/images/entities/char_2009.gif) Ka + n
Ka + n![[thin space (1/6-em)]](https://www.rsc.org/images/entities/char_2009.gif) log[Q], we calculated the n and Ka binding parameters of compounds D and F to BSA, where n is the number of binding spots per BSA molecule, and Ka is the binding constant of the tested compounds to BSA. The obtained Ka and n values are shown in Table 5. Obtained Ka values are in line with the fact that our compounds have the appropriate capabilities for future use in clinical practice because they appropriately bind to BSA.37 On the other hand, the number n revealed that compounds D and F bind to BSA molecules in a 1.5
log[Q], we calculated the n and Ka binding parameters of compounds D and F to BSA, where n is the number of binding spots per BSA molecule, and Ka is the binding constant of the tested compounds to BSA. The obtained Ka and n values are shown in Table 5. Obtained Ka values are in line with the fact that our compounds have the appropriate capabilities for future use in clinical practice because they appropriately bind to BSA.37 On the other hand, the number n revealed that compounds D and F bind to BSA molecules in a 1.5![[thin space (1/6-em)]](https://www.rsc.org/images/entities/char_2009.gif) :
:![[thin space (1/6-em)]](https://www.rsc.org/images/entities/char_2009.gif) 1 molar ratio.
1 molar ratio.
| Compound | Ka [M−1] | n | R |
|---|---|---|---|
| D | (3.8 ± 0.2) × 106 | 1.5 | 0.986 |
| F | (5.2 ± 0.2) × 106 | 1.5 | 0.997 |
Investigations of binding properties of compound F with DNA
The fluorescent titration method, a very accurate and reliable method, was used to investigate the interactions of compound F that showed the best antitumor activity with DNA. For these studies, we used ethidium bromide (EB), one of the most commonly used intercalators for interactions of this type.38 The fluorescence intensities of the EB–DNA complex in were measured in the absence of compound F (the most intense blue line) and in the presence of the tested compound (Fig. 10). Fluorescence intensities were observed at wavelengths from 550 to 750 nm, and λex was set at 500 nm. Investigations have shown that with increasing concentration of compound F, the fluorescence intensity of the EB–DNA complex decreases. In addition, the maximum wavelength of the EB–DNA at 609 nm was red-shifted. Based on the above, it can be concluded that compound F partially substitutes EB from the EB–DNA complex and interacts with DNA via intercalation. Further, by examining the dependence of I0/I on the concentration Q of the compound and using the Stern–Volmer equation,38 some binding parameters of compound F for DNA were calculated, such as Ksv and kq (Table 6). I0 is the fluorescence intensity of EB–DNA in the absence of compound F, I is the fluorescence intensity of EB–DNA in the presence of compound F, Q is the concentration of compound F, Ksv is the Stern–Volmer constant and kq is the bimolecular quenching rate constant. The obtained Ksv constant of 7.3 × 10³ shows that the compound binds strongly to DNA molecules through intercalation.39| Compound | kq [M−1 s−1] | Ksv [M−1] | R |
|---|---|---|---|
| F | (7.3 ± 0.1) × 1011 | (7.3 ± 0.1) × 103 | 0.993 |
Kinetic measurements for compound F
It is already known that the copper(II) ion belongs to the group of “borderline” Lewis acid, so it has a high affinity to bind with nitrogen-, oxygen- and sulfur donors, depending on the coordination number. The presence of different mono-, bi-, tri-, or tetradentate inert ligands in the structure of copper(II) complexes has a huge effect on their substitution reactions. Also, the nature of the leaving group is strongly connected with the substitution rate.40,41 This work is focused on the following substitution reactions between copper(II) complex and biomolecules such as Guo, Ino, or 5′-GMP. The aim is to reveal the complex's capability to react with nucleophiles, especially with 5′-GMP, which is the constituent of DNA (due to the fact that this complex can bind to DNA with DNA-binding constant Kb = 7.3 × 10³).Substitution reactions of five-coordinate copper(II) complex with nucleophiles (Guo, Ino, or 5′-GMP) were very fast to be followed by conventional spectrophotometry (Fig. 11). So, these reactions were studied by the “stopped-flow” technique, mixing the same volumes of complex and nucleophile solutions directly in the instrument. To achieve the pseudo-first-order conditions for all experiments, the concentration of the nucleophiles was always at least 10-fold excess. All reactions were finished within 10 seconds. Observed kinetics data confirmed the reversible reaction pathway of the substitution (Scheme 2), where k1 is the rate constant for direct, while k−1 is the rate constant for the reversible reaction:
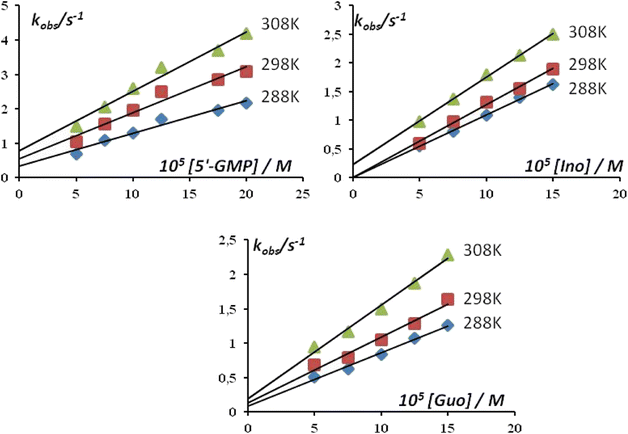 | ||
| Fig. 11 Pseudo-first-order rate constant kobs as a function of nucleophile concentration and temperature for the substitution reactions in Hepes buffer (pH = 7.2, 25 mM Hepes). | ||
The pseudo-first-order rate constant, kobs, was calculated as an average value of six or seven independent kinetic runs (all data are given in Table S1, ESI†). The linear dependence of the pseudo-first-order rate constants as a function of the nucleophile concentration enables the calculation of the corresponding rate constants k1 and k−1, by eqn (1):
| kobs = k1[Nu] + k−1 | (1) |
Activation parameters (activation entropy – ΔS≠ and activation enthalpy – ΔH≠) are obtained by Eyring eqn (2) and presented in Table 7:
 | (2) |
| Nu | λ (nm) | T (K) | k1 × 104 M−1 s−1 | k−1 s−1 | ΔH≠ kJ mol−1 | ΔS≠ JK−1 mol−1 |
|---|---|---|---|---|---|---|
| 5′-GMP | 253 | 288 | 1.19 ± 0.10 | 0.13 ± 0.07 | 19 ± 3 | −116 ± 9 |
| 298 | 1.68 ± 0.03 | 0.28 ± 0.10 | ||||
| 308 | 2.17 ± 0.04 | 0.43 ± 0.05 | ||||
| Guo | 252 | 288 | 0.43 ± 0.08 | 0.41 ± 0.06 | 16 ± 2 | −133 ± 7 |
| 298 | 0.53 ± 0.05 | 0.53 ± 0.03 | ||||
| 308 | 0.75 ± 0.02 | 0.75 ± 0.04 | ||||
| Ino | 248 | 288 | 1.09 ± 0.03 | 0.23 ± 0.02 | 9 ± 1 | −151 ± 2 |
| 298 | 1.26 ± 0.04 | 0.04 ± 0.03 | ||||
| 308 | 1.52 ± 0.04 | 0.06 ± 0.01 |
The lability of some copper(II) complexes is already known,42–44 considering that the water exchange constant for [Cu(H2O)6]2+ has a value of ∼109.45 This characteristic is connected with the octahedral geometry of copper(II) complexes. The mechanism of this substitution process was confirmed as dissociative (D) or Id mechanism.45
However, substitution reactions of copper(II) complexes with square-pyramidal or trigonal-bipyramidal structures were also studied, and the obtained rate constants were in the range of 104–106.45,46
According to the values obtained within this investigation (∼104), copper(II) complex F is more reactive in comparison with square-planar [CuCl2(en)] or square-pyramidal [CuCl2(terpy)].41 The obtained order of reactivity of the nucleophiles is 5′-GMP > Ino > Guo. Namely, it is well known that the rate of nucleophilic substitution depends on the structure of the entering nucleophiles. Also, the coordination of these nucleophiles occurs via a nucleophilic attack on the N7 donor atom of the purine base. The higher reactivity of the nucleotide (5′-GMP) than nucleosides (Ino, Guo) can be explained by the presence of the electronic interactions confirming that the primary process involves partial pre-association of the metal complex with phosphate group in 5′-GMP.47
Therefore, substitution reactions were followed at three different temperatures in order to get insight into the mechanism of substitution. Since the values of the activation entropy for all reactions are negative (Fig. S1, ESI†), it can be concluded that the processes of substitution undergo via associative (A) or Ia mechanism, as published earlier.45,46
Conclusion
A small series of newly synthesized and another small series of copper(II) complexes that we synthesized earlier were used to examine the antitumor potential. The anticancer potential of copper complexes was tested in vitro against three tumor cell lines (HeLa, A549, and LS174T) and one normal cell line(MRC-5) using the MTT test. Importantly, after this test for the most active compounds, the mechanism of cytotoxic activity was examined in detail. In these tests, compounds B, D, and F showed the most potent cytotoxic activity against all tested malignant cell lines, while E and G showed significant reductive activities against A549 and MRC5 cell lines. Cell cycle analysis tests revealed that compounds D and F cause the increase in the percentage of HeLa cells in G2/M phases and the decrease in the G1 phase compared to untreated cells (control). The ROS level analysis revealed that compound D could achieve a potential anticancer effect by reducing ROS levels in the treated malignant cells. The DNA damage analysis showed that exposure to compound F caused DNA damage, which is significantly higher than the control group values (untreated cells). Analyzes of proteins related to hypoxia have shown that HeLa cells treated with compounds D and F decrease the expression of HIF-1α in a dose-dependent manner, suggesting their role as potential anticancer agents. Further investigations revealed that the obtained Ka values of BSA-D or F complexes are in line with the fact that our compounds have the appropriate capabilities for future use in clinical practice because they properly bind to BSA. Fluorescence quenching study of compound F with DNA indicated that the tested compound partially substitutes EB from the EB–DNA complex and interacts with DNA via intercalation, while obtained Ksv constant showed that the tested compound binds relatively strongly to DNA molecule. Kinetic investigations showed the best reactivity of 5′-GMP in comparison with Ino or Guo, which is connected with the phosphate group on that nucleophile, while the mechanism of substitution can be described as associative.Experimental section
Materials
Inosine (Ino) and 2-[4-(2-hydroxyethyl)piperazin-1-yl]ethane-sulfonic acid (Hepes buffer) were ordered from Acros Organics. All the other used solvents and substrates were ordered from Sigma. The melting points (Mp) of the new compounds were calculated on a Mel-Temp apparatus and were not corrected. The IR spectra of novel compounds were recorded using PerkinElmer Spectrum One FT-IR spectrometer on a KBr pellet. Mass spectrometry is done using a Waters Micromass Quattro II triple quadrupole mass spectrometer and MassLynx software. Microanalyses of C, H, and N were performed on CarloErba EA1108. Fluorescence data were obtained using an RF-1501 PC spectrofluorometer (Shimadzu, Japan).Synthesis of copper(II) complexes A, B and C
All novel copper(II) complexes are synthesized in accordance with the previously published procedure.24Cell lines
To evaluate the cytotoxic potential of copper complexes we conducted an experiment on one normal, human embryonic lung fibroblast (MRC-5) cell line and three cancer cell lines: human cervical adenocarcinoma (HeLa), human lung adenocarcinoma (A549) and human colon adenocarcinoma (LS174T). Standard conditions RPMI-1640 medium supplemented with 3 mM L-glutamine, 100 μg per mL streptomycin, 100 IU per mL penicillin, 10% heat-inactivated (56 °C) fetal bovine serum, and 25 mM Hepes adjusted to pH 7.2 with a bicarbonate solution, the temperature of 37 °C, the atmosphere of 5% CO2 and humidified air were used for cell grow cells. Cells were purchased from the American Type Culture Collection (Manassas, VA, USA), while RPMI 1640, L-glutamine, and Hepes were purchased from PAA (Pasching, Austria).MTT assay for cell viability
To assess the effect of the tested copper complexes on cell viability, we conducted the MTT assay (3-(4,5-dimethylthiazol-2-yl)-2,5-diphenyltetrazolium bromide – MTT), previously described by Mosmann48 and modified by Mitsuharu and Abe.49 This reductive assay is based on the reduction of yellow tetrazole, MTT, to purple formazan crystals by cellular reducing agents, which corresponds to cell viability. The formazan concentration in the cells correlates to the degree of light absorption.Cells were seeded in 96-well plates at: 3000 cells per well for HeLa, 5000 cells per well for MRC-5 and A549, and 7000 cells per well for LS174T. After 24 h, cells were treated with five different concentrations of the tested complexes. After 72 h of incubation, 20 μL of MTT solution (5 mg mL−1 of phosphate-buffered saline, PBS) was added, and samples were further incubated for an additional 4 h at 37 °C in a humidified atmosphere of 5% CO2 (v/v). Then, 100 mL of 100 g L−1 sodium dodecyl sulfate (SDS) was added. On the next day, 24 h later the absorbance (A) was measured at 570 nm, 24 h later.
The concentration of the complexes that inhibits cell survival by 50% compared to the control corresponds to the obtained IC50 value. All experiments were performed in triplicates.
Cell cycle analysis by flow cytometry
For cell cycle analysis, HeLa cells were treated with copper complexes for 24 h and 48 h (in concentrations IC50 and 2IC50). After the incubation, the cells were collected, washed with PBS, and fixed in 70% ethanol, as described in the previously described protocol.50 Collected samples were stored at −20 °C for at least one week before staining. After one week, HeLa cells were defrosted, collected by centrifugation, washed and resuspended in PBS containing RNase A, and incubated for 30 min at 37 °C. Then, the staining of cells was performed with propidium iodide. The evaluation of the cell cycle of treated HeLa cells was done using a BD FACS Calibur flow cytometer and CELL Quest software.Evaluation of ROS production
The level of ROS in treated HeLa cells was observed after 24 h of incubation with subtoxic IC20 concentrations of tested copper complexes. According to the previously described method, upon the treatment, cells were collected, washed with PBS, and incubated with 2′,7′-dichlorodihydrofluorescein diacetate (30 μM in PBS) for 45 min at 37 °C. Afterward, cells were rewashed with PBS and analyzed.51 The fluorescence intensity emitted by the dichlorofluorescein was determined on a BD FACS Calibur flow cytometer and analyzed using CELLQuest software.Evaluation of DNA damage by Comet assay
The cells were treated with IC20 concentrations of selected copper complexes for 24 h. Then, the cells were collected, washed with PBS, suspended in a freezing medium (RPMI with 10% DMSO and 20% FCS), and frozen at −80 °C. We have evaluated DNA damage by the previously described version of the single-cell gel electrophoresis assay.52 Frozen cells were thawed by the addition of 1 mL of PBS to an aliquot of 0.5 mL and centrifuged for 10 min at 2000 rpm at 4 °C. The washing procedure was repeated with a pellet. The concentration of cells was adjusted to 2.5 × 10⁵ per mL with PBS and 30 μL of cell suspension was mixed with 140 μL of 1% LMP agarose at 37 °C. Then, 10 μL of agarose-cell suspension was placed on an NMP agarose-coated slide. Then, cells were lysed for 1 h at 4 °C with a buffer containing: 2.5 M NaCl, 0.1 M Na2EDTA, and 10 mM Tris with 1% Triton X-100 pH 10. Subsequently, horizontal gel electrophoresis at a voltage gradient of 1 V cm−1 across the platform at 4 °C was performed in a proper solution (0.3 M NaOH, 0.001 M Na2EDTA) (20 min incubation and 30 min of electrophoresis). Neutralization of the slides was done by washing them for 10 min in PBS at 4 °C. Then, they were fixed with 70% ethanol for 10 minutes, incubate for 10 min in absolute ethanol, and stained with SYBR Gold (Invitrogen) for 30 min in the dark. Stained slides were washed twice with water and dried in the dark. Scoring of the comets was carried out using a semi-automated image analysis system (Comet Assay IV; Perceptive Instruments). Fifty nucleoids per gel were analyzed, and the results were expressed as a percentage of tail intensity (% of DNA in the tail).Evaluation of HIF-1α and PDK-3 expression by western blot
Human cervical carcinoma cells were seeded at a density of 0.5 × 10⁶ cells per well onto six-well plates and incubated at 37 °C for 24 h and treated with copper complexes (concentrations of IC50 and IC20). After 24 h treatment, cells were washed three times with ice-cold PBS, collected, and centrifuged at 3000 rpm for 5 min. Then cells were resuspended in RIPA buffer supplemented with cOmplete™, EDTA-free Protease Inhibitor Cocktails, and incubated on ice for one hour. Afterward, cells were sonicated (three cycles: 10 s of sonication followed by cooling for 30 s), and whole-cell lysates were put on ice for one hour and centrifuged at 11![[thin space (1/6-em)]](https://www.rsc.org/images/entities/char_2009.gif) 000 rpm for 20 min, at 4 °C. Then, supernatants were collected and protein concentrations were determined with the BCA protein assay kit (Thermo Fisher Scientific, Waltham, Massachusetts, USA). Extracted proteins were mixed with loading buffer, denatured for 10 min at 90 °C, loaded into 10% Tris-Glycine gels, and separated by the standard SDS-PAGE. After separation, proteins were transferred to nitrocellulose membranes, and membranes were blocked with 5% nonfat milk in TBST buffer containing 0, 1% Tween 20 for one hour at room temperature. An overnight incubation followed, at 4 °C in primary antibody [anti – PDK3 (1
000 rpm for 20 min, at 4 °C. Then, supernatants were collected and protein concentrations were determined with the BCA protein assay kit (Thermo Fisher Scientific, Waltham, Massachusetts, USA). Extracted proteins were mixed with loading buffer, denatured for 10 min at 90 °C, loaded into 10% Tris-Glycine gels, and separated by the standard SDS-PAGE. After separation, proteins were transferred to nitrocellulose membranes, and membranes were blocked with 5% nonfat milk in TBST buffer containing 0, 1% Tween 20 for one hour at room temperature. An overnight incubation followed, at 4 °C in primary antibody [anti – PDK3 (1![[thin space (1/6-em)]](https://www.rsc.org/images/entities/char_2009.gif) :
:![[thin space (1/6-em)]](https://www.rsc.org/images/entities/char_2009.gif) 1000, ab 154549, Abcam, Cambridge, UK); anti – HIF-1α (1
1000, ab 154549, Abcam, Cambridge, UK); anti – HIF-1α (1![[thin space (1/6-em)]](https://www.rsc.org/images/entities/char_2009.gif) :
:![[thin space (1/6-em)]](https://www.rsc.org/images/entities/char_2009.gif) 300, sc – Santa Cruze Biotechnology, Heidelberg, Germany); anti – β-actin (1
300, sc – Santa Cruze Biotechnology, Heidelberg, Germany); anti – β-actin (1![[thin space (1/6-em)]](https://www.rsc.org/images/entities/char_2009.gif) :
:![[thin space (1/6-em)]](https://www.rsc.org/images/entities/char_2009.gif) 1000, ab 3280, Abcam, Cambridge, UK)]. Afterward, membranes were rinsed three times for 10 with PBST buffer, and incubated with appropriate HRP-conjugated secondary anti-rabbit or anti-mouse antibody (Lumi – lightPLUS western blotting kit, Roche Applied Science, Penzberg, Germany) for 1 hour at room temperature and washed again in TBST buffer. Visualization was performed by chemiluminescence (Lumi – lightPLUS western blotting kit, Roche Applied Science, Penzberg, Germany) with ChemiDoc Imaging System (BioRad, Hercules, CA, USA). The intensities of immunoreactive bands were determined using Image Lab 6.0.1. software (BioRad, Hercules, CA, USA). Protein loading was normalized to β-actin.
1000, ab 3280, Abcam, Cambridge, UK)]. Afterward, membranes were rinsed three times for 10 with PBST buffer, and incubated with appropriate HRP-conjugated secondary anti-rabbit or anti-mouse antibody (Lumi – lightPLUS western blotting kit, Roche Applied Science, Penzberg, Germany) for 1 hour at room temperature and washed again in TBST buffer. Visualization was performed by chemiluminescence (Lumi – lightPLUS western blotting kit, Roche Applied Science, Penzberg, Germany) with ChemiDoc Imaging System (BioRad, Hercules, CA, USA). The intensities of immunoreactive bands were determined using Image Lab 6.0.1. software (BioRad, Hercules, CA, USA). Protein loading was normalized to β-actin.
Kinetic measurements
In order to find the appropriate wavelength at which kinetic experiments can be performed, UV-vis spectra of the mixture of complex and nucleophile solutions were recorded in the range between 200–600 nm. Working wavelength is described as a wavelength that displays the highest change in the absorbance during time. The values of the working wavelengths are given in Table 7. The same volumes of the solutions of copper(II) complex (concentration 0.01 mM in 25 mM Hepes buffer) and the nucleophile (Guo, Ino or 5′-GMP, concentration in the range 0.05–0.2 mM in 25 mM Hepes buffer) were mixed directly in “stopped-flow” instrument and the interactions were followed within 10 seconds. The pseudo-first-order rate constants, kobs, were obtained by monitoring the absorbance changes with time at working wavelength, like the average value of six or seven independent kinetic runs. Kinetic traces are given in Fig. S2, ESI.† The substitution reactions were followed at three different temperatures (288, 298, or 308 K) to determine the substitution mechanism. The computational programs Pro Data SX, OriginPro 2016, and Microsoft Excel 2007 were used to get calculations.Conflicts of interest
There are no conflicts to declare.Acknowledgements
The authors thank the Ministry of Education, Science and Technological Development of the Republic of Serbia (Agreements No. 451-03-68/2022-14/200122 and 451-03-68/2022-14/200378 and Project No. 451-03-68/2022-14/200043). The authors want to thank dr Danijela Karanovic and dr Nevena Mihajlovic-Stanojevic from Institute for Medical Research for their technical support with ChemiDoc Imaging System (Bio-Rad). The authors also want to thank Sanja Rackov from University of Novi Sad for ATR measurements. This contribution is based upon work from COST Action CA18202, NECTAR − Network for Equilibria and Chemical Thermodynamics Advanced Research, supported by COST (European Cooperation in Science and Technology).References
- M. K. Islam, A.-R. Baek, B. Sung, B.-W. Yang, G. Choi, H.-J. Park, Y.-H. Kim, M. Kim, S. Ha, G.-H. Lee, H.-K. Kim and Y. Chang, Pharmaceuticals, 2021, 14, 832 CrossRef CAS PubMed.
- M. Mohamadzadeh and M. Zarei, Mol. Diversity, 2021, 25, 2429 CrossRef CAS PubMed.
- L. He, Y. Li, P. C. Tan, R. R. Ye, H. M. Chen, J. J. Cao, N. L. Ji and W. Z. Mao, Chem. Sci., 2015, 6, 5409 RSC.
- T. Lazarević, A. Rilak and Ž. D. Bugarčić, Eur. J. Med. Chem., 2017, 142, 8 CrossRef PubMed.
- A. Lauria, G. La Monica, A. Bono and A. Martorana, Eur. J. Med. Chem., 2021, 220, 113555 CrossRef CAS PubMed.
- B. Desoize and C. Madoulet, Crit. Rev. Oncol. Hematol., 2002, 42, 317 CrossRef PubMed.
- J. Sastry and S. J. Kellie, Pediatr. Hematol. Oncol., 2005, 22, 441 CrossRef CAS PubMed.
- I. Ott and R. Gust, Arch. Pharm., 2007, 340, 117 CrossRef CAS PubMed.
- S. R. McWhinney, R. M. Goldberg and H. L. McLeod, Mol. Cancer Ther., 2009, 8, 10–16 CrossRef CAS PubMed.
- R. P. Miller, R. K. Tadagavadi, G. Ramesh and W. B. Reeves, Toxins, 2010, 2, 2490 CrossRef CAS PubMed.
- N. Joksimović, N. Janković, G. Davidović and Z. Bugarčić, Bioorg. Chem., 2020, 105, 104343 CrossRef PubMed.
- M. Hanif and C. G. Hartinger, Future Med. Chem., 2018, 10, 615 CrossRef CAS PubMed.
- D. Lazić, N. A. Arsenijević, R. Puchta, D. Ž. Bugarčić and A. Rilak, Dalton Trans., 2016, 45, 4633 RSC.
- P. Mowery, F. Banales Mejia, C. L. Franceschi, M. H. Kean, D. O. Kwansare, M. M. Lafferty, N. D. Neerukonda, C. E. Rolph, N. J. Truax and E. T. Pelkey, Bioorg. Med. Chem. Lett., 2016, 27, 191 CrossRef PubMed.
- E. Abás, D. Aguirre-Ramírez, M. Laguna and L. Grasa, Biomedicines, 2021, 9, 1775 CrossRef PubMed.
- S. H. van Rijt and P. J. Sadler, Drug Discovery Today, 2009, 14, 1089 CrossRef CAS PubMed.
- A. Gurba, P. Taciak, M. Sacharczuk, I. Młynarczuk-Biały, M. Bujalska-Zadrożny and J. Fichna, Int. J. Mol. Sci., 2022, 23, 724 CrossRef CAS PubMed.
- D.-H. Cai, C.-L. Zhang, Q.-Y. Liu, L. He, Y.-J. Liu, Y.-H. Xiong and X.-Y. Le, Eur. J. Med. Chem., 2021, 213, 113182 CrossRef CAS PubMed.
- N. Joksimović, J. Petronijević, N. Janković, M. Kosanić, D. Milivojević, M. Vraneš, A. Tot and Z. Bugarčić, Med. Chem., 2021, 17, 519 CrossRef PubMed.
- L. T. Bozic, M. Juribasic, P. Traldi, V. Scarcia and A. Furlani, Polyhedron, 2008, 27, 1317 CrossRef.
- H. Mansouri-Torshizi, M. Saeidifar, A. Divsalar, A. A. Saboury and S. Shahraki, Bull. Korean Chem. Soc., 2010, 31, 435 CrossRef CAS.
- V. L. Gein and M. A. Maryasov, Russ. J. Org. Chem., 2015, 51, 110 CrossRef CAS.
- N. Joksimović, N. Janković, J. Petronijević, D. Baskić, S. Popovic, D. Todorović, M. Zarić, O. Klisurić, M. Vraneš, A. Tot and Z. Bugarčić, Med. Chem., 2020, 16, 78 CrossRef PubMed.
- N. Joksimović, D. Baskić, S. Popović, M. Zarić, M. Kosanić, B. Ranković, T. Stanojković, B. S. Novaković, G. Davidović, Z. Bugarčić and N. Janković, Dalton Trans., 2016, 45, 15067 RSC.
- J. Petronijević, Z. Bugarčić, G. A. Bogdanović, S. Stefanović and N. Janković, Green Chem., 2017, 19, 707 RSC.
- S. X. dos Santos and É. T. G. Cavalheiro, J. Braz. Chem. Soc., 2014, 25, 1071 CAS.
- S. Zolezzi, A. Decinti and E. Spodine, Polyhedron, 1999, 18, 897 CrossRef CAS.
- E. Garribba and G. Micera, J. Chem. Educ., 2006, 83, 1229 CrossRef CAS.
- R. Miao, J. Wei, M. Lv, Y. Cai, Y. Du, X. Hui and Q. Wang, Eur. J. Med. Chem., 2011, 46, 5000 CrossRef CAS PubMed.
- H. K. Matthews, C. Bertoli and R. A. M. de Bruin, Nat. Rev. Mol. Cell Biol., 2022, 23, 74 CrossRef CAS PubMed.
- T. Z. Lv and G. S. Wang, Exp. Ther. Med., 2015, 10, 323 CrossRef CAS PubMed.
- A. Lezaja and M. Altmeyer, Cell Cycle, 2018, 17, 24 CrossRef CAS PubMed.
- B. Perillo, M. Di Donato, A. Pezone, E. Di Zazzo, P. Giovannelli, G. Galasso, G. Castoria and A. Migliaccio, Exp. Mol. Med., 2020, 52, 192 CrossRef CAS PubMed.
- Y. Wang, H. Qi, Y. Liu, C. Duan, X. Liu, T. Xia, D. Chen, H. l. Piao and H. X. Liu, Theranostics, 2021, 11, 4839 CrossRef CAS PubMed.
- E. A. Klein, I. M. Thompson Jr, C. M. Tangen, J. J. Crowley, M. S. Lucia, P. J. Goodman, L. M. Minasian, L. G. Ford, H. L. Parnes, J. M. Gaziano, D. D. Karp, M. M. Lieber, P. J. Walther, L. Klotz, J. K. Parsons, J. L. Chin, A. K. Darke, S. M. Lippman, G. E. Goodman, F. L. Meyskens Jr and L. H. Baker, J. Am. Med. Assoc., 2011, 306, 1549 CrossRef CAS PubMed.
- N. Joksimović, J. Petronijević, E. Milović, N. Janković, D. Baskić, S. Popović, D. Todorović, S. Matić, M. Vraneš and A. Tot, Med. Chem., 2022, 18, 337 CrossRef PubMed.
- T. Topală, A. Bodoki, L. Oprean and R. Oprean, Clujul Med., 2014, 87, 215 Search PubMed.
- J. Olmsted and R. D. Kearns, Biochem, 1997, 16, 3647 CrossRef PubMed.
- J. Petronijević, N. Janković, T. P. Stanojković, N. Joksimović, N. Đ. Grozdanić, M. Vraneš, A. Tot and Z. Bugarčić, Arch. Pharm. Chem. Life Sci., 2018, 351, 1 Search PubMed.
- E. Selimović, A. V. Komolkin, A. V. Egorov and T. Soldatović, J. Coord. Chem., 2018, 71, 1003 CrossRef.
- D. H. Powell, A. E. Merbach, I. Fabian, S. Schindler and R. van Eldik, Inorg. Chem., 1994, 33, 4468 CrossRef CAS.
- G. Laurenczy, Y. Ducommun and A. E. Merbach, Inorg. Chem., 1989, 28, 3024 CrossRef CAS.
- L. S. W. L. Sokol, T. D. Fink and D. B. Rorabacher, Inorg. Chem., 1980, 19, 1263 CrossRef CAS.
- D. H. Powell, L. Helm and A. E. Merbach, J. Chem. Phys., 1991, 95, 9258 CrossRef CAS.
- S. Jovanović, J. Bogojeski, M. V. Nikolić, M. Ž. Mijajlović, D. Lj. Tomović, A. M. Bukonjić, S. M. Knežević Rangelov, N. R. Mijailović, Z. Ratković, V. V. Jevtić, B. Petrović, R. S. Trifunović, S. Novaković, G. Bogdanović and G. P. Radić, J. Coord. Chem., 2019, 72, 1603 CrossRef.
- A. Neubrand, F. Thaler, M. Körner, A. Zhal, C. D. Hubbard and R. van Eldik, J. Chem. Soc., Dalton Trans., 2002, 6, 957 RSC.
- A. Đeković, B. Petrović, Ž. D. Bugarčić, R. Puchta and R. van Eldik, Dalton Trans., 2012, 41, 3633 RSC.
- T. Mosmann, J. Immunol. Methods, 1983, 65, 55 CrossRef CAS PubMed.
- O. Mitsuharu and T. Abe, J. Immunol. Methods, 1991, 145, 199 CrossRef.
- M. G. Ormerod, in Flow cytometry, A practical approach, Oxford University Press, 2000 Search PubMed.
- H.-Y. Chang, H.-C. Huang, T.-C. Huang, P.-C. Yang, Y.-C. Wang and H.-F. Juan, Flow cytometric detection of reactive oxygen species, 2013 Search PubMed.
- B. S. Janović, A. R. Collins, Z. M. Vujčić and M. T. Vujčić, J. Hazard. Mater., 2017, 321, 576 CrossRef PubMed.
Footnote |
| † Electronic supplementary information (ESI) available. See DOI: https://doi.org/10.1039/d2ra05797b |
| This journal is © The Royal Society of Chemistry 2022 |


