 Open Access Article
Cis–trans isomerization of dimethyl 2,3-dibromofumarate
Timothy H. Vo†
a,
Rafał Korlacki *b and
Alexander Sinitskii
 *a
*a
aDepartment of Chemistry, University of Nebraska-Lincoln, Lincoln 68588, NE, USA. E-mail: sinitskii@unl.edu
bDepartment of Electrical and Computer Engineering, University of Nebraska-Lincoln, Lincoln 68588, NE, USA. E-mail: rkorlacki2@unl.edu
First published on 14th November 2022
Abstract
The isomerization of dimethyl 2,3-dibromofumarate in chloroform solutions was investigated by the combination of nuclear magnetic resonance (NMR) and density functional theory (DFT) calculations. The bromination of dimethyl acetylenedicarboxylate leading to dimethyl 2,3-dibromofumarate produces the trans isomer initially, which however converts into the more stable cis isomer. The conversion from trans to cis is spontaneous and greatly accelerated by light.
1 Introduction
Dimethyl 2,3-dibromofumarate is an important precursor that is being used in many synthetic routes leading to complex molecules.1–9 It can be obtained by bromination of commercially available dimethyl acetylenedicarboxylate precursor, see Fig. 1. It appears generally well established in the literature that dimethyl 2,3-dibromofumarate exists predominantly as the trans isomer.2,3,5–9 Additionally, several chemical suppliers as well as PubChem list it as a pure trans isomer only. At the same time, the ratios between the trans and cis forms reported in the literature vary between the pure trans and up to 39% cis.10–13 The latter number is close to the value reported for its diethyl homologue, which is 41–42% cis.14,15 Intrigued by these discrepancies, we decided to investigate this matter in greater detail. In this paper, we show that the cis to trans equilibrium for this molecule is extremely sensitive to environmental conditions. Our experimental and theoretical data show that the cis isomer is more stable and thus the preferable form. Additionally, the experimental results show that the trans isomer readily converts to the cis form over time.2 Methods
All materials were purchased and used without further purification. Dimethyl acetylenedicarboxylate (95%) and bromine (99.5%) were purchased from Alfa Aesar. Anhydrous chloroform (≥99.8%) and anhydrous deuterated chloroform (99.8 atom % D) were purchased from Sigma-Aldrich. Fresh, unopened anhydrous deuterated chloroform was used in each experiment. Nuclear magnetic resonance (NMR) study was performed on a Bruker 300 MHz NMR instrument. In situ NMR study was performed on a Bruker 500 MHz NMR equipped with a CryoProbe. In situ UV-vis optical absorption spectroscopy was performed using a Jasco V-670 spectrophotometer.2.1 Synthesis of dimethyl 2,3-dibromofumarate under ambient light condition
Anhydrous deuterated chloroform (10 ml) and then dimethyl acetylenedicarboxylate (200 μl, 1.63 mmol) were added to a 50 ml round bottom flask equipped with a magnetic stir bar. The stirrer was started and bromine (167.5 μl, 3.26 mmol) was added to the reaction flask. Immediately after bromine was added, the reaction mixture was analyzed by 1H NMR. The reaction mixture was analyzed every 15 min for a duration of 150 min. The reaction mixture was stirred under the ambient light for approximately 1645 min and analyzed again. The reaction was capped for the duration of the experiment.2.2 In situ NMR study
The experiment was run in a dark room. In an NMR tube anhydrous deuterated chloroform was added (0.7 ml) and followed by bromine (11.73 μl, 2.326 mmol). The mixture was mixed well. Dimethyl acetylenedicarboxylate (14 μl, 1.163 mmol) was added to the mixture, mixed for a couple of seconds, and then the tube was inserted into the NMR chamber. A 1H NMR spectrum was acquired immediately and then every 15 min thereafter for 905 min. While the sample was still inside the NMR instrument, a light source was placed on top of the NMR chamber to expose the sample to light. 1H NMR spectra were acquired every 15 min for additional 255 min. The sample was then removed from the NMR chamber and exposed to ambient light for 10 min. The sample was analyzed by 1H NMR. This process was repeated one more time, but only with an exposure to ambient light for 5 min.2.3 In situ UV-vis study
Chloroform (3.5 ml) was added to a UV-vis cuvette, followed by dimethyl acetylenedicarboxylate (2.5 μl, 20.3 μmol), and then a UV-vis optical absorption spectrum was acquired. Bromine (1.04 μl, 20.3 μmol) was then added and the cuvette was agitated for a couple of seconds. UV-vis spectra were acquired immediately and then every 15 min thereafter for 120 min. The experiment was run in a dark room.2.4 DFT calculations
Density functional theory (DFT) calculations of NMR chemical shifts were performed using a commercial package PQS.16 NMR chemical shifts were calculated using a slightly modified procedure of Jain et al.17 First, the molecular structures of the isomers were optimized at the B3LYP/6-31G* level18–21 followed by the calculation of nuclear magnetic shieldings using the gauge-including atomic orbital (GIAO) method.22,23 We used the method that Jain et al.17 found the most accurate: the combination of the WP04 functional24 with one of the basis sets from the Dunning family, aug-cc-pvdz.25–27 Our modification of the procedure was modeling the solvation using the conductor-like screening model (COSMO)28 implemented in PQS rather than the polarizable continuum model (PCM) used by Jain et al. (in both cases chloroform was used as solvent). Nevertheless, we used the same empirical scaling factors to convert the calculated nuclear magnetic shieldings to the relative chemical shifts.173 Results and discussion
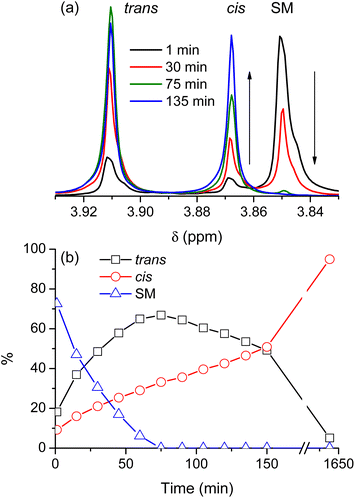
Fig. 2 shows a typical reaction leading to dimethyl 2,3-dibromofumarate, probed by NMR at regular intervals throughout the process. Fig. 2a shows several representative NMR spectra to illustrate the nonlinear dynamics of the reaction. The starting material (SM) is characterized by the NMR peak with a chemical shift of 3.85 ppm. Upon the addition of pure bromine (which constitutes the beginning of the time axis), it is rapidly converted into two distinct products, which correspond to the NMR peaks with chemical shifts of 3.87 and 3.91 ppm, respectively. The NMR spectra in Fig. 2a show that while the peak at 3.87 ppm is steadily growing with time, the peak at 3.91 ppm first increases in intensity but then decreases after a certain period of time. Fig. 2b illustrates this behavior in greater detail by showing relative concentrations of the starting material and the two reaction products as a function of time; the data were obtained from the NMR spectra similar to the ones shown in Fig. 2a. It is evident that one of the products is dominant at the beginning of the synthesis, but after some time its concentration starts to decline whereas the concentration of the second product grows steadily all the time. After long enough time only the second product is present in the reaction mixture. Based on the previous study by Schuh and Glorius,13 we identified the products as trans- and cis-dimethyl 2,3-dibromofumarate, respectively.As this course of the reaction is clearly inconsistent with what was reported in the literature before, we first decided to verify whether the identification of the products is actually correct. Table 1 compares the experimental NMR chemical shifts with the corresponding values calculated using DFT, showing an excellent agreement between the two data sets (In addition to the computational method described in the Methods section we tried several others as well. While their accuracy was not nearly as good as the results presented in Table 1, they all consistently show that the chemical shift for the trans isomer is larger than for the cis isomer). Hence, we have no reason to question the assignment of NMR peaks with isomers of dimethyl 2,3-dibromofumarate, but it implies that in contrast to all the previous reports we obtain the pure cis isomer at the very end of our synthesis cycle.
| Schuh and Glorius13 | Exp. | Calc. | |
|---|---|---|---|
| SM | 3.85 | 3.84 | |
| cis | 3.83 | 3.87 | 3.75 |
| trans | 3.88 | 3.91 | 3.88 |
This result is not only surprising, but also counter intuitive. Bromine, in addition to being a relatively large and heavy atom is also electronegative, i.e. carries a partial charge. Hence we would expect that both steric hindrance and electrostatic repulsion would promote the trans isomer. The dynamics at the beginning of the reaction (Fig. 2) seems to be consistent with this reasoning, with much more trans than cis isomer being initially produced. After some time, however, this trend reverses, and the reversal coincides with the end of the bromination of the starting material. It seems, therefore, that the bromination of the starting material produces predominantly the trans isomer, which then converts to cis at an approximately constant rate.
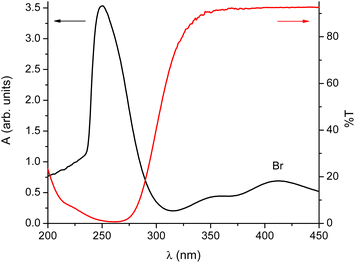
We decided to test a hypothesis that the conversion of isomers is affected by the presence of light. Optical spectra in Fig. 3 clearly show that despite the fact that the materials involved absorb mainly in the ultraviolet range, there is enough absorption in the transparent region of typical laboratory glassware for it to matter.
 | ||
| Fig. 3 UV-vis spectra acquired during the synthesis. Black line – the absorption spectrum of the starting material; red line – typical transmission curve of glass, here a standard glass slide. | ||
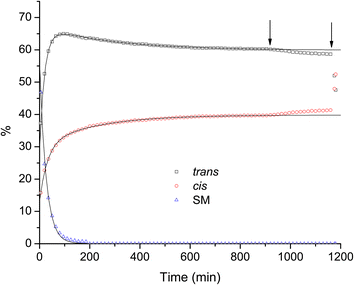
Fig. 4 shows that the light has indeed a dramatic effect on the ratio of isomers. However, it also shows that the interconversion occurs even without the light, only at a much lower rate. Looking at the results of our DFT calculations we can observe that the absolute energy of the cis isomer is lower than the trans isomer by several kcal mol−1 for most methods tested, with the difference being even larger in vacuo than in chloroform. Therefore, the interconversion of isomers is expected to occur spontaneously under ambient environmental conditions. The dataset presented in Fig. 4 in the range of up to about 900 min. (i.e. no exposure to light), allows us to try to quantify the dynamics of the process, by performing a least-squares fit of model curves to the data points. For the cis and trans isomers we fit the experimental data with second order exponential decay curves (two processes). In case of the starting material it is expected that two independent processes occur, the conversion of the SM into the trans isomer, and the conversion of the SM into the cis isomer, but it seems clear from the data that these processes have similar time constants and are hence indistinguishable. Therefore, we fit the experimental data points for the SM with a first order exponential decay curve (a single decay process). The solid lines in Fig. 4 are the results of the fitting process and, as one can see, they reproduce the experimental data points with excellent accuracy. The obtained parameters from the fits are listed in Table 2. The rise of the concentration of the cis isomer is well represented (fitted) using two distinct time constants: 31 min (nearly coinciding with the time constant of the decay of the SM, which is 26 min), and a much slower 216 min, which we attribute to the trans-to-cis conversion process. The dynamics of the trans isomer is well reproduced by two concurrent processes: an initial rise (a negative amplitude decay) with the time constant of 20 min, and a slow decay (positive amplitude) with the time constant of 290 min. Extrapolated to infinity, the concentrations of the trans and cis isomers indicate that the equilibrium between the two forms, in the absence of light, appears to stabilize at the ratio of 60% trans to 40% cis. It is worth noting that this value is very close to what was reported for diethyl 2,3-dibromofumarate,14,15 as we mentioned in the introduction.
| A1 | t1 | A2 | t2 | y0 | |
|---|---|---|---|---|---|
| SM | 0.56 | 25.9 | — | — | 7 × 10⁻⁴ |
| cis | −0.17 | 30.9 | −0.095 | 216 | 0.398 |
| trans | −0.38 | 20.4 | 0.074 | 291 | 0.598 |
While the results of this study do not support that dimethyl 2,3-dibromofumarate exists predominantly as the trans isomer,2,3,5–13 cis isomerization of related compounds is not without precedents. For a number of 1,2-dihaloethylenes the cis form is more energetically favorable than the trans form,29–31 and acid-promoted hydrohalogenation of 2-propynoic acid and its derivatives results in the Z-isomers as nearly exclusive products,32 to name just a couple of examples. Therefore, this study does not only clarify the structure of dimethyl 2,3-dibromofumarate, which is an important precursor in synthetic organic chemistry,1–9 but also provides an additional experimental data point for the discussion of the “cis effect”.
4 Conclusions
We investigated isomerization dynamics of dimethyl 2,3-dibromofumarate in chloroform solutions by means of nuclear magnetic resonance and density functional theory. In contrast to previous reports in the literature and chemistry databases we observed that the cis isomer is more stable. The trans isomer, which is the preferred product of the bromination reaction, quickly converts to the cis form. This process is greatly accelerated by even small amounts of light.Conflicts of interest
There are no conflicts to declare.Acknowledgements
Authors gratefully acknowledge Dr Patrick Dussault for useful discussions. The work has been funded by the Office of Naval Research (N00014-19-1-2596). Theoretical calculations were performed at the Center for Nanohybrid Functional Materials core facility supported by the National Science Foundation under Award No. EPS-1004094.Notes and references
- F. Diederich, M. Schreiher, J. Anthony, U. W. Suter, M. Colussi, R. Nesper, M. E. Spahr, P. Gunter, C. Bosshard, P. Kaatz, P. Wachter, L. Degiorgi, F. Bommeli, M. Hubrich, M. Gross, C. Boudon and J.-P. Gisselbrecht, Adv. Mater., 1994, 6, 786–790 CrossRef.
- J. P. Fitzgerald, H. Nanda, P. Fitzgerald and G. T. Yee, J. Org. Chem., 2000, 65, 2222–2224 CrossRef CAS PubMed.
- G. A. Molander and L. A. Felix, J. Org. Chem., 2005, 70, 3950–3956 CrossRef CAS PubMed.
- R. Sakamoto, M. Murata and H. Nishihara, Angew. Chem., Int. Ed., 2006, 45, 4793–4795 CrossRef CAS PubMed.
- T. M. Figueira-Duarte, V. Lloveras, J. Vidal-Gancedo, B. Delavaux-Nicot, C. Duhayon, J. Veciana, C. Rovira and J.-F. Nierengarten, Eur. J. Org. Chem., 2009, 2009, 5779–5787 CrossRef.
- H. Hu, K. Shi, R. Hou, Z. Zhang, Y. Zhu and J. Zhou, Synthesis, 2010, 2010, 4007–4014 CrossRef.
- M. Hayashi, R. Sakamoto and H. Nishihara, Chem.–Eur. J., 2012, 18, 8610–8613 CrossRef CAS PubMed.
- Y.-L. Wu, F. Ferroni, S. Pieraccini, W. B. Schweizer, B. B. Frank, G. P. Spada and F. Diederich, Org. Biomol. Chem., 2012, 10, 8016–8026 RSC.
- R. Sakamoto, Int. J. Chem. Eng. Appl., 2016, 7, 52–55 CAS.
- J. Berthelot, Y. Benammar and B. Desmazières, Synth. Commun., 2006, 27, 2865–2876 Search PubMed.
- S. Adimurthy, S. Ghosh, P. U. Patoliya, G. Ramachandraiah, M. Agrawal, M. R. Gandhi, S. C. Upadhyay, P. K. Ghosh and B. C. Ranu, Green Chem., 2008, 10, 232–237 RSC.
- N. Windmon and V. Dragojlovic, Tetrahedron Lett., 2008, 49, 6543–6546 CrossRef CAS.
- K. Schuh and F. Glorius, Synthesis, 2007, 2007, 2297–2306 CrossRef.
- L. Zhou and H. Jiang, Chin. J. Org. Chem., 2006, 26, 1682–1685 CAS.
- D.-Q. Sun and J.-K. Yang, Heteroat. Chem., 2012, 23, 84–90 CrossRef CAS.
- PQS version 3.3, Parallel Quantum Solutions, 2013, Green Acres Road, Fayetteville, Arkansas 72703 Search PubMed.
- R. Jain, T. Bally and P. R. Rablen, J. Org. Chem., 2009, 74, 4017–4023 CrossRef CAS PubMed.
- A. D. Becke, J. Chem. Phys., 1993, 98, 1372–1377 CrossRef CAS.
- C. Lee, W. Yang and R. G. Parr, Phys. Rev. B: Condens. Matter Mater. Phys., 1988, 37, 785–789 CrossRef CAS PubMed.
- W. J. Hehre, R. Ditchfield and J. A. Pople, J. Chem. Phys., 1972, 56, 2257–2261 CrossRef CAS.
- P. C. Hariharan and J. A. Pople, Theor. Chim. Acta, 1973, 28, 213–222 CrossRef CAS.
- R. Ditchfield, J. Chem. Phys., 1976, 65, 3123–3133 CrossRef CAS.
- K. Wolinski, J. F. Hinton and P. Pulay, J. Am. Chem. Soc., 1990, 112, 8251–8260 CrossRef CAS.
- K. W. Wiitala, T. R. Hoye and C. J. Cramer, J. Chem. Theory Comput., 2006, 2, 1085–1092 CrossRef CAS PubMed.
- T. H. Dunning, J. Chem. Phys., 1989, 90, 1007–1023 CrossRef CAS.
- R. A. Kendall, T. H. Dunning and R. J. Harrison, J. Chem. Phys., 1992, 96, 6796–6806 CrossRef CAS.
- A. K. Wilson, D. E. Woon, K. A. Peterson and T. H. Dunning, J. Chem. Phys., 1999, 110, 7667–7676 CrossRef CAS.
- A. Klamt and G. Schuurmann, J. Chem. Soc., Perkin Trans. 2, 1993, 2, 799–805 RSC.
- R. C. Bingham, J. Am. Chem. Soc., 1976, 98, 535–540 CrossRef CAS.
- A. Skancke and J. E. Boggs, J. Am. Chem. Soc., 1979, 101, 4063–4067 CrossRef CAS.
- Y. Takashi, K. Daisuke and T. Shuji, Bull. Chem. Soc. Jpn., 2008, 81, 1415–1422 CrossRef.
- S. Ma, X. Lu and Z. Li, J. Org. Chem., 1992, 57, 709–713 CrossRef CAS.
Footnote |
| † Present address: Food and Drug Administration, Dallas, TX 75204, USA. |
| This journal is © The Royal Society of Chemistry 2022 |


