 Open Access Article
Multi-step phase transition crystal with dielectric constant bistability and temperature-dependent conductivity†
W. B. Feng‡
 a,
W. Xu‡b,
H. B. Duan
 *a and
H. Zhang
 a
a
aSchool of Environmental Science, Nanjing Xiaozhuang University, Nanjing 211171, P.R. China. E-mail: duanhaibao4660@163.com
bDepartment of Chemistry, Huangshan University, Huangshan 245041, P.R. China
First published on 14th November 2022
Abstract
Here, we report the crystal structures, phase transitions, and thermal, dielectric, and conducting properties of an ion-pair compound [C4-bmim][Ni(mnt)2] (1). 1 undergoes a three-step phase transition with four phases before melting. A two-step dielectric constant bistability is also realized by the structural phase transition in 1 occurring among phases I, II, and III, which is due to the in-plane oscillations of the alkyl chain and crystal-to-mesophase transition, respectively. Moreover, 1 exhibits rare temperature-dependent conducting properties accompanying structural phase transitions, and conductivity is very high with 0.00186 S cm−1 at 413 K. The conduction properties of phase III (mesophase) arise from the dipole molecular motion.
Over the past decade, there has been considerable interest in the development of tunable stimuli-responsive materials that exhibit bistability in their properties, namely optical, magnetic, and electrical, by applying an external perturbation (temperature, pressure, or light irradiation).1 The bistable performance between different states can be used in sensors, switches, memory devices, etc.2 Magnetic bistability is usually observed in spin-crossover (SCO) compounds, valence tautomeric compounds, organic radicals, and one-dimensional S = 1/2 spin-Peierls-type transition compounds.3–8 In our previous studies, we have designed and achieved a series of compounds with magnetic bistability based on the one-dimensional (1D) [Ni(mnt)2]− (mnt2− = maleonitriledithiolate) spin system.9 However, dielectric bistability and temperature-dependent conductivity in a dithiolene spin system have not been observed experimentally.
When the cooperativity of dielectric phase transition compounds is sufficient, the hysteretic behavior is present, conferring dielectric bistability and memory function to the compounds, similar to magnetic bistability.10 The dielectric constant is usually related to the electric polarizability of a material and is microscopically associated with dipolar motions. Dielectric bistability can be found in some amphidynamic crystals built with a combination of static (stator) and dynamic (rotator) elements in which the motion of molecular orientations throughout the crystal are accompanied by a significant dielectric response. For example, the supermolecular rotor [(cyclohexylammonium)(18-crown-6)]FSO3 with stator–rotator structure displays a noteworthy dielectric relaxation behavior and excellent pyroelectric switching characteristics.11 The dielectric relaxation and rotation dynamics of diazabicyclo[2.2.2]octane hydrogen-bonded molecular rotors were investigated by our group.12 The molecular rotation or translational motion can be easily realized in plastic and liquid crystals systems by simple molecular designs. The long alkyl chain, spherical or cylindrical in shape can be used to construct a rotational component. Recently, rotatable structural components were introduced into the [Ni(mnt)2]− spin system. Such moieties can easily inspire structural changes upon thermal stimuli, and it has been proved that spin transition occurs at a much higher temperature than the common spin-Peierls transitions by lattice softness.9b Furthermore, molecular motions of small organic cations such as pyridinium or imidazolium ions also gave rise to ferroelectric properties.13–15 Methyl-imidazolium salts are room-temperature ionic liquids and provided little hindrance for the reorientational process.16 Thus, the incorporation of a rotatable ionic component (methyl-imidazolium) into rigid [Ni(mnt)2]− systems may construct the expected stator–rotator structure.
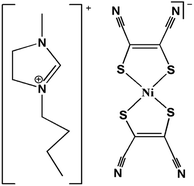
Encouraged by this strategy, we successfully synthesized the ion-pair compound [C4-bmim][Ni(mnt)2], (1) (C4-bmim = 1-butyl-3-methylimidazolium) (Scheme 1), which undergoes the three-step structural phase transition before melting accompanying the two-step dielectric constant bistability. Furthermore, 1 is a rare example of materials showing temperature-dependent conductivity properties. At 413 K, it has a very high conductivity of 0.00186 S cm−1.
The black needle crystals of 1 were prepared by a solution method (Experimental details in the ESI†). The powder X-ray diffraction (PXRD) measurements and elemental analysis (for C, H, and N) demonstrated that 1 shows high phase purity. The thermogravimetric (TG) plot is shown in Fig. S1,† indicating that 1 starts thermal decomposition at ∼580 K.
Differential Scanning Calorimetry (DSC) measurements were performed both in heating and cooling runs in the temperature range of 223–441 K (before melting point) and 223–473 K (after melting point), as shown in Fig. 1 and S2,† respectively. Fig. 1 illustrates that during the heating process, 1 displays three endothermic events at peak temperatures of ∼364 K, 389 K, and 435 K. In the cooling process, three exothermal events occurred at ∼363 K, 388 K, and 430 K. Thus, 1 shows a three-step phase transition in the temperature range of 223–441 K. To investigate the phase transition feature, several crystals were selected and were heated from room temperature to 500 K. The crystal began to melt at ∼446 K. Combined with variable-temperature (VT) PXRD results (discussion in the next section), the phase transition at 389 and 435 K may be ascribed to the crystal-to-mesophase transition. In addition, the thermotropic liquid crystal behavior was not observed at 440 K by polarized optical microscopy (POM). According to DSC results, the phases of 1 are named phase I (∼223–363 K), II (∼363–389 K), III (∼389–435 K), and IV (∼435–446 K). When the sample was heated to melting and cooled to 223 K, four endothermic and five exothermal events were observed in the DSC curves (Fig. S2†).
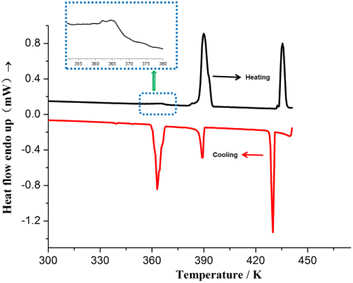 | ||
| Fig. 1 DSC curves for 1 in the heating/cooling cycle before melting, showing the three-step heat anomaly. | ||
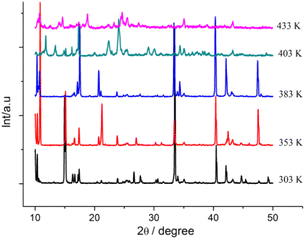
The phase transition process of 1 is further demonstrated by VTPXRD (Fig. 2). The sharp Bragg reflections at 303 K, correspond to the reflections of (1 0 2) with 2θ = 10.37° and (1 1 1) with 2θ = 15.24°. No structural phase transition took place between 303 and 353 K. The crystal packing structures of 1 in phases I and II are similar, as evidenced by the similarities between the diffraction patterns of 1 at 353 and 383 K. The only very slight difference is that the strong diffraction peak at 2θ = 15.1° at 383 K disappears. Very low values of enthalpy (DCS results) from phase I to phase II also support the same crystal packing structure. The single crystal structure of phases I and II will also be investigated in the next section. The PXRD pattern of 1 at 403 K differs significantly from that at 383 K upon heating, confirming the phase transition of the structure from phase II to phase III. The significant changes in phase transition, enthalpy, and entropy occur between phases II and III. When the temperature reaches 433 K, the sharpest reflection peak on the high-angle side disappeared, indicating the third step of phase transition. In phases III and IV, diffuse wide-angle scattering is observed, which indicates the coexistence of amorphous domains. It is speculated that phases III and IV represent mesophase as a result of alkyl-chain melting.
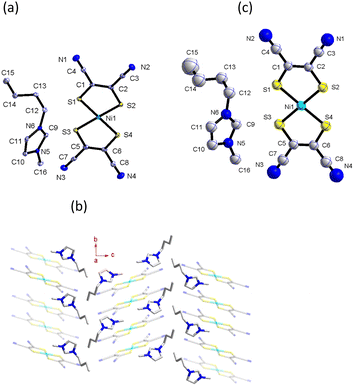
The crystal structure of 1 at 298 K (phase I) fits the monoclinic system, space group P21/c. An asymmetric unit of 1 comprises one [Ni(mnt)2]− anion and one C4-bmim+ cation, as shown in Fig. 3a. The hydrocarbon chain exhibits a mixed trans–cis conformation with C(13), C(15), and C(16) atoms displaying trans-conformation and C(14) atoms exhibiting cis conformation. The hydrocarbon chain orientation in the cation is approximately perpendicular to the long molecular axis of the [Ni(mnt)2]− anion. The mean-molecule-planes of C(13)C(14)C(15)C(16) and imidazole ring make a dihedral angle of 83.6°. In an anion stack of phase I, two neighboring anions form a cofacial π-type dimer, and there is slippage between two anions along the short molecular axis. The shorter interatomic separations between the neighboring anions, i.e., 3.662 Å of Ni(1)⋯Ni(1)i, 3.590 Å of S(2)⋯S(3)i, and 3.895 Å of S(2)⋯S(4)i in the intra-dimer and 4.684 Å of Ni(1)⋯Ni(1)ii, 4.742 Å of S(2)⋯S(3)ii, and 4.462 Å of S(2)⋯S(4)ii, in the inter-dimer were observed (symmetric code (i) = 1 + x, 1 − y, −z; (ii) = 1 − x, −y, 1 − z). Along the a-axis direction, the hydrocarbon chain of the cations formed a hydrophobic layer (Fig. 3b).
From 298 to 363 K (phase II), the space group and packing structure of 1 does not change; the unit-cell parameters are analogous to those at 298 K (Table S1†). However, to investigate the difference between phases I and II, we carefully examined the atomic thermal displacement parameters (Fig. 3c); the values of Ueq for C(15) and C(16) increase rapidly as the temperature rises from 298 K to 363 K, which indicates that there exists a thermally activated rapid in-plane oscillatory fluctuation for the alkyl chain of the [C4-bmim]+ cation. On the other hand, the corresponding Ueq values for carbon and nitrogen atoms of the imidazole ring showed a gradual increase at these temperature ranges. It is worth noting that the bond length of C(14)⋯C(15) decreases abnormally from 1.517 Å at 298 K to 1.475 Å at 363 K. In addition, as the temperature increased, an obvious slippage between two anions along the long molecular axis was observed. The interatomic separations between the neighboring anions i.e., 3.736 Å of Ni(1)⋯Ni(1)iii, 3.779 Å of S(2)⋯S(3)iii and large length 5.603 Å of S(2)⋯S(4)iii in the intra-dimer occurred at 363 K (symmetric code (iii) = 2 − x, −y, 1 + z).
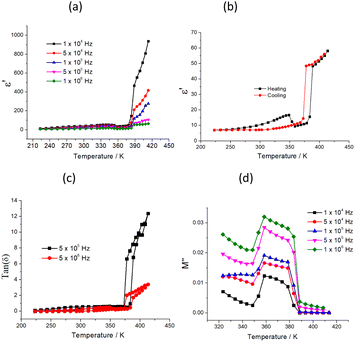
The temperature-dependent dielectric permittivity was performed for 1 on polycrystalline samples at 1–107 Hz from 223 to 413 K (Fig. 4). Because of the partial melting of the sample at 433 K, the dielectric properties of the sample were investigated before 413 K (including phase I, II, and III). The plots of ε′–T display weak temperature-dependence dielectric permittivity when the temperature is below 270 K (Fig. 4a and S3†), indicating that the thermally activated dipole motion is suppressed at low temperatures. A broad peak was observed in the temperature range of 300–360 K, and as the temperature increased to 383 K, the ε′ value abruptly increased, depending strongly on frequency. It is interesting to note that during the subsequent cooling process, two hysteresis loops with unusual shapes appeared in the temperature range of 223–413 K, indicating the existence of two-step dielectric bistability for 1 (Fig. 4b), which corresponds to two-step thermal anomalies occurring in the DSC plot at 364 K and 389 K, respectively. To date, compounds with magnetic or optical bistability nature via thermally induced structural changes have been widely studied17–19 and accordingly hysteresis loops have also been reported in some spin-crossover mesophase systems and were interpreted to be caused by the supercooling of mesophase (where a crystalline-to-mesophase transformation and a spin-crossover process occur in the same temperature interval).20 However, 1 is a rare example showing two-step dielectric bistability. Moreover, as shown in Fig. 4c, the plots of tan(δ)–T (dielectric loss) also exhibit two-step bistability similar to that depicted in Fig. 4b. The values of dielectric loss rapidly increase as the temperature is raised to 383 K and tan(δ) is 9.6 at 403 K and f = 1 MHz, which demonstrates that the direct current conduction of the sample increased sharply. To reduce the influence of direct current conduction and electrode polarization, dielectric modulus was used to analyze the dielectric transition of 1. Dielectric modulus is calculated as follows:
The two-step dielectric transitions observed in the temperature range of 223–413 K can be discussed as follows: (1) dielectric anomaly is usually caused by structural phase transition. From phase I to II, combined with temperature-dependent single crystal results, it can be seen that the space group of crystal 1 does not change; however, the thermal displacement parameters of C(14) and C(15) of the alkyl chain rapidly increases, and the bond length of C(4)⋯C(15) showed an abnormal decrease from room temperature to 353 K, indicating the rapid in-plane oscillatory fluctuation of the alkyl chain. Thus, the first step dielectric anomaly of 1 could be attributed to the disorder of the C4-bmim+ cation. (2) The second dielectric transition is relevant to the crystal-mesophase transition. A pair of larger endothermic and exothermic peaks occurred in the DSC curve compared to the first step order to disorder transition (ref. Fig. 1). It is not feasible to get the single crystal structure of phase III after the second phase transition because of poor crystallinity. Furthermore, the obvious diffuse wide-angle scattering occurred in phase III in the VTPXRD plots, indicating the occurrence of phase transition from the crystal to mesophase (ref. Fig. 2).
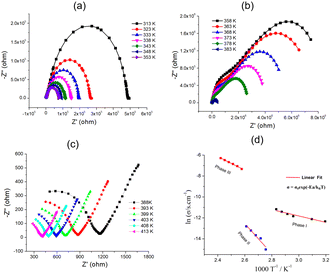
To better understand the two-step dielectric transition process, we further analyzed the ionic conduction behavior of 1. Fig. 5 shows the variation of the imaginary part of impedance (−Z′′) with the real part (Z′) from 313 to 413 K. Interestingly, 1 exhibits three types of different conducting behaviors in phases I, II, and III. From 313 to 353 K (phase I), as temperature increases, the radius of the arc corresponding to the bulk resistance decreases, indicating an activated thermal conduction mechanism (Fig. 5a). From 353 to 363 K, the radius of the arc increased abnormally, which corresponds to the decrease in conductivity (Fig. S4†). In the temperature range of 363–383 K (phase II), resistance also decreases with increased temperature (Fig. 5b). From 388 to 413 K (phase III), the resistance abruptly decreases and the thermal conduction mechanism occurs (Fig. 5c). The impedance plots were fitted using the equivalent circuit. The temperature-dependent conductivities are plotted in the form of ln![[thin space (1/6-em)]](https://www.rsc.org/images/entities/char_2009.gif) σdc versus 1000/T (Fig. 5d). The plots can be divided into three parts corresponding to phase I, II, and III, and each part shows a linear relationship. From phase I to II, the conductivity of 1 decreased. The value of conductivity at 353 K of 1 is 1.41 × 10⁻⁵ S cm−1; however, it reached a minimum of 2.47 × 10⁻⁷ S cm−1 at 363 K, which can be ascribed to the increase in the disorder of the C4-bmim+ cations with the increase in temperature, and the concentration of the C4-bmim+ cation charges decreased. A similar example was reported in MOF compounds containing ionic liquid in the channel.21 From phase II to III, the conductivity of 1 sharply increased. The value of conductivity was 6.56 × 10⁻⁴ S cm−1 at 388 K and 0.086 S cm−1 at 413 K. Combined with the second dielectric transition discussion, the occurrence of mesophase in phase III means rapid mobility of cations, leading to the increase in the conductivity of phase III. Furthermore, the dielectric constant ε′ at 393 K was ten times larger than that at 378 K and f = 10 KHz, which indicated that its conduction arises from the dipole molecular motion rather than a fast electronic motion under the ac electric field.22,23
σdc versus 1000/T (Fig. 5d). The plots can be divided into three parts corresponding to phase I, II, and III, and each part shows a linear relationship. From phase I to II, the conductivity of 1 decreased. The value of conductivity at 353 K of 1 is 1.41 × 10⁻⁵ S cm−1; however, it reached a minimum of 2.47 × 10⁻⁷ S cm−1 at 363 K, which can be ascribed to the increase in the disorder of the C4-bmim+ cations with the increase in temperature, and the concentration of the C4-bmim+ cation charges decreased. A similar example was reported in MOF compounds containing ionic liquid in the channel.21 From phase II to III, the conductivity of 1 sharply increased. The value of conductivity was 6.56 × 10⁻⁴ S cm−1 at 388 K and 0.086 S cm−1 at 413 K. Combined with the second dielectric transition discussion, the occurrence of mesophase in phase III means rapid mobility of cations, leading to the increase in the conductivity of phase III. Furthermore, the dielectric constant ε′ at 393 K was ten times larger than that at 378 K and f = 10 KHz, which indicated that its conduction arises from the dipole molecular motion rather than a fast electronic motion under the ac electric field.22,23
In summary, the crystal structures, DSC, VTPXRD, and dielectric and conducting properties have been investigated for the ion pair compound [C4-bmim][Ni(mnt)2] (1). 1 undergoes a three-step phase transition with four phases before melting accompanied by the dielectric transition. To the best of our knowledge, 1 is a rare example showing two-step dielectric constant bistability, which can be ascribed to the in-plane oscillation of the alkyl chain and crystal-to-mesophase transition. Another striking feature is that phases I–III exhibit different conducting behaviors and the conductivity of phase III is very high with 0.00186 S cm−1 at 413 K. Phase III conduction arises from the dipole molecular motion. This work indicates a new type of multi-step phase transition material with interesting dielectric and conducting properties.
Conflicts of interest
There are no conflicts to declare.Acknowledgements
The authors thank the Natural Science Foundation of JiangSu Province and the Natural Science Training Foundation of NJXZC for their financial support (Grant No: BK20171125 and 2016NXY12).References
- (a) K. Zhang, Y. Huang, A. E. Miroshnichenko and L. Gao, J. Phys. Chem. C, 2017, 121, 11804 CrossRef CAS; (b) Y. Shi, C. Zhang, H. Zhang, J. Bechtel, L. Dalton, B. Robinson and W. Steier, Science, 2000, 288, 119 CrossRef CAS PubMed; (c) M. Lee, H. E. Katz, C. Erben, D. M. Gill, P. Gopalan, J. D. Heber and D. J. McGee, Science, 2002, 298, 1401 CrossRef CAS PubMed.
- (a) Y. Yu, M. Nakano and T. Ikeda, Nature, 2003, 425, 145 CrossRef CAS PubMed; (b) J. A. Delaire and K. Nakatani, Chem. Rev., 2000, 100, 1817 CrossRef CAS PubMed.
- (a) S. Brooker, Chem. Soc. Rev., 2015, 44, 2880 RSC; (b) O. Kahn and C. J. Martinez, Science, 1998, 279, 44 CrossRef CAS.
- B. Weber, W. Bauer and J. Obel, Angew. Chem., Int. Ed., 2008, 47, 10098 CrossRef CAS.
- (a) B. Weber, Coord. Chem. Rev., 2009, 253, 2432–2449 CrossRef CAS; (b) C. Lochenie, W. Bauer, A. P. Railliet, S. Schlamp, Y. Garcia and B. Weber, Inorg. Chem., 2014, 53, 11563 CrossRef CAS PubMed.
- (a) T. Li, G. W. Tan, D. Shao, J. Li, Z. C. Zhang, Y. Song, Y. X. Sui, S. Chen, Y. Fang and X. P. Wang, J. Am. Chem. Soc., 2016, 138, 10092 CrossRef CAS PubMed; (b) T. Tao, H. Maruyama and O. Sato, J. Am. Chem. Soc., 2006, 128, 1790 CrossRef PubMed.
- P. Leeladee, R. A. Baglia, K. A. Prokop, R. Latifi, S. P. De Visser and D. P. Goldberg, J. Am. Chem. Soc., 2012, 134, 10397 CrossRef CAS PubMed.
- (a) W. Fujita and K. Awaga, Science, 1999, 286, 261 CrossRef CAS PubMed; (b) X. M. Ren, S. Nishihara, T. Akutagawa, S. Noro, T. Nakamura, W. Fujita and K. Awaga, Chem. Phys. Lett., 2006, 418, 423 CrossRef CAS.
- (a) H. B. Duan, X. M. Ren and Q. J. Meng, Coord. Chem. Rev., 2010, 254, 1509 CrossRef CAS; (b) H. B. Duan, X. M. Ren, L. J. Shen, W. Q. Jin, Q. J. Meng, Z. F. Tian and S. M. Zhou, Dalton Trans., 2011, 40, 3622 RSC; (c) H. B. Duan, X. R. Chen, H. Yang, X. M. Ren, F. Xuan and S. M. Zhou, Inorg. Chem., 2013, 52, 3870 CrossRef CAS PubMed; (d) Z. F. Tian, H. B. Duan, X. M. Ren, C. S. Lu, Y. Z. Li, Y. Song, H. Z. Zhu and Q. J. Meng, J. Phys. Chem. B, 2009, 113, 8278 CrossRef CAS PubMed; (e) S. S. Yu, H. B. Duan, X. R. Chen, Z. F. Tian and X. M. Ren, Dalton Trans., 2013, 42, 3827 RSC.
- (a) W. Zhang, H. Y. Ye, R. Graf, H. W. Spiess, Y. F. Yao, R. Q. Zhu and R. G. Xiong, J. Am. Chem. Soc., 2013, 135, 5230 CrossRef CAS PubMed; (b) X. Zhang, X. D. Shao, S. C. Li, Y. Cai, Y. F. Yao, R. G. Xiong and W. Zhang, Chem. Commun., 2015, 51, 4568 RSC; (c) X. H. Zhao, X. C. Huang, S. L. Zhang, D. Shao, H. Y. Wei and X. Y. Wang, J. Am. Chem. Soc., 2013, 135, 16006 CrossRef CAS PubMed; (d) C. M. Ji, Z. H. Sun, S. Q. Zhang, T. L. Chen, P. Zhou and J. H. Luo, J. Mater. Chem. C, 2014, 2, 567 RSC.
- Z. X. Zhang, T. Zhang, P. P. Shi, W. Y. Zhang, Q. Ye and D. W. Fu, J. Phys. Chem. Lett., 2019, 10, 4237 CrossRef CAS PubMed.
- X. Jiang, H. B. Duan, M. J. Jellen, Y. Chen, T. S. Chung, Y. Liang and M. A. Garcia-Garibay, J. Am. Chem. Soc., 2019, 141, 16802 CrossRef CAS.
- (a) P. Czarnecki, W. Nawrocik, Z. Pająk and J. Wąsicki, J. Phys.: Condens. Matter, 1994, 6, 4955 CrossRef CAS; (b) J. Wąsicki, P. Czarnecki, Z. Pająk, W. Nawrocik and W. Szczepański, J. Chem. Phys., 1997, 107, 576 CrossRef; (c) Z. Pajak, P. Czarnecki, B. Szafrańska, H. Małuszyńska and Z. Fojud, Phys. Rev. B, 2004, 69, 132102 CrossRef.
- J. Przesławski, B. Kosturek, S. Dacko and R. Jakubas, Solid State Commun., 2007, 142, 713 CrossRef.
- Y. Zhang, H. Y. Ye, H. L. Cai, D. W. Fu, Q. Ye, W. Zhang, Q. Zhou, J. Wang, G. L. Yuan and G. X. Xiong, Adv. Mater., 2014, 26, 4515 CrossRef CAS PubMed.
- T. Timofte, S. Pitula and A. V. Mudring, Inorg. Chem., 2007, 46, 10940 CrossRef PubMed.
- O. Kahn and C. J. Martinez, Science, 1999, 279, 44 CrossRef.
- J. Liang, Z. Chen, L. Xu, J. Wang, J. Yin, G. A. Yu, Z. N. Chen and S. H. Liu, J. Mater. Chem. C, 2014, 2, 2243 RSC.
- X. Y. Dong, B. Li, B. B. Ma, S. J. Li, M. M. Dong, Y. Y. Zhu, S. Q. Zang, Y. Song, H. W. Hou and T. C. W. Mak, J. Am. Chem. Soc., 2013, 135, 10214 CrossRef CAS PubMed.
- M. Seredyuk, A. B. Gaspar, V. Ksenofontov, Y. Galyametdinov, J. Kusz and P. Gütlich, Adv. Funct. Mater., 2008, 18, 2089 CrossRef CAS.
- W. X. Chen, H. R. Xu, G. L. Zhuang, L. S. Long, R. B. Huang and L. S. Zheng, Chem. Commun., 2011, 47, 11933 RSC.
- K. C. Kao, Dielectric Phenomena in Solids, Elsevier, 2004 Search PubMed.
- T. Akutagawa, H. Koshinaka, D. Sato, S. Takeda, S. I. Noro, H. Takahashi, R. Kumai, Y. Tokura and T. Nakamura, Nat. Mater., 2009, 8, 342 CrossRef CAS.
Footnotes |
| † Electronic supplementary information (ESI) available: PXRD, TG, emission spectra in solids at room temperature, dielectric permittivity, impedance spectra and CIE coordinates. CCDC 1982923 and 2209474. For ESI and crystallographic data in CIF or other electronic format see DOI: https://doi.org/10.1039/d2ra05947a |
| ‡ These authors contributed equally to this work. |
| This journal is © The Royal Society of Chemistry 2022 |

