 Open Access Article
Activated carbon prepared by co-pyrolysis of waste tobacco straw and waste LDPE mulch film: characterization and application for methylene blue removal†
Tianliang Zhanga,
Wei Xiongb,
Haiyan Zhangb and
Jun Li*a
aSichuan University School of Chemical Engineering, Chengdu, 610000, China. E-mail: lijun@scu.edu.cn; scu_ztl@yeah.net
bSichuan Tobacco Quality Supervision and Testing Station, Chengdu 610000, China
First published on 30th November 2022
Abstract
Efficient and inexpensive sorbents play a key role in removing organic pollutants from water bodies. In this study, a series of high surface area activated carbons (ACs) with excellent adsorption performance was prepared by co-pyrolysis of the waste tobacco straw and the waste low-density polyethylene (LDPE) mulch film. Using the maximum adsorption capacity of methylene blue (MB) as an indicator, the variables such as LDPE content, K2CO3 to raw material ratio, activation time, and activation temperature were optimized. The optimal synthesis conditions were as follows: LDPE content of 40%, K2CO3/raw material ratio of 1![[thin space (1/6-em)]](https://www.rsc.org/images/entities/char_2009.gif) :
:![[thin space (1/6-em)]](https://www.rsc.org/images/entities/char_2009.gif) 2, activation temperature of 900 °C, and activation time of 100 min. The maximum adsorption capacity of MB was up to 849.91 mg g−1. The results of scanning electron microscopy (SEM), X-ray powder diffraction (XRD), Raman, X-ray photoelectron spectroscopy (XPS), and BET showed that the moderate addition of LDPE was beneficial to the pyrolysis of the waste tobacco straw, bringing about the enrichment of surface groups (–OH, –COOH) and increasing its specific surface area and pore volume (up to 1566.7 m2 g−1 and 0.996 cm3 g−1, respectively). The equilibrium data of MB adsorption by the composite activated carbon (PAC) was consistent with the Langmuir isotherm, while the adsorption kinetics were better described by a pseudo-second-order kinetic model. This work reveals the feasibility of LDPE mulch film and waste tobacco straw as potential and inexpensive precursors for preparing high surface area AC adsorbents.
2, activation temperature of 900 °C, and activation time of 100 min. The maximum adsorption capacity of MB was up to 849.91 mg g−1. The results of scanning electron microscopy (SEM), X-ray powder diffraction (XRD), Raman, X-ray photoelectron spectroscopy (XPS), and BET showed that the moderate addition of LDPE was beneficial to the pyrolysis of the waste tobacco straw, bringing about the enrichment of surface groups (–OH, –COOH) and increasing its specific surface area and pore volume (up to 1566.7 m2 g−1 and 0.996 cm3 g−1, respectively). The equilibrium data of MB adsorption by the composite activated carbon (PAC) was consistent with the Langmuir isotherm, while the adsorption kinetics were better described by a pseudo-second-order kinetic model. This work reveals the feasibility of LDPE mulch film and waste tobacco straw as potential and inexpensive precursors for preparing high surface area AC adsorbents.
1 Introduction
Dyeing technology has emerged with the development of human society. Dyestuffs are widely used and applied in paints, cosmetics, textiles, and paper products. Releasing dyestuffs directly without treatment could cause serious pollution to the water environment. Methylene blue (MB) is a basic cationic dye widely used in printing and dyeing due to its strong dyeing ability. High-concentration of MB in water will not only affect the growth of aquatic organisms but also cause liver and digestive system damage in long-term drinkers, nausea, increased heart rate, epilepsy, and other symptoms.1 To treat these printing and dyeing sewage in large quantities and at a low cost, researchers have tried various attempts, such as adsorption,2 photocatalysis,3 oxidation4 and coagulation,5 and membrane separation.6 Compared with other methods, adsorption is simpler, cheaper, and more efficient, resulting in more application prospects.Activated carbon generally has a high specific surface area, diverse surface groups, and developed pore structure, which endows it with strong adsorption capacity. Thus, activated carbon has been regarded as the most common adsorbent used to treat various water pollutants. However, the high regeneration cost of commercial activated carbon has prompted researchers to continue to look for cheaper alternatives. In the past decade, researchers have studied the production of activated carbon from rice husks,7 bagasse,8 bamboo,9 garlic peel,10 cotton stalk,11 hazelnut shell,12 peanut shell,13 Fruit Stones and Nut Shells.14 The advantage of using agricultural by-products for preparing activated carbon is that these raw materials are renewable and potentially less expensive.
China is the largest tobacco producer and consumer in the world,15 and tobacco straw is the most significant by-product of tobacco production. Every year, a large amount of tobacco straw is discarded without reasonable utilization. These wastes contain a lot of nicotine and tar; direct incineration will produce a large amount of toxic and harmful gases, seriously polluting the environment. In addition, LDPE mulch films, the most widely used mulch films worldwide,16 are widely used in tobacco growing processes. These mulch films are often mixed with waste tobacco straw and remain in the soil. If not handled properly, discarded mulch films will damage the soil structure, pollute the land, and reduce crop yields.17 Solving the resource utilization of this mixed waste is a daunting task for researchers. In recent years, some studies on the preparation of AC from tobacco straw have been reported in the literature.18–21 Tobacco straw was proved to be a potential raw material for preparing activated carbon. Activated carbons prepared from tobacco straw were efficient adsorbents for the removal of mercury,22 Cr(VI),23 Cr(III),24 and methylene blue21 from aqueous solutions. However, as far as we know, these studies only focus on tobacco straw, and there is no relevant research on preparing activated carbon adsorbents by mixing LDPE and tobacco straw.
In this study, a composite activated carbon (PAC) was prepared by co-pyrolysis using waste tobacco straw and waste LDPE mulch film. The effect of the addition of LDPE was investigated by characterization methods. In addition, the adsorption mechanism of MB on PAC was investigated by analyzing the adsorption behavior, adsorption isotherms, and adsorption kinetics. The aim was to provide a new efficient and economical adsorbent for organic dyes in wastewater.
2 Experimental
2.1 Materials
The waste tobacco straw and waste LDPE mulch film were provided by the Sichuan Provincial Tobacco Bureau Quality Supervision Station. It was cleaned, dried, pulverized, and then passed through a 100-mesh sieve. K2CO3 and HCl were purchased from Kelong Chemical Co., Ltd (Chengdu, China). MB was acquired from Jinsan Chemical Reagent Co., Ltd (Chengdu, China). The chemical structure of the dye is shown in Fig. 1. All other chemicals were used without further purification.2.2 Single-step activation for the preparation of activated carbon
Tobacco straw powder, LDPE powder, and solid K2CO3 were added to the mortar in proportions, then ground thoroughly to make a homogeneous mixture. The mixed sample was placed in a boat-shaped crucible, heated to a predetermined temperature in a tube under the protection of an argon atmosphere, and thermostated for some time, then cooled to room temperature. Subsequently, the samples were transferred to beakers and stirred with dilute hydrochloric acid for several hours to remove the remaining activation agents and metal ions, and then washed with deionized water until the pH of the wash solution reached 6–7.Activated carbon samples with different LDPE contents were labeled as PAC-x (x is the LDPE content, = 0, 0.2, 0.4, 0.6, 0.8). The LDPE content (ω) can be calculated by the following form:
 | (1) |
2.3. Characterization
The morphology and structure of the activated carbon were characterized by scanning electron microscopy (SEM, SU3500, Japan), equipped with EDX (energy dispersive X-ray) system to perform the elemental mapping and energy-dispersive spectrum (EDS) characterization. The crystalline structure of the samples was analyzed by the X-ray diffraction (XRD, Empyrean, Holland) in the 2θ range of 10–80° with a Cu-Kα X-ray source (λ = 1.54 Å). The graphitization degree was characterized by Raman spectrometer (LabRAM HR, French), and the Raman filter was 532 nm. The surface chemical composition was investigated by the X-ray photoelectron spectroscopy (XPS, AXIS Supra, UK) using monochromatic Al kα radiation. The specific surface area and pore size distribution was analyzed by an automatic specific surface area and porosity analyzer (ASAP 2460, USA) at 77 K. The concentration of methylene blue was determined by a double-beam UV spectrophotometer (MAPADA P5, China) at 665 nm.2.4. MB adsorption experiments
The adsorption experiments were carried out in a 100 mL stoppered conical flask, which contained 20 mg of activated carbon and 50 mL of MB solution (500 mg L−1). Then the mixture was placed in the thermostatic oscillator, oscillating at 150 rpm at 25 °C for 12 h to reach the adsorption equilibrium of the solid–solute mixture. The flask was removed from the thermostatic oscillator, and the final dye concentration in the solution was analyzed. The samples were filtered prior to analysis to minimize interference of the carbon fines with the analysis. The sampling and testing procedure were repeated three times, and the deviation of the data was expressed as an error bar.The amount of adsorption at equilibrium, qe (mg g−1), was calculated by:
 | (2) |
2.5. MB adsorption kinetic studies
The procedures of kinetic experiments were basically identical to those of equilibrium tests. The stock solution of 1000 mg L−1 of MB was prepared using MB reagent and deionized water. Different concentrations of MB solutions were prepared by diluting these stock solutions. The adsorbate–adsorbent mixtures were collected at preset time intervals, and the concentration of the dye was measured after filtration. The amount of adsorption at time t, qt (mg g−1) was calculated by the following formula:
 | (3) |
3 Results and discussion
3.1 Optimization of preparation parameters
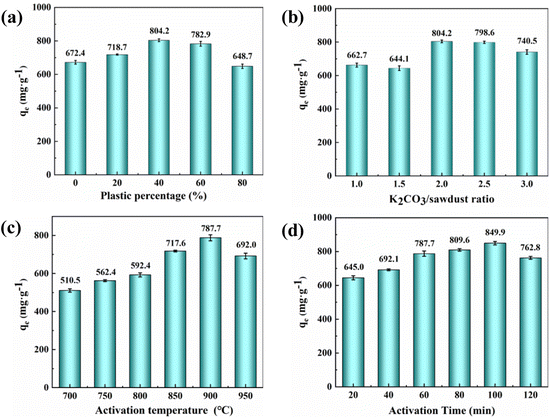
The difference in adsorption capacity may be related to the synergistic effect of LDPE in co-pyrolysis. Co-pyrolysis of biomass with polymers can improve the properties of biochar and increase its adsorption capacity.25 According to the TGA measurement (Fig. S1), the decomposition temperature range of tobacco straw was between 180 °C and 510 °C, while the pyrolysis temperature of LDPE was 400–500 °C. The pyrolysis temperature of tobacco straw is lower than that of LDPE. When the mixture was fed into the tube furnace, the tobacco straw was decomposed first, and some free radicals, such as OH radical, were generated.27 These active free radicals could react with the LDPE to accelerate the pyrolysis of LDPE.26,28 The LDPE was an excellent hydrogen donor during co-pyrolysis reactions, which promoted the release of small-molecule volatile from tobacco straw by the radical interaction,29,30 resulting in cavities on the surface and inside the activated carbon. These cavities could provide more adsorption sites for MB adsorption, so the adsorption capacity of activated carbon was improved. However, when the LDPE content was too high, the synergistic effect would lead to a high weight loss of activated carbon,31 resulting in the collapse of the formed cavities and causing a decrease in adsorption capacity.
![[thin space (1/6-em)]](https://www.rsc.org/images/entities/char_2009.gif) :
:![[thin space (1/6-em)]](https://www.rsc.org/images/entities/char_2009.gif) 1 to 2
1 to 2![[thin space (1/6-em)]](https://www.rsc.org/images/entities/char_2009.gif) :
:![[thin space (1/6-em)]](https://www.rsc.org/images/entities/char_2009.gif) 1. It reached the maximum value when the ratio was 2
1. It reached the maximum value when the ratio was 2![[thin space (1/6-em)]](https://www.rsc.org/images/entities/char_2009.gif) :
:![[thin space (1/6-em)]](https://www.rsc.org/images/entities/char_2009.gif) 1. The adsorption capacity of MB decreased when the K2CO3 ratio was further increased to 2.5
1. The adsorption capacity of MB decreased when the K2CO3 ratio was further increased to 2.5![[thin space (1/6-em)]](https://www.rsc.org/images/entities/char_2009.gif) :
:![[thin space (1/6-em)]](https://www.rsc.org/images/entities/char_2009.gif) 1.
1.The change in adsorption capacity is related to the activation of K2CO3, and a similar trend has been reported by other researchers.32,33 The process of mixed waste activation in a high temperature inert gas atmosphere may include the following redox reactions:34
| K2CO3 → K2O + CO2 | (4) |
| K2CO3 + 2C → 2K + 3CO | (5) |
| K2O + C → 2K + CO | (6) |
During the activation process, K2CO3 first decomposed into CO2 and K2O. Subsequently, the K2O and the rest of K2CO3 reacted with the carbon atoms in the mixed waste to form potassium atoms and carbon monoxide.35 The porous structure was formed on the surface of the activated carbon by the collaborative results of chemical activation, physical activation (CO2),36 and the expansion of the carbon lattices by metallic potassium.37,38 The K2CO3 activation promoted the generation of pores on activated carbon, which brought about an increase of the adsorption capacity. It is worth noting that if the K2CO3 ratio was too high, more potassium atoms would enter the carbon lattice, causing the collapse of the pore structure.35 It would result in a reduction in the adsorption capacity of the activated carbon.
Temperature is also important in preparing activated carbon and can affect its adsorption capacity. Since K2CO3 activation requires a certain temperature, increasing the activation temperature facilitates the activation process. When the activation temperature exceeded the boiling point of metallic potassium (762 °C), a large amount of potassium vapor was generated and entered the internal pores, promoting the opening of the carbon lattice and increasing the pore volume of the activated carbon.39 On the other hand, as the temperature increased, the cross-linked structures in activated carbon would also gradually decompose.40 It would release the blocked pores, causing an increase in specific surface area and pore volume. This may be why the adsorption capacity of activated carbon on MB increases gradually with temperature in the early stage. As the temperature continued to increase (950 °C), the pore size continued to expand, leading to the collapse of the pore structure and a decrease in adsorption capacity.
The reason may be that the K2CO3 needs enough time to pyrolyze into K2O and CO2 and give full play to the activation effect.41 Extending the activation time is helpful for to the reaction of K2CO3 with C atoms, making the carbon material produce a large number of pore structures.42 Therefore, when the activation time was extended from 20 min to 100 min, the adsorption capacity of activated carbon for MB was significantly improved. Continuing to extend the activation time (120 min), the K2CO3 would react with the carbon layer inside the pore, and the adjacent pore wall was destroyed, causing the collapse of the activated carbon pore and the decrease of adsorption capacity.42
3.2 Material characterization for PAC
Based on the above discussion, it was clear that the adsorption capacity of the prepared activated carbons was affected by the LDPE content, K2CO3/raw material ratio, activation temperature, and activation time. In order to study the effect of LDPE content on activated carbon, other factors were controlled as optimal conditions: K2CO3/raw material ratio of 2![[thin space (1/6-em)]](https://www.rsc.org/images/entities/char_2009.gif) :
:![[thin space (1/6-em)]](https://www.rsc.org/images/entities/char_2009.gif) 1, activation temperature of 900 °C, and activation time of 100 min.
1, activation temperature of 900 °C, and activation time of 100 min.
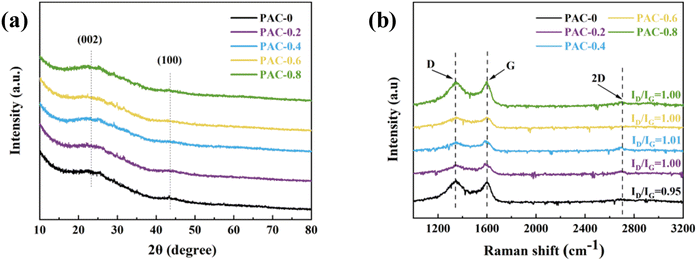
Raman can show the difference in the graphitization degree of the samples more clearly. As shown in Fig. 4(b), there are two drum peaks and one obtuse peak located at 1350 cm−1, 1585 cm−1, and 2760 cm−1, corresponding to the D peak (disorder peak), G peak (graphite peak) and 2D peak, respectively. The 2D peak is used to characterize the sample's stacking pattern of C atoms.46 The ratio of D and G peak intensities (ID/IG) can be used to evaluate the degree of graphitization and defects in carbon material,47 with larger values of ID/IG representing a higher degree of material defects. With the addition of LDPE, the ID/IG ratio of the samples increased from 0.95 to 1.00–1.01. The increasing trend is also accompanied by an increase in the peak intensity of the 2D band. It indicates that the addition of LDPE would promote the pyrolysis process, resulting in the destruction of the ordered initially graphitized structure, thus, the formation of more defects, which would provide more active sites and improve its adsorption performance.
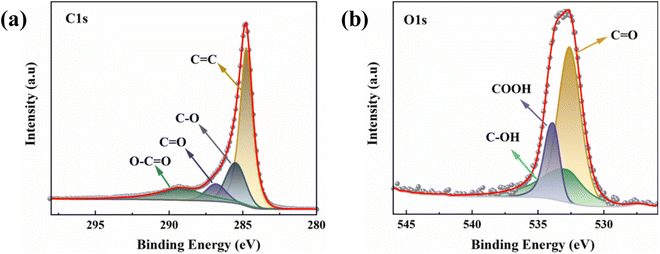
To further reveal the elemental binding on the activated carbon surface, the XPS was used. The overall peak in C 1s XPS spectrum of PAC-0.4 can be deconvoluted to four individual C peaks components: C![[double bond, length as m-dash]](https://www.rsc.org/images/entities/char_e001.gif) C (248.7 eV), C–O (285.6 eV), C
C (248.7 eV), C–O (285.6 eV), C![[double bond, length as m-dash]](https://www.rsc.org/images/entities/char_e001.gif) O (286.9 eV), and O–C
O (286.9 eV), and O–C![[double bond, length as m-dash]](https://www.rsc.org/images/entities/char_e001.gif) O (289.3 eV) (Fig. 5(a)). Likewise, the overall peak in O 1s XPS spectrum of PAC-0.4 can also be deconvoluted to three individual O peaks components: C
O (289.3 eV) (Fig. 5(a)). Likewise, the overall peak in O 1s XPS spectrum of PAC-0.4 can also be deconvoluted to three individual O peaks components: C![[double bond, length as m-dash]](https://www.rsc.org/images/entities/char_e001.gif) O (532.5 eV), C–OH (533.2 eV), and COOH (533.8 eV) (Fig. 5(b)). Studies have shown that when activated carbon was placed in an aqueous solution, the acidic surface groups on the carbon surface were susceptible to ionization, producing H ions directed toward the liquid phase, leaving the carbon surface with negatively charged sites.48,49
O (532.5 eV), C–OH (533.2 eV), and COOH (533.8 eV) (Fig. 5(b)). Studies have shown that when activated carbon was placed in an aqueous solution, the acidic surface groups on the carbon surface were susceptible to ionization, producing H ions directed toward the liquid phase, leaving the carbon surface with negatively charged sites.48,49
>C–OH ⇌ >C![[double bond, length as m-dash]](https://www.rsc.org/images/entities/char_e001.gif) O + H+ + e− O + H+ + e−
| (7) |
| –COOH ⇌ –COO + H+ + e− | (8) |
>C![[double bond, length as m-dash]](https://www.rsc.org/images/entities/char_e001.gif) O + e+ ⇌ >C–O− O + e+ ⇌ >C–O−
| (9) |
This makes it easier for the activated carbon to adsorb cationic molecules by electrostatic interaction and also reasonably explains the extremely high adsorption capacity of PAC on cationic MB.
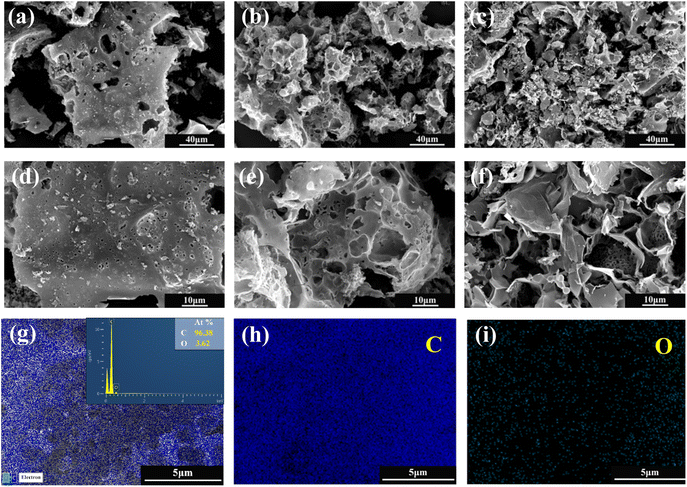
Fig. 6(a) shows the nitrogen (N2) adsorption isotherms of three samples prepared with different LDPE contents, and all curves exhibit a mixed I/IV pattern. Under the condition of very low relative pressures (P/P0 < 0.01), the N2 adsorption of the material increased rapidly with increasing relative pressure. When the relative pressure increased to (0.1 < P/P0 < 0.5), the growth rate of N2 adsorption of the material gradually slowed down, and a plateau appeared in the adsorption curve. That coincides with the type I adsorption curve and proves that the material has a typical microporous structure; when the relative pressure continued to increase to (0.5 < P/P0 < 0.9), H4 hysteresis loops appeared in all isothermal curves, which coincided with the IV adsorption curves, indicating the presence of a large number of mesoporous structures. The hysteresis loops of PAC-0.4 and PAC-0.8 were more obvious than those of PAC-0, indicating that the number of mesopores may be more abundant. The pore size distributions of them are shown in Fig. 6(b), the micropores and mesopores are all distributed, and the mesopores are mainly distributed at 3–8 nm. Table 1 lists the specific surface areas (SSAs) and other porous structure parameters for PAC-0, PAC-0.4, and PAC-0.8. PAC-0.4 has the largest specific surface area among the three samples, and LDPE obviously has an important effect on promoting the formation of porous structures. It can be seen that with the increase of LDPE content, the pore capacity of PAC-0.4 compared with PAC-0 micropores and mesopores both increased, indicating that LDPE can not only induce the activated carbon to produce new pores but also induce the micropores further to expand and form mesopores. The high Vmeso and the sharply reduced Vmicro exhibited by PAC-0.8 proves that too much LDPE will cause excessive pyrolysis, and some pore walls will collapse, as evidenced by the SEM image of PAC (Fig. 2).
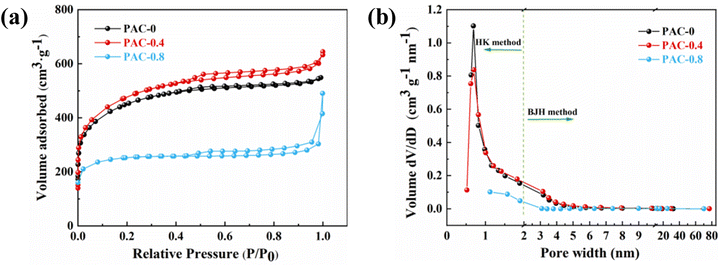 | ||
| Fig. 6 (a) Nitrogen adsorption–desorption isotherms; (b) pore size distribution for PAC-0, PAC-0.4, and PAC-0.8. | ||
| Samples | SBET (m2 g−1) | Vtotal (cm3 g−1) | Vmeso (cm3 g−1) | Vmicro (cm3 g−1) | Vmeso/Vtotal (%) |
|---|---|---|---|---|---|
| PAC-0 | 1454.4954 | 0.847902 | 0.180635 | 0.693148 | 21.30 |
| PAC-0.4 | 1566.7029 | 0.996131 | 0.306523 | 0.731457 | 30.77 |
| PAC-0.8 | 773.1014 | 0.758242 | 0.372582 | 0.389571 | 49.14 |
3.3. Adsorption kinetic study
The adsorption kinetics describes the adsorption rate of the adsorbent to the target pollutant, which is of great significance for exploring the adsorption mechanism. Pseudo-first-order (PFO)51 and pseudo-second-order (PSO)52 kinetic models were used to fit the experimental data to understand the MB adsorption process by evaluating the kinetic adsorption parameters. The model equation is as follows:| ln(qe − qt) = ln(qe) − k1t | (10) |
 | (11) |
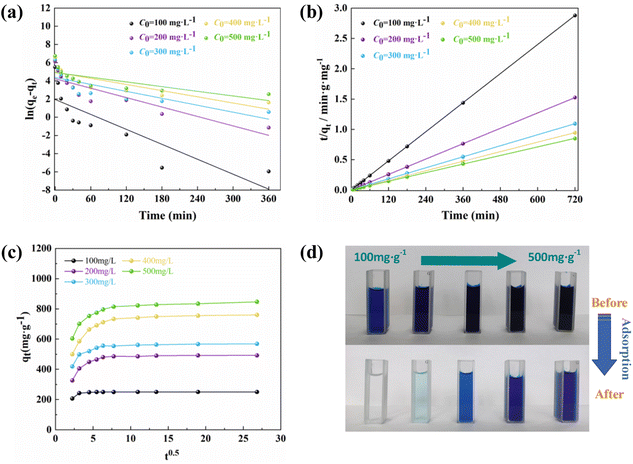
From Fig. 7 and Table 2, it can be concluded that the proposed second-order model has a higher correlation coefficient (R2 > 0.999), a better fit, and the predicted adsorption values deviate less from the experimental values. Therefore, the adsorption process of MB on PAC-0.4 followed the proposed second-order kinetic model, which was dominated by chemisorption. The results obtained in this study are consistent with the previously reported studies on the adsorption of MB on other ACs.
| C0 (mg L−1) | Pseudo-first-order | Pseudo-second-order | Experimental values | ||||
|---|---|---|---|---|---|---|---|
| qe1 (mg g−1) | k1 (min−1) | R2 | qe2 (mg g−1) | k2 (g mg−1 min−1) | R2 | qe (mg g−1) | |
| 100 | 7.0995 | 0.0274 | 0.7204 | 250.0001 | 0.0143 | 1 | 249.9951 |
| 200 | 69.1232 | 0.0173 | 0.7810 | 473.9336 | 0.0012 | 0.9999 | 471.8685 |
| 300 | 79.5861 | 0.0127 | 0.6559 | 657.8947 | 0.0011 | 1 | 658.4287 |
| 400 | 143.3000 | 0.0113 | 0.7056 | 763.3588 | 0.0004 | 0.9999 | 760.4105 |
| 500 | 136.2389 | 0.0086 | 0.5677 | 847.4576 | 0.0004 | 0.9999 | 846.7742 |
The adsorption of MB on PAC may include several steps such as external diffusion and intraparticle diffusion. The pseudo-first- and second-order kinetic models could not determine the diffusion mechanism. In order to further investigate the adsorption process, an intraparticle diffusion model was used to fit the process of MB adsorption by PAC. The intraparticle diffusion model equation is expressed as:
| qt = kit0.5 + c | (12) |
Fig. 8(d) shows that MB could be completely removed by PAC-0.4 at low concentrations, so we predict that PAC-0.4 can be applied to real MB contamination adsorption in the future.
3.4. Isotherm study
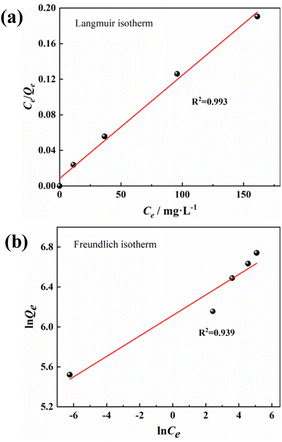
Adsorption isotherms are often used to describe adsorbates–adsorbents interactions and the equilibrium distribution of adsorbate molecules in the solid–liquid phase.53 The experimental data were further analyzed using Langmuir54(13) and Freundlich55 (15) isotherm models to evaluate the interaction and maximum adsorption of MB dyes by activated carbon.
 | (13) |
 | (14) |
 | (15) |
The Langmuir adsorption model assumes that the adsorption capacity of a solid adsorbent is limited. The same active sites are evenly distributed over the adsorbent surface, and each activation site is bound to only one adsorbate molecule. In contrast, the Freundlich adsorption model considers the existence of different types of active sites with different adsorption capacities on the adsorbent surface, describing a multilayer adsorption process on adsorbent molecules. As can be seen from the parameters in Fig. 8 and Table 3, the PAC adsorption process matches the Langmuir model better (R2 = 0.993), and the process is single molecular layer adsorption. The maximum adsorption amount was 862.07 mg g−1, which is very similar to the actual experimental (849.91 mg g−1) and kinetically fitted values (847.45 mg g−1).
| Model | Parameter | |
|---|---|---|
| Langmuir | b | 0.137 |
| Q0 | 862.069 | |
| R2 | 0.993 | |
| RL | 0.0143∼0.0678 | |
| Freundlich | KF | 452.691 |
| n | 9.75 | |
| R2 | 0.94 |
In addition, the separation factor RL is an important Langmuir isotherm parameter that can be used to predict the interaction of the adsorbent with the adsorbate in an aqueous solution. The magnitude of the RL value reflects the type of adsorption process: unfavorable (RL > 1); Linear (RL = 1); favorable (0 < RL < 1); irreversible (RL = 0). The RL for PAC adsorption of MB is 0.0143–0.0678, indicating that the adsorption process occurred readily and was irreversible.
Table 4 compares the surface area and adsorption capacity of several bio-sorbents with PAC for MB dyes. The PAC-0.4 possesses a higher specific surface area and a stronger adsorption capacity for MB dye compared to other ACs prepared from lignocellulosic biomass. Therefore, the activated carbon prepared from waste tobacco straw and waste LDPE mulch film in this study is an efficient adsorption material for removing hardly degradable organics contaminants in water.
| Raw materials | SBET (m2 g−1) | Adsorption capacity (mg g−1) | References |
|---|---|---|---|
| Tobacco straw and LDPE mulch film | 1566.70 | 849.91 | This work |
| Globe artichoke | 2038 | 780 | 56 |
| Sucrose | 1534 | 704.2 | 57 |
| Rice husks | 2028 | 578 | 58 |
| Potato residue | 1357 | 540 | 58 |
| Hazelnut shells | 1335 | 524 | 59 |
| Oil palm | 707.79 | 312.5 | 60 |
| Bamboo | 1323 | 286.1 | 9 |
| Karanj fruit hulls | 849.66 | 239.4 | 61 |
| Mangosteen peel | 1622 | 1192 | 62 |
3.5. MB adsorption mechanism
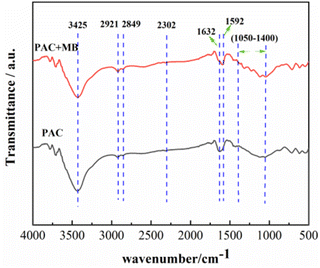
FTIR analysis of PAC-0.4 before and after MB adsorption was performed to explore its adsorption mechanism for MB. Fig. 9 shows the FTIR spectra recorded for the samples in the range from 500 to 4000 cm−1. The broad absorption peak around 3425 cm−1 is attributed to the O–H stretching vibration. The band at 2921 cm−1 and its shoulder at 2849 cm−1 are attributed to νC–H and δC–H (ν = stretching and δ = bending) absorption bands, respectively, which indicates the presence of methyl and methylene groups in the precursor.63 The peak around 2302 cm−1 corresponds to the stretching vibration peak of the O–H bond in the COOH functional group,64 while the characteristic peak at 1632 cm−1 is ascribed to the –C![[double bond, length as m-dash]](https://www.rsc.org/images/entities/char_e001.gif) C– stretching vibration. After MB adsorption, the peak around 3425 cm−1 caused by O–H stretching vibration became narrower and the peak intensity was decreased, while the C
C– stretching vibration. After MB adsorption, the peak around 3425 cm−1 caused by O–H stretching vibration became narrower and the peak intensity was decreased, while the C![[double bond, length as m-dash]](https://www.rsc.org/images/entities/char_e001.gif) C peak at 1632 cm−1 was shifted to 1592 cm−1. In addition, many small peaks occurred between 1050 cm−1 and 1400 cm−1, which is attributed to the MB, indicating that the MB dye cation was adsorbed to the surface of PAC. No new characteristic peaks appear before and after adsorption, indicating that the adsorption of MB by PAC-0.4 is physical adsorption.
C peak at 1632 cm−1 was shifted to 1592 cm−1. In addition, many small peaks occurred between 1050 cm−1 and 1400 cm−1, which is attributed to the MB, indicating that the MB dye cation was adsorbed to the surface of PAC. No new characteristic peaks appear before and after adsorption, indicating that the adsorption of MB by PAC-0.4 is physical adsorption.
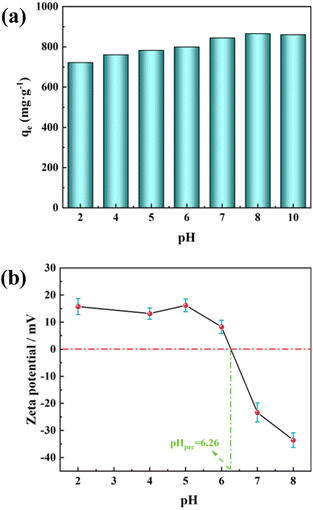
Furthermore, many researchers report that the adsorption process of MB is significantly influenced by the solution pH.65–67 Therefore, we investigated the relationship between the adsorption of MB by PAC and the pH of the solution. The maximum MB adsorption capacity of PAC-0.4 under different solution pH is shown in Fig. 10(a). It can be seen that increasing the solution pH contributes to improving the adsorption capacity, with a significant increase in adsorption capacity as the pH increases from 6 to 8. This may be related to the pHpzc of PAC, defined as the pH at which the net surface charge is zero. Fig. 10(b) shows that the pHpzc of PAC-0.4 is 6.26. When the solution pH < pHpzc, the adsorbent reacts as a positive surface, and as a negative surface when the solution pH > pHpzc.68 The inhibition of MB adsorption under low pH conditions can be attributed to the electrostatic repulsion between the positively charged adsorbent surface and the cationic MB molecules, and the presence of excess H ions competing with dye cations for the adsorption sites. As the pH increases, the number of hydroxyl groups on the surface of activated carbon increases, thus increasing the number of minus charge sites.69 With the negative charge neutralizes the positive charge on the surface, a negative charge is eventually generated on the adsorbent surface. The increased electrostatic attraction between PAC and MB facilitates the adsorption of MB by PAC.
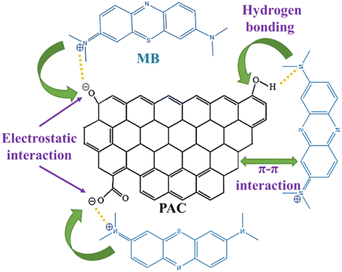
According to FTIR spectra, combined with BET, SEM characterization and adsorption experiments, the adsorption mechanism of PAC for MB is analyzed: (i) after adsorption, the peak of 3425 cm−1 caused by O–H stretching vibration is significantly reduced, indicating that oxygen-containing groups on the surface of PAC, such as – COH, can adsorb some MB molecules through hydrogen bonding. (ii) Adsorption of MB on PAC is favored by the alkaline conditions, indicating that the positively charged MB molecules are easily adsorbed to the negatively charged PAC surface by electrostatic interaction. (iii) MB is an ideal planar molecule, and the aromatic backbone of MB dye can easily interact with PAC through π–π stacking,70 contributing to the adsorption of MB onto the PAC surface. The possible MB adsorption mechanism onto PAC is schematically illustrated in Fig. 11.
4. Conclusions
In this study, a series of activated carbon adsorbents (PAC) with a high specific surface area were prepared by co-pyrolysis of waste LDPE mulch film with waste tobacco straw. The addition of LDPE promotes the pyrolysis of tobacco straw, which brings higher specific surface area and larger pore volume. The sample prepared under optimal conditions has a maximum surface area of 1566.7 m2 g−1 and is distributed with active groups favorable for MB adsorption. The maximum adsorption of MB is 849.91 mg g−1, and the adsorption follows the adsorption pseudo-second-order kinetic model and Langmuir adsorption model. Compared with other reported biomass-activated carbon, PAC has higher adsorption efficiency and is an effective and economical material for removing dye contaminants from water. Based on the results of this work, waste LDPE mulch film and waste tobacco straw can be used as potential precursors for preparing AC with good surface properties and effective adsorption for numerous environmental applications.Conflicts of interest
There are no conflicts to declare.Acknowledgements
This work is supported by China National Tobacco Corporation Sichuan Province Science and Technology Program Project (SCYC201918).References
- A. Hassan, A. Abdel-Mohsen and M. M. Fouda, Carbohydr. Polym., 2014, 102, 192–198 CrossRef CAS PubMed.
- A. B. Albadarin, M. N. Collins, M. Naushad, S. Shirazian, G. Walker and C. Mangwandi, Chem. Eng. J., 2017, 307, 264–272 CrossRef CAS.
- M. Nawi, S. Sabar, A. Jawad and W. W. Ngah, Biochem. Eng. J., 2010, 49, 317–325 CrossRef CAS.
- Z. Eskandari, A. Talaiekhozani, M. R. Talaie and F. Banisharif, J. Environ. Manage., 2019, 231, 297–302 CrossRef CAS PubMed.
- N. d. C. L. Beluci, G. A. P. Mateus, C. S. Miyashiro, N. C. Homem, R. G. Gomes, M. R. Fagundes-Klen, R. Bergamasco and A. M. S. Vieira, Sci. Total Environ., 2019, 664, 222–229 CrossRef CAS PubMed.
- S. S. Shenvi, A. M. Isloor, A. F. Ismail, S. J. Shilton and A. Al Ahmed, Ind. Eng. Chem. Res., 2015, 54, 4965–4975 CrossRef CAS.
- N. Yalçin and V. Sevinç, Carbon, 2000, 38, 1943–1945 CrossRef.
- W. Tsai, C. Chang, M. Lin, S. Chien, H. Sun and M. Hsieh, Chemosphere, 2001, 45, 51–58 CrossRef CAS PubMed.
- Q.-S. Liu, T. Zheng, N. Li, P. Wang and G. Abulikemu, Appl. Surf. Sci., 2010, 256, 3309–3315 CrossRef CAS.
- B. Hameed and A. Ahmad, J. Hazard. Mater., 2009, 164, 870–875 CrossRef CAS PubMed.
- H. Deng, L. Yang, G. Tao and J. Dai, J. Hazard. Mater., 2009, 166, 1514–1521 CrossRef CAS PubMed.
- M. Doğan, H. Abak and M. Alkan, J. Hazard. Mater., 2009, 164, 172–181 CrossRef PubMed.
- M. A. Ahmad, M. F. M. Yusop, R. Zakaria, J. Karim, N. K. E. Yahaya, M. A. M. Yusoff, N. H. F. Hashim and N. S. Abdullah, Mater. Today: Proc., 2021, 47, 1246–1251 CAS.
- A. Aygün, S. Yenisoy-Karakaş and I. Duman, Microporous Mesoporous Mater., 2003, 66, 189–195 CrossRef.
- J. Mackay, Br. Med. Bull., 2016, 120, 15–25 CrossRef PubMed.
- P. Tribedi and S. Dey, Environ. Monit. Assess., 2017, 189, 1–8 CrossRef CAS PubMed.
- R. Qi, D. L. Jones, Z. Li, Q. Liu and C. Yan, Sci. Total Environ., 2020, 703, 134722 CrossRef CAS PubMed.
- Z. Ma, B. Jiang, Q. Yuan, L. Cao, L. Liu, J. Tian, Z. Huang, Z. Zong, Z. Lin and P. Zhang, Vib. proced., 2021, 39, 121–127 CrossRef.
- H. Yi, H. Deng, L. Yang, X. L. Tang, Q. Yu and Z. Ye, Sep. Sci. Technol., 2013, 48, 813–819 CrossRef CAS.
- J. Wang, B. Jiang, L. Liu, L. Cao, Q. Yuan, Z. Zong, Z. Huang, J. Tian, P. Zhang, Z. Lin and Z. Ma, J. Phys.: Conf. Ser., 2022, 2160, 012041 CrossRef.
- B. Mudyawabikwa, H. H. Mungondori, L. Tichagwa and D. M. Katwire, Water Sci. Technol., 2017, 75, 2390–2402 CrossRef CAS PubMed.
- H. Zhang, T. Wang, Z. Sui, Y. Zhang, B. Sun and W.-P. Pan, Fuel, 2019, 253, 703–712 CrossRef CAS.
- W. Tang, R. Zeng, Y. Feng, M. Liu, F. Zhang and G. Peng, Chin. J. Environ. Eng., 2015, 9, 5161–5166 CAS.
- J. Pan, J. Jiang and R. Xu, J. Environ. Sci., 2013, 25, 1957–1965 CrossRef CAS PubMed.
- S.-Y. Oh and Y.-D. Seo, Bioresour. Technol., 2016, 218, 77–83 CrossRef CAS PubMed.
- L. Zhou, Y. Wang, Q. Huang and J. Cai, Fuel Process. Technol., 2006, 87, 963–969 CrossRef CAS.
- J. Yang, J. Rizkiana, W. B. Widayatno, S. Karnjanakom, M. Kaewpanha, X. Hao, A. Abudula and G. Guan, Energy Convers. Manage., 2016, 120, 422–429 CrossRef CAS.
- L. Zhou, T. Luo and Q. Huang, Energy Convers. Manage., 2009, 50, 705–710 CrossRef CAS.
- B. Han, Y. Chen, Y. Wu, D. Hua, Z. Chen, W. Feng, M. Yang and Q. Xie, J. Therm. Anal. Calorim., 2014, 115, 227–235 CrossRef CAS.
- V. S. Kaushik, C. S. Dhanalakshmi, P. Madhu and P. Tamilselvam, Environ. Sci. Pollut. Res., 2022, 1–11 Search PubMed.
- A. Dewangan, D. Pradhan and R. Singh, Fuel, 2016, 185, 508–516 CrossRef CAS.
- K. Foo and B. Hameed, Bioresour. Technol., 2012, 111, 425–432 CrossRef CAS PubMed.
- K. Foo and B. Hameed, Chem. Eng. J., 2012, 180, 66–74 CrossRef CAS.
- P. Ehrburger, A. Addoun, F. Addoun and J.-B. Donnet, Fuel, 1986, 65, 1447–1449 CrossRef CAS.
- L. Li, C. Jia, X. Zhu and S. Zhang, J. Cleaner Prod., 2020, 256, 120326 CrossRef CAS.
- T. Yang and A. C. Lua, J. Colloid Interface Sci., 2003, 267, 408–417 CrossRef CAS PubMed.
- L. Yue, Q. Xia, L. Wang, L. Wang, H. DaCosta, J. Yang and X. Hu, J. Colloid Interface Sci., 2018, 511, 259–267 CrossRef CAS PubMed.
- J. Romanos, M. Beckner, T. Rash, L. Firlej, B. Kuchta, P. Yu, G. Suppes, C. Wexler and P. Pfeifer, Nanotechnology, 2011, 23, 015401 CrossRef PubMed.
- L. Li, Y. Lv, J. Wang, C. Jia, Z. Zhan, Z. Dong, L. Liu and X. Zhu, Bioresour. Technol., 2022, 343, 126101 CrossRef CAS PubMed.
- J. i. Hayashi, T. Horikawa, K. Muroyama and V. G. Gomes, Microporous Mesoporous Mater., 2002, 55, 63–68 CrossRef CAS.
- W. Jinzhou, M. Peiyong, Z. Xianwen, X. Xianjun and G. Xiaowei, Acta Energ. Sol. Sin., 2019, 40, 2113–2120 Search PubMed.
- I. I. Gurten, M. Ozmak, E. Yagmur and Z. Aktas, Biomass Bioenergy, 2012, 37, 73–81 CrossRef CAS.
- Y. Zheng, L. Tao, X. Yang, Y. Huang, C. Liu and Z. Zheng, J. Anal. Appl. Pyrolysis, 2018, 133, 185–197 CrossRef CAS.
- Y. Teng, E. Liu, R. Ding, K. Liu, R. Liu, L. Wang, Z. Yang and H. Jiang, Electrochim. Acta, 2016, 194, 394–404 CrossRef CAS.
- Y. Gao, L. Li, Y. Jin, Y. Wang, C. Yuan, Y. Wei, G. Chen, J. Ge and H. Lu, Appl. Energy, 2015, 153, 41–47 CrossRef CAS.
- L. Yang, S. Luo, F. Su, Y. Xiao, Y. Chen and Q. Cai, J. Phys. Chem. C, 2010, 114, 7694–7699 CrossRef CAS.
- Y. Guo, Z.-q. Shi, M.-m. Chen and C.-y. Wang, J. Power Sources, 2014, 252, 235–243 CrossRef CAS.
- B. S. Girgis, A. A. Attia and N. A. Fathy, Colloids Surf., A, 2007, 299, 79–87 CrossRef CAS.
- E. Frackowiak and F. Beguin, Carbon, 2001, 39, 937–950 CrossRef CAS.
- S. J. Gregg, K. S. W. Sing and H. Salzberg, J. Electrochem. Soc., 1967, 114, 279Ca CrossRef.
- S. Lagergren, K. Sven. Vetenskapsakad. Handl., 1898, 24, 1–39 Search PubMed.
- Y.-S. Ho and G. McKay, Chem. Eng. J., 1998, 70, 115–124 CrossRef CAS.
- V. Njoku, K. Foo, M. Asif and B. Hameed, Chem. Eng. J., 2014, 250, 198–204 CrossRef CAS.
- I. Langmuir, J. Am. Chem. Soc., 1916, 38, 2221–2295 CrossRef CAS.
- H. Freundlich, J. Phys. Chem., 1906, 57, 1100–1107 Search PubMed.
- M. Benadjemia, L. Millière, L. Reinert, N. Benderdouche and L. Duclaux, Fuel Process. Technol., 2011, 92, 1203–1212 CrossRef CAS.
- K. C. Bedin, A. C. Martins, A. L. Cazetta, O. Pezoti and V. C. Almeida, Chem. Eng. J., 2016, 286, 476–484 CrossRef CAS.
- Y. Chen, S.-R. Zhai, N. Liu, Y. Song, Q.-D. An and X.-W. Song, Bioresour. Technol., 2013, 144, 401–409 CrossRef CAS PubMed.
- E. Unur, Microporous Mesoporous Mater., 2013, 168, 92–101 CrossRef CAS.
- K. Foo and B. Hameed, Chem. Eng. J., 2011, 166, 792–795 CrossRef CAS.
- M. A. Islam, S. Sabar, A. Benhouria, W. Khanday, M. Asif and B. Hameed, J. Taiwan Inst. Chem. Eng., 2017, 74, 96–104 CrossRef CAS.
- A. Nasrullah, B. Saad, A. Bhat, A. S. Khan, M. Danish, M. H. Isa and A. Naeem, J. Cleaner Prod., 2019, 211, 1190–1200 CrossRef CAS.
- H. Deng, G. Li, H. Yang, J. Tang and J. Tang, Chem. Eng. J., 2010, 163, 373–381 CrossRef CAS.
- H. Li, L. Liu, J. Cui, J. Cui, F. Wang and F. Zhang, RSC Adv., 2020, 10, 14262–14273 RSC.
- A. L. Cazetta, A. M. Vargas, E. M. Nogami, M. H. Kunita, M. R. Guilherme, A. C. Martins, T. L. Silva, J. C. Moraes and V. C. Almeida, Chem. Eng. J., 2011, 174, 117–125 CrossRef CAS.
- O. Üner, Ü. Geçgel and Y. Bayrak, Water, Air, Soil Pollut., 2016, 227, 1–15 CrossRef.
- L. Liu, Y. Lin, Y. Liu, H. Zhu and Q. He, J. Chem. Eng. Data, 2013, 58, 2248–2253 CrossRef CAS.
- E. N. El Qada, S. J. Allen and G. M. Walker, Chem. Eng. J., 2008, 135, 174–184 CrossRef CAS.
- E. N. El Qada, S. J. Allen and G. M. Walker, Chem. Eng. J., 2006, 124, 103–110 CrossRef CAS.
- S. Sahu, S. Pahi, S. Tripathy, S. K. Singh, A. Behera, U. K. Sahu and R. K. Patel, J. Mol. Liq., 2020, 315, 113743 CrossRef CAS.
Footnote |
| † Electronic supplementary information (ESI) available. See DOI: https://doi.org/10.1039/d2ra06153h |
| This journal is © The Royal Society of Chemistry 2022 |


