 Open Access Article
A label-free aptasensor for clenbuterol detection based on fluorescence resonance energy transfer between graphene oxide and rhodamine B
Shuyan Xiao *ab,
Liang Sunab,
Mingqin Kangc and
Zhongping Dongab
aSchool of Materials and Metallurgy, Inner Mongolia University of Science and Technology, Baotou, 014010, China. E-mail: xiaomdj@126.com
bInner Mongolia Key Laboratory of Advanced Ceramic Materials and Devices, Inner Mongolia University of Science and Technology, Baotou 014010, China
cChangchun Customs Technology Center, Changchun 130062, China
First published on 15th November 2022
Abstract
A novel label-free aptasensor for the specific detection of clenbuterol was developed through the fluorescence resonance energy transfer (FRET) mechanism by using an aptamer as the target recognition element, rhodamine B (RhoB) as the fluorescence probe and graphene oxide (GO) as the fluorescence quencher. In the absence of clenbuterol, the aptamer was adsorbed on the surface of GO, preventing the interaction between RhoB and GO, and a high fluorescence signal was obtained. In the presence of clenbuterol, the aptamer specially bound to clenbuterol with a high affinity and detached from the surface of GO, while positively charged rhodamine B could be electrostatically adsorbed onto the surface of GO, thus quenching the fluorescence. By comparing the fluorescence intensity before and after the addition of clenbuterol, a simple and fast fluorescence assay for clenbuterol was established with a detection range of 100–700 nM and a detection limit of 9.6 nM. Moreover, the proposed method was successfully applied in the determination of clenbuterol in pork samples with recoveries in the range of 96.75–104.91% and a relative standard deviation of less than 5.67%. Because of its easy operation, fast response, low cost and competitive analytical performance, this method is a promising candidate for the detection of clenbuterol and can be extended to the detection of other targets by changing the corresponding aptamers.
1. Introduction
Clenbuterol is a β-adrenergic agonist that was originally developed for the treatment of asthma.1,2 Currently, it has been illegally used as a feed additive to increase lean muscle growth and decrease fat deposition for livestock and poultry.2 A prolonged accumulation of clenbuterol in animal tissues may cause severe threats to human health, leading to nausea, headache, dizziness, palpitations, fatigue, chills, arrhythmia and muscular tremors.3–5 In order to ensure the safety of animal derived food, maximum residue limits (MRLs) of 0.2 ppb in fat and muscle and 0.6 ppb in liver and kidney were set for clenbuterol by the Food and Agriculture Organization of the United Nations.6 Some countries, including the European Union and China, have banned the use of clenbuterol in animal production.7 However, it is still illegally used in livestock as an animal growth enhancer due to economic reasons. In order to ensure food safety, the regular screening and monitoring of clenbuterol residues is necessary.To date, a broad range of analytical techniques have been developed to detect and monitor clenbuterol, such as chromatographic approaches, electrochemical methods, immunoassays etc. Chromatographic approaches, including high-performance liquid chromatography (HPLC),8,9 liquid chromatography-tandem mass spectrometry (LC-MS/MS)10 and gas chromatography-tandem mass spectrometry (GC-MS-MS).11 These methods are very effective and accurate, but expensive instruments and experienced personal requirements greatly limit their applications. In addition, the associated use and release of abundant organic solvents may cause environment pollution. Electrochemical methods have the advantages of a fast response, high sensitivity and easy operation, but the working electrode always needs to be modified with different materials to improve the selectivity and effectiveness of the methods. The modification process is complicated and time-consuming.1,12–14 Immunoassays, including enzyme-linked immunosorbent assay (ELISA),15 fluorometric immunoassay (FIA),16,17 and electrochemical immunoassay (ECIA),18,19 have the advantages of being simple, fast, highly sensitive and having good selectivity. However, the immunoassay methods are developed based on high-affinity and highly selective monoclonal or polyclonal antibody, and the preparation of a specific antibody is expensive, complicated and time-consuming. Moreover, the stability of antibodies is susceptible to pH, temperature and other environmental factors.20 Therefore, scientists have made great efforts to find alternatives to antibodies.
Aptamers, also known as chemical antibodies, are short chains of single-stranded DNA or RNA oligonucleotides selected from a random-sequence library by the process known as selective evolution of ligands by exponential enrichment (SELEX), which can bind to various targets with high specificity and affinity.21,22 Aptamers, to a large extent, overcome the shortcomings of antibodies. With the advantages of a small size, low production cost, easy synthesis and modification, high stability, small batch-to-batch variability, aptamer-based biosensors have been widely developed in recent years for applications in environmental monitoring, food analysis and clinical diagnostics.21–23
Aptamers as recognition elements provide new insights into the detection and analysis of clenbuterol. However, since the sequences for clenbuterol binding aptamers have been screened, few studies have been carried out for clenbuterol detection, such as electrochemical,24,25 fluorescent,20 colorimetric2,26 and surface-enhanced Raman spectroscopic (SERS) biosensors.27 Many of these methods require a direct labeling process of the aptamer which results in an increased cost of synthesis and may decrease the binding selectivity and affinity of the aptamer. Hence, it is of great importance to explore label-free, simple, rapid and sensitive detection methods for clenbuterol.
In recent years, fluorescence sensors have gained much attention from researchers due to their simplicity, easy operation, quick response and high sensitivity.28,29 Graphene oxide (GO), a two-dimensional carbon nanomaterial with a large specific surface area, has been widely used in fluorescence sensing systems as a fluorescence quencher. The fluorescence quenching mechanisms have been proposed to be associated with a fluorescence resonance energy transfer process.30 Moreover, GO can significantly interact with single stranded DNA through hydrophobic interactions and π–π stacking between hexagonal cells of GO and DNA bases.31
Herein, a sensitive clenbuterol (CLB) detection method was established by using an aptamer as the recognition element, rhodamine B (RhoB) as the fluorescence probe and GO as the fluorescence quencher. The sensing strategy of the fluorescent aptasensor is depicted in Scheme 1. Without clenbuterol, aptamers were adsorbed on the surface of GO through π–π stacking interactions between nucleotide bases and the carbon network, preventing GO from quenching RhoB, and a bright fluorescence was present. Upon the addition of clenbuterol, the formation of a clenbuterol/aptamer complex resulted in the detachment of the aptamer from the surface of GO, and the fluorescence of RhoB was significantly quenched due to fluorescence resonance energy transfer between RhoB and GO. Therefore, clenbuterol could be readily detected by monitoring the change of the fluorescence signal of RhoB from “on” to “off”. The proposed approach eliminates the laborious and expensive process of DNA labeling and modification, and the detection procedure was simple and fast.
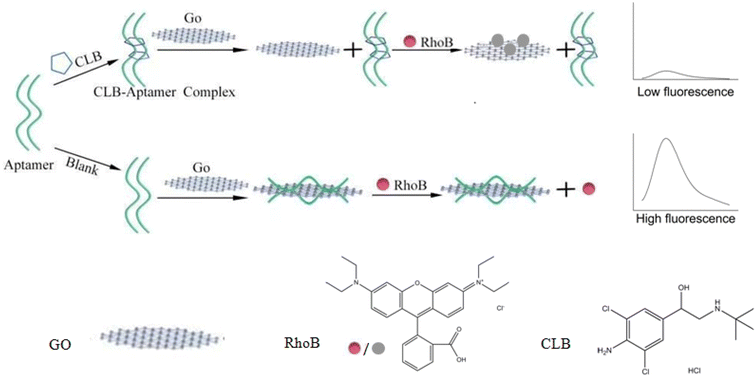 | ||
| Scheme 1 Schematic illustration of a clenbuterol aptasensor based on fluorescence resonance energy transfer between graphene oxide and rhodamine B. | ||
2. Materials and methods
2.1. Materials and reagents
The clenbuterol binding aptamer, 5′- AGC AGC ACA GAG GTC AGA TGT CAT CTG AAG TGA ATG AAG GTA AAC ATT ATT TCA TTA ACA CCT ATG CGT GCT ACC GTG AA-3′,20 was synthesized by Sangon Biotech (Shanghai) Co., Ltd. Clenbuterol hydrochloride, salbutamol sulfate, terbutaline hemisulfate salt and dopamine hydrochloride were purchased from Shanghai Aladdin Biochemical Technology Co., Ltd. Tris was purchased from Tianjin Kemiou Chemical Reagent Co., Ltd. Rhodamine B was purchased from Tianjin Beilian Fine Chemicals Development Co., Ltd. Graphene oxide was purchased from Suzhou Tanfeng Graphene Technology Co., Ltd.2.2. Measurement procedure
A general analysis for clenbuterol was performed as follows. Twenty microliters of clenbuterol at a final concentration of 0, 100, 200, 300, 400, 500, 600, 700, 800, 900, 1000 nM was mixed with 10 μL of 3 μM clenbuterol aptamer solution, respectively, and incubated for 6 min. Afterwards, 9 μL of 20 mg mL−1 GO was added into the mixture and incubated for 5 min. Subsequently, 9 μL of 40 μM RhoB was added into the above solution and incubated for another 6 min. Finally, 252 μL of Tris (10 mM Tris, pH 6.5) buffer was added and the volume of each sensing system was set as 300 μL. The fluorescence spectra were recorded over the range of 550–650 nm, with an excitation wavelength of 540 nm. The fluorescence intensity at 578 nm in the absence and presence of clenbuterol was recorded as F0 and F, respectively, and the change in fluorescence intensity was calculated as ΔF = F0 − F. The calibration curve for clenbuterol was set up by ΔF versus the concentration of clenbuterol.2.3. Preparation of pork samples
Pork was purchased from a local supermarket and pretreated according to a procedure by Liu et al.2 with slight modifications. One gram of pork was homogenized and then spiked with 20 μL of clenbuterol to concentrations of 3, 6, 9 nmol g−1, and sonicated for 10 min. Then, the samples were blended with 0.49 mL of 0.01 M HCl, sonicated for 2 min and centrifuged at 12![[thin space (1/6-em)]](https://www.rsc.org/images/entities/char_2009.gif) 000 rpm for 10 min. The supernatant was mixed with 0.49 mL of 0.01 M NaOH and centrifuged at 12
000 rpm for 10 min. The supernatant was mixed with 0.49 mL of 0.01 M NaOH and centrifuged at 12![[thin space (1/6-em)]](https://www.rsc.org/images/entities/char_2009.gif) 000 rpm for 10 min. Finally, the supernatant was filtered through a 0.45 μm filtration membrane and collected for further use.
000 rpm for 10 min. Finally, the supernatant was filtered through a 0.45 μm filtration membrane and collected for further use.
3. Results and discussion
3.1. Feasibility of the fluorescent aptasensor
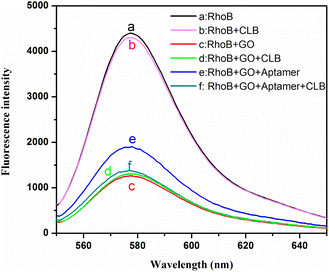
The proposed clenbuterol detection strategy was validated by the fluorescence spectra in Fig. 1. As can be seen, RhoB exhibited strong fluorescence in tris buffer (curve a) and the mixed solution containing RhoB/CLB shows negligible influence on the fluorescence properties of RhoB (curve b). When RhoB and GO were mixed together, the fluorescence decreased dramatically, indicating that positively charged RhoB was adsorbed onto the GO sheets through electrostatic and π–π stacking interactions,32 and efficient FRET occurs (curve c). The fluorescence of RhoB/GO was still very weak in the presence of clenbuterol (curve d). The introduction of the aptamer in the RhoB/GO system resulted in the fluorescence being recovered to a certain extent (curve e), demonstrating that the aptamer can be adsorbed on the surface of GO and protects RhoB from fluorescence quenching. After the addition of clenbuterol, the fluorescence of RhoB/GO/aptamer/CLB decreased to almost the same level as that of RhoB/GO (curve f), indicating that almost all aptamers were removed from the surface of GO by clenbuterol. These results clearly demonstrate that the design in Scheme 1 is feasible, and the quantitative detection of clenbuterol could be easily realized by recording the changes in the fluorescence intensity of RhoB.3.2. Optimization of sensing conditions
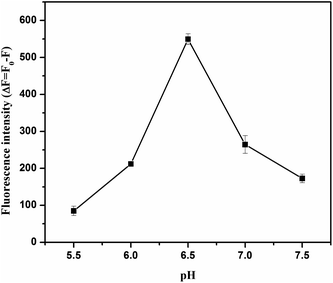
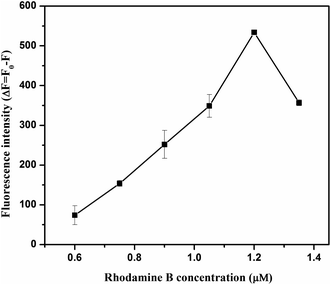
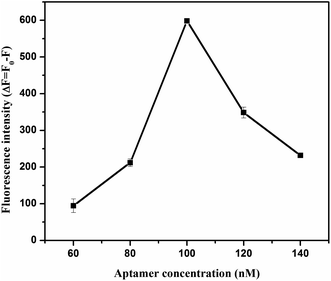
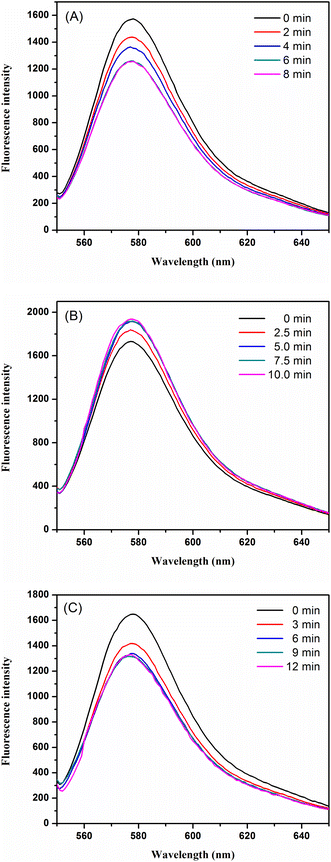
To acquire optimized performance for clenbuterol detection, several experimental conditions, including the pH of the solution, the concentration of RhoB and aptamer, and the incubation time between clenbuterol and the aptamer, the aptamer and GO, and GO and RhoB, were carefully investigated.As observed in Fig. 2, the variations in fluorescence intensity (ΔF) increased from 5.5 to 6.5 and then decreased. This might be due to the following reasons. On the one hand, lowering the pH reduced the negative charge density on the GO surface due to the protonation of –COO− groups, which would reduce the electrostatic repulsion with DNA aptamer.33 Therefore, lowering the pH could promote DNA adsorption on GO and hinder the interaction between RhoB and GO, thereby reducing the fluorescence quenching efficiency. On the other hand, RhoB was positively charged in acidic solutions,34 and lowering the pH would enhance the interactions between the RhoB and GO and improve the fluorescence quenching efficiency. The solution pH of 6.5 brought the situation into a balance and ΔF reached its maximum value, thus, this was the optimal pH value for this assay.
The incubation time between GO and the aptamer was set to 0, 2.5, 5, 7.5, and 10 min, respectively. The fluorescence intensity was greatly increased with the reaction time from 0 to 5 min, and thereafter, almost no changes were observed (Fig. 5B), indicating that the adsorption between the aptamer and GO was completed. Therefore, the incubation time of 5 min was selected as the optimal incubation time between GO and the aptamer.
The reaction time between the aptamer and clenbuterol was set to 0, 3, 6, 9, and 12 min, respectively. As shown in Fig. 5C, the fluorescence intensity decreased rapidly with the reaction time before 6 min and achieved equilibrium after 6 min, thus, 6 min was chosen as the optimal reaction time between clenbuterol and the aptamer.
3.3. Sensitivity and selectivity
Under the optimal experimental conditions, the sensitivity of the proposed strategy for clenbuterol detection was investigated. As shown in Fig. 6, the fluorescence intensity decreased gradually with the increasing concentration of clenbuterol, and a good linear relationship was observed between ΔF and the concentration of clenbuterol in the range from 100 to 700 nM. The linear regression equation was calculated as y = 1.1012x − 87.4168, with a correlation coefficient R2 = 0.9932. The detection limit was calculated to be 9.6 nM according to the 3σ rule.35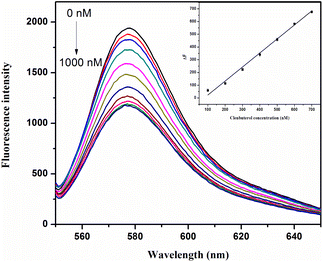 | ||
| Fig. 6 Sensitivity of the aptasensor for clenbuterol detection. The inset shows the calibration curve. | ||
In order to evaluate the selectivity of the proposed aptasensor, several interfering compounds, such as salbutamol, dopamine, and terbutaline, were detected under identical experimental conditions. It can be seen from Fig. 7 that other substances exhibited little interference toward the detection of clenbuterol, except for terbutaline, though a significant difference in ΔF between terbutaline and clenbuterol remained. Thus, the developed aptasensor exhibited good selectivity for clenbuterol detection.
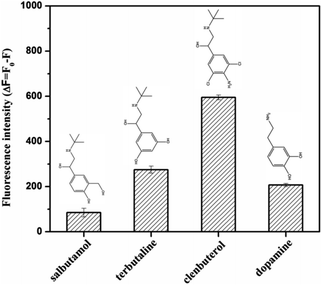 | ||
| Fig. 7 Selectivity evaluation for the detection of clenbuterol (600 nM) against salbutamol, dopamine and terbutaline at the same concentration. | ||
3.4. Application to real samples
The applicability of this strategy was evaluated by pork samples spiked with different concentrations of clenbuterol. The results showed that the aptasensor would confer a recovery ratio between 96.75% and 104.91% and a relative standard deviation (RSD) between 2.06% and 5.67% (Table 1), indicating that this developed aptasensor could detect clenbuterol in pork samples with reliable accuracy.| Sample | Spiked (nM) | Detected (nM) | Recovery (%) | RSD (%) |
|---|---|---|---|---|
| Pork | 200.00 | 193.50 ± 10.99 | 96.75 ± 5.49 | 5.67 |
| 400.00 | 419.62 ± 8.63 | 104.91 ± 2.16 | 2.06 | |
| 600.00 | 587.92 ± 15.28 | 97.99 ± 2.55 | 2.60 |
The performance of this method was compared with other fluorescence methods (Table 2). As can be seen, the quantification range, recovery and limit of detection (LOD) of this method were comparable to other methods. Moreover, our method was simple, fast, easy to operate and cost-effective. Furthermore, the introduction of aptamer ensures the selectivity of the method. These features make it a promising tool for the rapid detection of clenbuterol.
| Material | Sample | Operation | Analytical range | LOD | Recovery | Ref. |
|---|---|---|---|---|---|---|
| a MIP-CdTe QDs: molecularly imprinted polymer-capped CdTe quantum dots; C-dots: carbon dots; AuNPs: gold nanoparticles; AuNCs@BSA: BSA-protected gold nanoclusters; Zr(IV)-MOFs: zirconium(IV)-based metal organic framework; MIPs@UCPs: upconversion particles coated with molecularly imprinted polymers; GO: graphene oxide. | ||||||
| MIP-CdTe QDs | Milk, liver | Complex | 2500–22![[thin space (1/6-em)]](https://www.rsc.org/images/entities/char_2009.gif) 500 nM 500 nM |
120 ng mL−1 | 92–97 | 36 |
| C-dots and AuNPs | Pork | Simple | 8–200 nM | 3 nM | 97.5–105.0 | 28 |
| AuNCs@BSA | Pork | Simple | 4.0–300![[thin space (1/6-em)]](https://www.rsc.org/images/entities/char_2009.gif) 000 nM 000 nM |
1.6 nM | — | 37 |
| Zr(IV)-MOFs | Water | Complex | 4.0–40 ng mL−1 | 170 nM | — | 38 |
| MIPs@UCPs | Water, pork | Complex | 5.0–100.0 ng mL−1 | 0.12 ng mL−1 | 81.66–102.46 | 39 |
| — | Pork | Simple | 50–450 ng mL−1 | 18.8 nM | 90.37–104.98 | 40 |
| GO | Pork | Simple | 100–700 nM (31–220 ng mL−1) | 9.6 nM (3.0 ng mL−1) | 96.75–104.91 | This method |
4. Conclusion
In summary, a facile and sensitive FRET-based aptasensor for the specific detection of clenbuterol was established with RhoB as the fluorescence donor and GO as the acceptor. The presence of target clenbuterol caused desorption of the aptamer from the surface of GO. RhoB displaced the aptamer and adsorbed on the GO. As a result, the FRET between GO and RhoB was enhanced and the fluorescence emission of RhoB was turned off. Under optimal conditions, the change in the fluorescence intensity was proportional to the clenbuterol concentration over the range of 100 to 700 nM, with a LOD of 9.6 nM. The spiked recoveries for clenbuterol were 96.75% to 104.91%, with a relative standard deviation of 2.06% to 5.67% in pork samples. Promisingly, this method exhibits great potential for monitoring other targets by changing the corresponding aptamers, thanks to its easy operation, low cost and high sensitivity.Author contributions
Shuyan Xiao: conceptualization, writing – original draft and funding acquisition. Liang Sun: investigation, methodology, data curation, and visualization. Mingqin Kang and Zhongping Dong: resources and writing – review & editing.Conflicts of interest
There are no conflicts to declare.Acknowledgements
This project was financially supported by the Natural Science Foundation of Inner Mongolia (2022LHMS02003), the Excellent Youth Science Foundation of Inner Mongolia University of Science and Technology (2019YQL04) and the National Natural Science Foundation of China (21663017).References
- L. Wang, R. Yang, J. Chen, J. Li, L. Qu and P. d. B. Harrington, Food Chem., 2014, 164, 113–118 CrossRef CAS PubMed.
- X. Liu, Q. Lu, S. Chen, F. Wang, J. Hou, Z. Xu, C. Meng, T. Hu and Y. Hou, Molecules, 2018, 23, 2337 CrossRef PubMed.
- J. Kang, Y. Zhang, X. Li, L. Miao and A. Wu, ACS Appl. Mater. Interfaces, 2016, 8, 1–5 CrossRef CAS PubMed.
- J. Cheng, X. O. Su, S. Wang and Y. Zhao, Sci. Rep., 2016, 6, 32637 CrossRef CAS PubMed.
- N. A. A. Talib, F. Salam and Y. Sulaiman, Sensors, 2018, 18, 4324 CrossRef PubMed.
- B. Velasco-Bejarano, R. Velasco-Carrillo, E. Camacho-Frias, J. Bautista, R. López-Arellano and L. Rodríguez, Drug Test. Anal., 2022, 14, 1130–1139 CrossRef PubMed.
- J. H. Zhao, H. C. Yuan, Y. J. Peng, Q. Hong and M. H. Liu, J. Appl. Spectrosc., 2017, 84, 76–81 CrossRef.
- K. Yan, H. Zhang, W. Hui, H. Zhu, X. Li, F. Zhong, X. Tong and C. Chen, J. Food Drug Anal., 2016, 24, 277–283 CrossRef.
- W. Du, S. Zhang, Q. Fu, G. Zhao and C. Chang, Biomed. Chromatogr., 2013, 27, 1775–1781 CrossRef PubMed.
- K. J. Prajapati and C. Kothari, Drug Res., 2020, 70, 552–562 CrossRef.
- S. Yang, X. Liu, Y. Xing, D. Zhang, S. Wang, X. Wang, Y. Xu, M. Wu, Z. He and J. Zhao, J. Chromatogr. Sci., 2013, 51, 436–445 Search PubMed.
- Y. Yang, H. Zhang, C. Huang, D. Yang and N. Jia, Biosens. Bioelectron., 2017, 89, 461–467 CrossRef PubMed.
- Y. Ge, M. Qu, L. Xu, X. Wang, J. Xin, X. Liao, M. Li, M. Li and Y. Wen, Microchim. Acta, 2019, 186, 836 CrossRef.
- L. Liu, H. Pan, M. Du, W. Xie and J. Wang, Electrochim. Acta, 2010, 55, 7240–7245 CrossRef.
- Y. Cong, H. Dong, X. Wei, L. Zhang, J. Bai, J. Wu, J. X. Huang, Z. Gao, H. Ueda and J. Dong, Ecotoxicol. Environ. Saf., 2019, 182, 109473 CrossRef.
- T. Peng, J. Wang, S. Zhao, S. Xie, K. Yao, P. Zheng, S. Wang, Y. Ke and H. Jiang, Microchim. Acta, 2018, 185, 366 CrossRef PubMed.
- M. A. Bacigalupo, G. Meroni, F. Secundo, C. Scalera and S. Quici, Talanta, 2009, 80, 954–958 CrossRef.
- Y. Lai, J. Bai, X. Shi, Y. Zeng, Y. Xian, J. Hou and L. Jin, Talanta, 2013, 107, 176–182 CrossRef PubMed.
- N. A. A. Talib, F. Salam, N. A. Yusof, S. A. Alang Ahmad, M. Z. Azid, R. Mirad and Y. Sulaiman, RSC Adv., 2018, 8, 15522–15532 RSC.
- N. Duan, W. Gong, S. Wu and Z. Wang, J. Agric. Food Chem., 2017, 65, 1771–1777 CrossRef PubMed.
- H. Sun and Y. Zu, Molecules, 2015, 20, 11959–11980 CrossRef.
- M. Ilgu and M. Nilsen-Hamilton, Analyst, 2016, 141, 1551–1568 RSC.
- Q. Kou, P. Wu, Q. Sun, C. Li, L. Zhang, H. Shi, J. Wu, Y. Wang, X. Yan and T. Le, Anal. Bioanal. Chem., 2021, 413, 901–909 CrossRef.
- D. Chen, M. Yang, N. Zheng, N. Xie, D. Liu, C. Xie and D. Yao, Biosens. Bioelectron., 2016, 80, 525–531 CrossRef.
- S. Huang, Int. J. Electrochem. Sci., 2020, 15, 4102–4116 CrossRef.
- Y. Zhang, H. X. Ren and Y. B. Miao, Microchim. Acta, 2019, 186, 515 CrossRef.
- N. Duan, S. Qi, Y. Guo, W. Xu, S. Wu and Z. Wang, LWT--Food Sci. Technol., 2020, 134, 110017 CrossRef.
- Y. Liu, Q. Lu, X. Hu, H. Wang, H. Li, Y. Zhang and S. Yao, J. Fluoresc., 2017, 27, 1847–1853 CrossRef PubMed.
- Y. Li, R. Su, H. Li, J. Guo, N. Hildebrandt and C. Sun, Anal. Chem., 2022, 94, 193–224 CrossRef.
- K. Ma, X. Li, B. Xu and W. Tian, Anal. Chim. Acta, 2021, 1188, 338859 CrossRef.
- X. Guo, F. Wen, Q. Qiao, N. Zheng, M. Saive, M. L. Fauconnier and J. Wang, Sensors, 2019, 19, 3840 CrossRef.
- R. Zhang, M. Hummelgård, G. Lv and H. Olin, Carbon, 2011, 49, 1126–1132 CrossRef CAS.
- A. Lopez and J. Liu, Adv. Intell. Syst., 2020, 2, 2000123 CrossRef.
- Y. J. Oh, T. C. Gamble, D. Leonhardt, C. H. Chung, S. R. Brueck, C. F. Ivory, G. P. Lopez, D. N. Petsev and S. M. Han, Lab Chip, 2008, 8, 251–258 RSC.
- J. Jia, S. Yan, X. Lai, Y. Xu, T. Liu and Y. Xiang, Food Anal. Methods, 2018, 11, 1668–1676 CrossRef.
- B. T. Huy, M. H. Seo, X. Zhang and Y. I. Lee, Biosens. Bioelectron., 2014, 57, 310–316 CrossRef.
- X. Cao, H. Li, L. Lian, N. Xu, D. Lou and Y. Wu, Anal. Chim. Acta, 2015, 871, 43–50 CrossRef.
- H. Yang, B. Wang, J. Cheng, R. Wang, S. Zhang, S. Dong, S. Wei, P. Wang and J. R. Li, Microchim. Acta, 2019, 186, 454 CrossRef.
- Y. Tang, Z. Gao, S. Wang, X. Gao, J. Gao, Y. Ma, X. Liu and J. Li, Biosens. Bioelectron., 2015, 71, 44–50 CrossRef PubMed.
- S. Xiao, L. Sun, J. Lu and Z. Dong, New J. Chem., 2022, 46, 16177–16182 RSC.
| This journal is © The Royal Society of Chemistry 2022 |

