
 Open Access Article
 This Open Access Article is licensed under a Creative Commons Attribution-Non Commercial 3.0 Unported Licence
Speciation of chromium aqua and chloro complexes in hydrochloric acid solutions at 298 K
Masahito Uchikoshi *a,
Daisuke Akiyamaa,
Ken'ichi Kimijimab and
Kozo Shinodac
*a,
Daisuke Akiyamaa,
Ken'ichi Kimijimab and
Kozo Shinodac
aInstitute of Multidisciplinary Research for Advanced Materials, Tohoku University, Katahira 2-1-1, Aoba, Sendai, 980-8577, Japan. E-mail: masahito.uchikoshi.b5@tohoku.ac.jp; Tel: +81 22 217 5859
bInstitute of Materials Structure Science, High Energy Accelerator Research Organization, KEK, Oho 1-1, Tsukuba, 305-0801, Japan
cInternational Centre for Synchrotron Radiation Innovation Smart, Tohoku University, 2-1-1 Katahira, Aoba, 980-8577, Japan
First published on 15th November 2022
Abstract
The distribution of metal aqua and chloro complexes is fundamental information for analysis of a chemical reaction involving these complexes. The present study investigated the speciation and structures of chromium aqua and chloro complexes using the thermodynamic model fitting analysis of UV-vis/X-ray absorption spectra. The existence of a negatively charged species was examined by adsorbability of chromium species on a strong base anion exchanger. In the results, a planar square [CrIII(H2O)4]3+, a planar square or distorted tetrahedral [CrIIICl(H2O)3]2+, a trigonal bipyramidal [CrIIICl3(H2O)2]0, and a distorted octahedral [CrIIICl4(H2O)2]− were confirmed and the thermodynamic parameters of complexation reactions were quantitatively determined. Investigation of the evolution of speciation of chromium aqua and chloro complexes in a pH 1 solution suggested the existence of [CrIIICl2(H2O)m]+ (m = 2 or 3) during the hydration process, which diminished in the equilibrium state. The kinetic analysis deserves further investigation to understand the speciation process quantitatively.
1 Introduction
Metal aqua and chloro complexes play an important role in hydrometallurgical processes, especially involving the adsorption/desorption process on/from ion exchangers, organic solvents, or ionic liquids.1–3 The distribution of chloride complexes in brines is also significant information in the geochemistry field, used to simulate the flow of metal resources in the deep sea.4A metal aqua and chloro complex exhibits a beautiful transparent colour depending on the elements and the concentration of Cl in aqueous solutions. Changes in colour reflect changes in the coordination number of Cl and/or the geometric configuration. The chemical properties of various beautiful colours have attracted many researchers and it is one of the key factors to consider when investigating metal aqua and chloro complexes.5,6 Specifically, absorption of electromagnetic radiation including light depends on electron orbitals of chemical species. Therefore, X-ray absorption spectra (XAS) as well as UV-vis absorption spectroscopy is employed to analyse chemical properties of species.7 Raman spectroscopy besides electromagnetic radiation is also a useful technique.8 Reactivity, such as hydrolysis, solubility, and so on can be used for understanding the thermodynamic properties.9
The speciation of chromium aqua and chloro complexes in an equilibrium state has been investigated for over a century.10–21 Table 1 shows a list of investigations. Most of the investigations were based on the reports by N. Bjerrum10 or M. J. Bjerrum and J. Bjerrum,18 in which four chromium aqua and chloro complexes in an octahedral configuration were reported. The latter, M. J. Bjerrum and J. Bjerrum,18 also determined the stability constants.
| Methoda | Mediab | Thermodynamic model | Forma. con. or bond. dis., R/Å | ||
|---|---|---|---|---|---|
| Cl coord.c | Geom. configur. | ||||
| a Method; sp: UV-vis absorption spectroscopy, iex: ion exchange, xrd: X-ray diffraction pattern, xafs: X-ray absorption fine structure, ce: capillary electrophoresis.b Media; ionic strength was maintained using a salt with parenthesis.c (n1n2…nN) represents a combination of Cl− coordination numbers, see text in Section 3.1.1.d 12 M HCl was used for [CrCl3(H2O)3]0.e including cis- and trans-[CrCl2(H2O)4]+.f Synthesis and dissolution of an appropriate crystal. | |||||
| N. Bjerrum10 | sp | HCl | (0123) | — | — |
| P. J. Elving and B. Zemel11 | sp | ≤6 M HCl at 6 M (HClO4)d | (0123) | Octahedrone | — |
| H. S. Gates and E. L. King12 | sp | ≤6 M HCl at 6 M (HClO4) | (012) | Octahedrone | — |
| D. E. Bracken and H. W. Baldwin13 | iex | HCl, HClO4 | (1) | Octahedron | — |
| L. Mønsted and O. Mønsted14 | sp | Syn. dis. cryst.f | (012) | Octahedrone | — |
| M. Magini15 | iex, xrd | ≥6 M HCl | (0123) | Octahedron | RCr−OH2: 1.961–1.982 |
| RCr−Cl: 2.297–2.325 | |||||
| T. Tsuru et al.16 | sp | Syn. dis. cryst.f | (0123) | Octahedrone | — |
| K. E. Collins et al.17 | iex | Na2Cr2O7 in HClO4 | (0123) | Octahedron | — |
| M. J. Bjerrum and J. Bjerrum18 | sp, iex | Acidified LiCl | (0123) | Octahedrone | log![[thin space (1/6-em)]](https://www.rsc.org/images/entities/char_2009.gif) β1 = −0.99 β1 = −0.99 |
| logβ2 = −3.13 |
|||||
| logβ3 = −6.32 |
|||||
| A. Munoz-Paez et al.19 | xafs | Cr(NO3)3 in H2O | (0) | Octahedron | RCr−OH2: 2.00 |
| S. Díaz-Moreno et al.20 | sp, xafs | HCl | (0123) | Octahedron | RCr−OH2: 1.98–2.00 |
| RCr−Cl: 2.26–2.30 | |||||
| A. Gáspár and P. Buglyó21 | ce | 0.1 M HNO3 | (012) | — | — |
Most literature dealing with chromium aqua and chloro complexes assumes that there are four octahedral species of [CrIII(H2O)6]3+, [CrIIICl(H2O)5]2+, [CrIIICl2(H2O)4]+, and [CrIIICl3(H2O)3]0. It is believed that all chromium aqua and chloro complexes take an octahedral configuration.10–21 An octahedral configuration has to assume awkward geometric configurations, such as cis-[CrIIICl2(H2O)4]+ and [CrIIICl3(H2O)3]0, which were intuitively unacceptable because the symmetries of cis-[CrIIICl2(H2O)4]+ and [CrIIICl3(H2O)3]0 are much lower than the rest of the chromium aqua and chloro complexes.
The existence of a negatively charged chromium aqua and chloro complex has not been reported. K. A. Kraus1 reported that the adsorption of chromium species on anion exchangers was slight and the details were not clear, although adsorbability is important for hydrometallurgical processes involving purification, separation, and recovery. On the other hand, adsorption behaviour on cation exchangers has been investigated well and applied to separate chromium isotopes.22–24 Every study dealing with chromium aqua and chloro complexes was based mainly on the distribution reported by M. J. Bjerrum and J. Bjerrum.18
The authors investigated distributions of ferric,6 cobaltous,25 and cupric aqua and chloro complexes26 in hydrochloric acid solutions using the thermodynamic model fitting analysis they developed themselves. The tendencies of the distributions were in agreement with reported distributions,18,22 but many differences were found in details. The differences in detail would affect the efficiency of hydrometallurgical processes and impair process improvement.
As regard to chromium aqua and chloro complexes, examination of the thermodynamic parameters in an equilibrium state is difficult since a long time is required for equilibration.18,21 In addition, the literature has assumed that all chromium aqua and chloro complexes are in an octahedral configuration even though not only an octahedral configuration but also tetrahedral and trigonal bipyramidal configurations of other metal aqua and chloro complexes have been found.6,25,26 Therefore, the proper geometric configurations of chromium aqua and chloro complexes should be re-investigated using a reliable analysis method.
The thermodynamic model fitting analysis using series of UV-vis absorption spectra and XAS statistically extracts the best thermodynamic model out of the possible assumed models. The results are significant in physical and chemical senses and more reliable than in previous reports.
In the present study, the thermodynamic model fitting analysis was employed to examine the distribution and structures of chromium aqua and chloro complexes. Furthermore, a speciation mechanism of chromium aqua and chloro complexes in a diluted Cl solution was discussed using the properties determined in the present study.
2 Experimental procedure and data processing
2.1 Preparation of UV-vis/X-ray absorption spectra
Sample solutions were prepared by dissolving reagent grade chemicals, CrCl3·6H2O and hydrochloric acid solution, purchased from FUJIFILM Wako Pure Chemical Corporation, into distilled and deionised water with resistivity greater than 180 kΩ m, purified by RFD260NC manufactured by Advantec Toyo Kaisha, Ltd.Two series of solutions with different concentrations of CrIII species in an equilibrium state were prepared as listed in Table 2; one for UV-vis absorption spectra and the other for XAS measurement. The CrIII concentrations were adjusted in order to acquire spectra suitable for data analysis. The sample solutions had been maintained at 298 K in a thermostated water bath for 30 days until the UV-vis/X-ray absorption spectra were measured. The UV-vis absorption spectra were measured again after being maintained at 298 K for 15 more days, i.e. 45 days in total, and it was confirmed that the two series of the UV-vis spectra measured 30 and 45 days after preparation were equivalent. As a consequence, it was deduced that it took 30 days at least for CrIII aqua and chloro complexes to attain an equilibrium state at 298 K. In addition to chloride aqueous solutions, a dilute nitric acid solution dissolving 0.1 mol dm−3 – CrIII(NO3)3.9H2O was prepared and its UV-vis absorption spectrum was measured in order to compare the difference in the absorption spectra with or without Cl− ions.
| UV-vis sample solutionsa | XAFS sample solutions | ||
|---|---|---|---|
| Total Cl, MCl (mol dm−3) | Total CrIII, MCrIII (mol dm−3) | Total Cl, MCl (mol dm−3) | Total CrIII, MCrIII (mol dm−3) |
| a The path lengths were at 10 mm.b 1.0 mm.c 0.5 mm. | |||
| 0.310 | 0.100 | 2.37b | 0.500 |
| 0.780 | 0.100 | 3.24b | 0.500 |
| 1.74 | 0.100 | 4.10c | 0.500 |
| 2.22 | 0.100 | 4.96c | 0.500 |
| 2.70 | 0.100 | 5.82c | 0.500 |
| 3.18 | 0.100 | 6.69c | 0.500 |
| 3.66 | 0.100 | 7.55c | 0.500 |
| 4.62 | 0.100 | 8.41c | 0.500 |
| 5.10 | 0.100 | 9.28c | 0.500 |
| 6.06 | 0.100 | 10.1c | 0.500 |
| 6.54 | 0.100 | 11.0c | 0.500 |
| 7.02 | 0.100 | ||
| 7.50 | 0.100 | ||
| 7.98 | 0.100 | ||
| 8.46 | 0.100 | ||
| 8.94 | 0.100 | ||
| 9.42 | 0.100 | ||
| 9.90 | 0.100 | ||
| 10.4 | 0.100 | ||
| 10.9 | 0.100 | ||
One more series of UV-vis absorption spectra was collected for qualitative analysis of speciation kinetics. CrCl3·6H2O was dissolved in a pH 1 solution at 0.1 mol dm−3 – CrIII and the spectrum measured with certain time intervals. In this measurement, the temperature was not maintained and ranged from 10 °C to 25 °C (night and day).
The two series of UV-vis absorption spectra, that is one for the equilibrium state and the other for the speciation kinetics, were collected using a V-770 Ultraviolet-visible spectrometer (JASCO Corporation) operating in the dual beam mode with a quartz cuvette with a path length of 10 mm. Dark and baseline corrections were made. UV-vis absorption spectra were collected at 298 K, and the three measurements were averaged. The spectra were recorded in the range from 364 nm to 922 nm in 2 nm increments and the abscissa was converted into wavenumber in the range from 10860 cm−1 to 27420 cm−1 in 60 cm−1 increments. The absorbance was interpolated using a cubic spline algorithm.27
The Lambert–Beer law states that there is a linear relationship between the concentration of an absorbing solute, c, and the absorbance of a solution, a, when a light travels a distance of l. The product of the molar attenuation coefficient, ε, and the molarity of CrIII species, that is to say the quotient of the absorbance divided by the path length was employed for practical analysis, as shown in Fig. 1.
 | (1) |
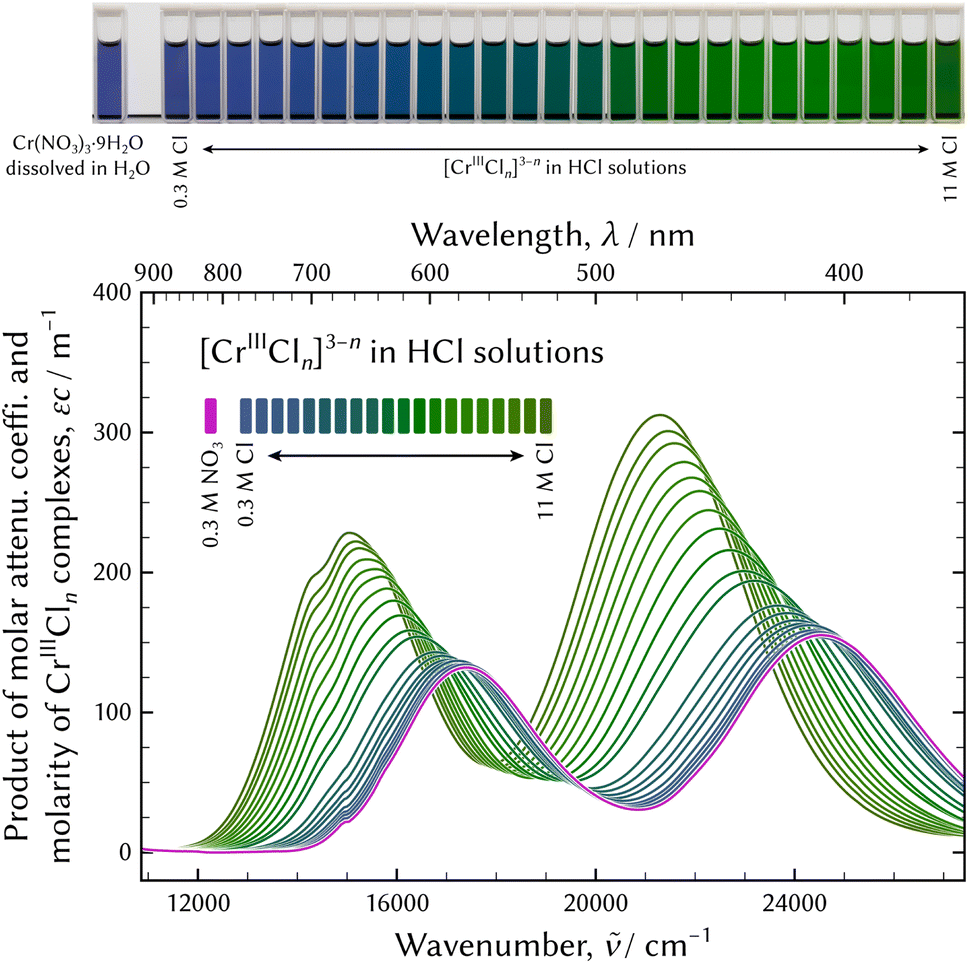 | ||
| Fig. 1 UV-vis absorption spectra of chromium chloro complexes in hydrochloric acid solutions. The spectrum of the solution dissolving Cr(NO3)3·9H2O is also displayed for comparison. | ||
At the top of Fig. 1, the appearance of the series of sample solutions is displayed. Every spectrum has two characteristic absorption bands, which exhibit a red shift, and the colours of the solutions gradually change from dark bluish violet to dark green with the increase in the Cl molarity. However, no isosbestic point was observed. Therefore, the number of chromium aqua and chloro complexes greater than two were supposed.
Fig. 2 shows X-ray absorption near edge structure (XANES) and extended X-ray absorption fine structure (EXAFS) spectra of chromium aqua and chloro complexes in hydrochloric acid solutions. XAS of the Cr K edge were collected using the transmission mode at BL-9C of Photon Factory with a ring energy of 2.5 GeV in Japan. A sample solution was filled up in a cell made from rigid vinyl chloride with a 20 mm-diameter window, and polyimide film was pasted on as the window material. The path lengths of 0.5 mm or 1 mm were chosen corresponding to concentrations of salt as noted in Table 2. The incident X-rays were monochromatised by a silicon double crystal monochromator and the net planes were (111). The I0 and I1 ionisation chambers were filled with 70% He/30% N2 and 25% Ar/75% N2, respectively.
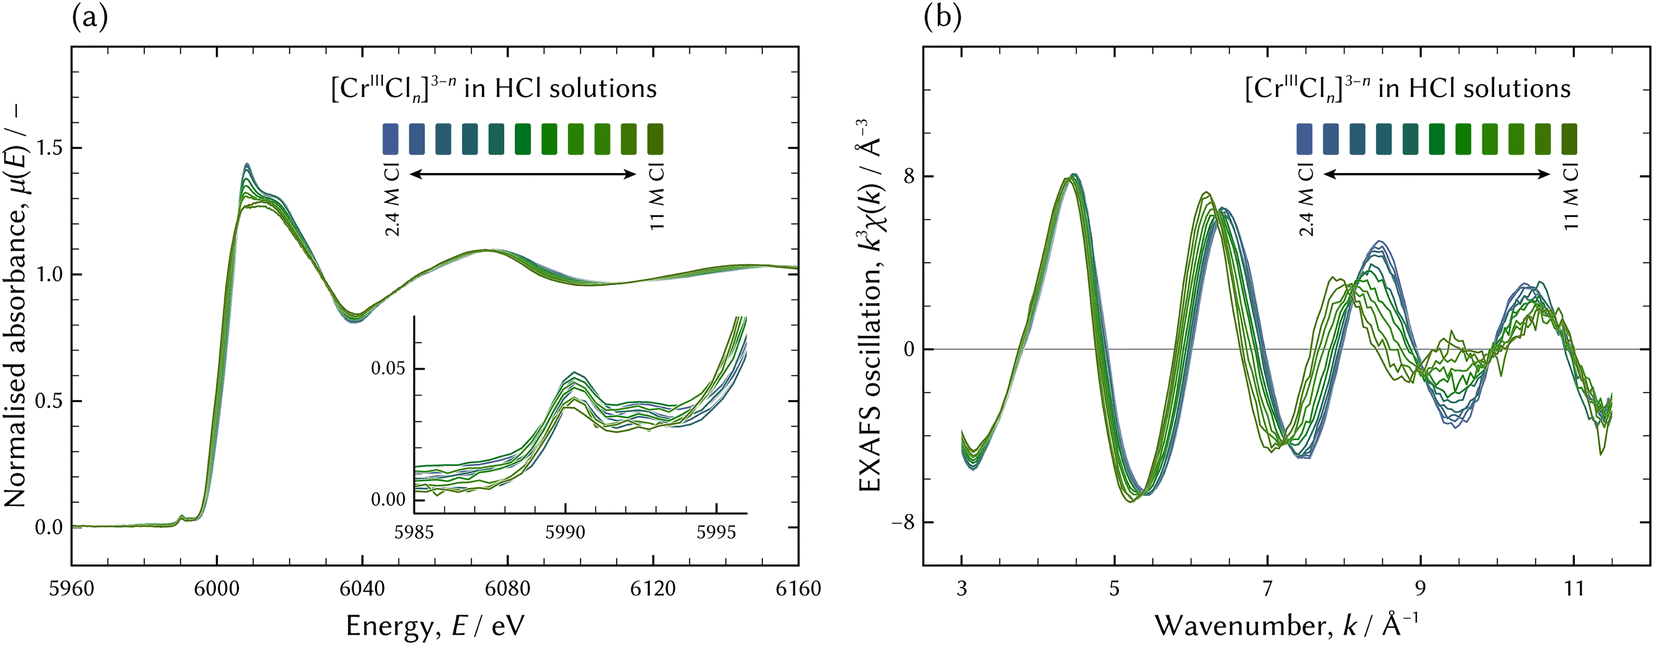 | ||
| Fig. 2 The XAS of chromium aqua and chloro complexes in hydrochloric acid solutions; the XANES spectra (a) and the EXAFS spectra (b). | ||
2.2 Thermodynamic model fitting analysis
An issue to be solved is an inverse problem, which draws an appropriate distribution of chromium aqua and chloro complexes in hydrochloric acid solutions from the series of UV-vis/X-ray absorption spectra. An appropriate thermodynamic model was statistically determined by reproducibility of the UV-vis absorption spectra.Eqn (1) can be represented as a matrix form of eqn (2).
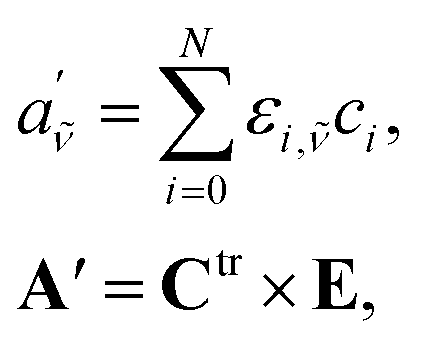 | (2) |
![[small nu, Greek, tilde]](https://www.rsc.org/images/entities/i_char_e0e1.gif) and i are wavenumber and chemical species, and A′, C, and E are matrix forms of a′, c, and ε, respectively. The superscript of “tr” indicates transportation.
and i are wavenumber and chemical species, and A′, C, and E are matrix forms of a′, c, and ε, respectively. The superscript of “tr” indicates transportation.
Firstly, it should be determined how many chromium aqua and chloro complexes existed in hydrochloric acid solutions. The first derivative test6,25,28 was used for evaluation of the number of significant species. When observing changes of smoothness in vectors in a unitary matrix decomposed by the singular value decomposition29 of A′, a sudden change indicates a number of significant species. The first derivative test is the most useful and reliable index out of various empirical methods of principal component analysis.30,31
At the beginning of the fitting procedure, a distribution for a given set of thermodynamic parameters of Ccalc. was assessed using the EQBRM algorithm.32 Substituting the assessed Ccalc. into eqn (2) derived Ecalc. by matrix division. Ecalc. would contain more distortion if the assessed Ccalc. was further from an appropriate distribution. A series of UV-vis spectra of  was re-composed by a matrix product of Ctrcalc. and Ecalc. and compared with the original spectra matrix of A′ using R-factor defined as the following.
 | (3) |
 and
and  denote the elements in the original A′ and the assessed
  , respectively. The fitting parameters giving a minimum R-factor were the optimised thermodynamic parameters.
A thermodynamic model was based on formations of chromium chloro complexes and a dissociation of HCl. Formation reactions and constants of chromium chloro complexes were assumed as the following equations.
| [Cr]3+ + n[Cl]− = [CrIIICln]3−n, | (4a) |
 | (4b) |
| [HCl]0aq. = [H]+aq. + [Cl]−aq., | (5a) |
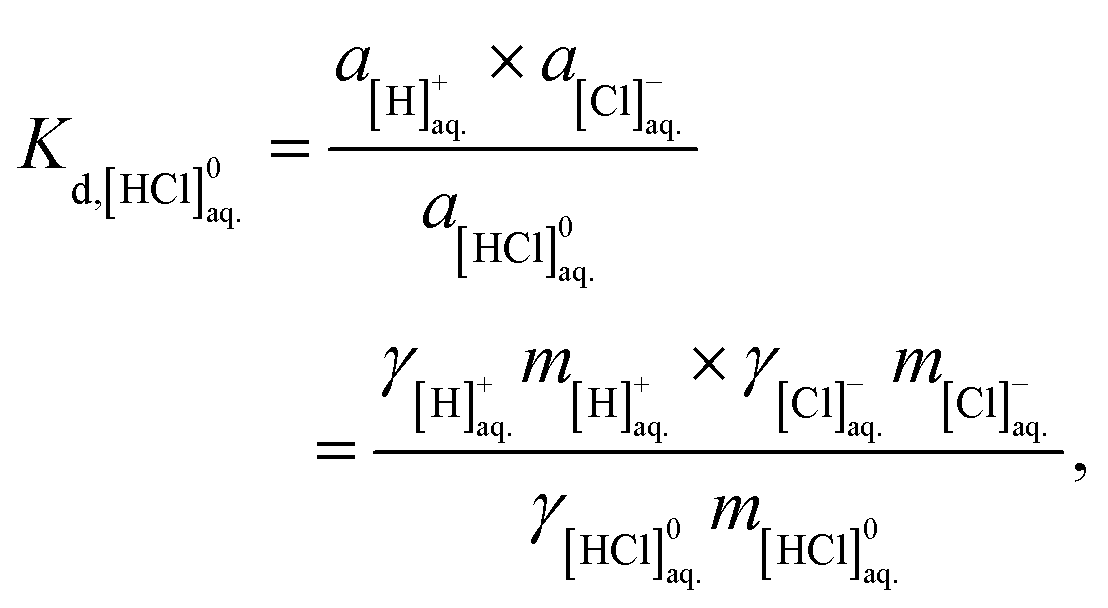 | (5b) |
Activity coefficients of charged aqueous species in hydrochloric acid solutions were estimated using the modified Debye–Hückel model33 extended with the Pitzer model.34
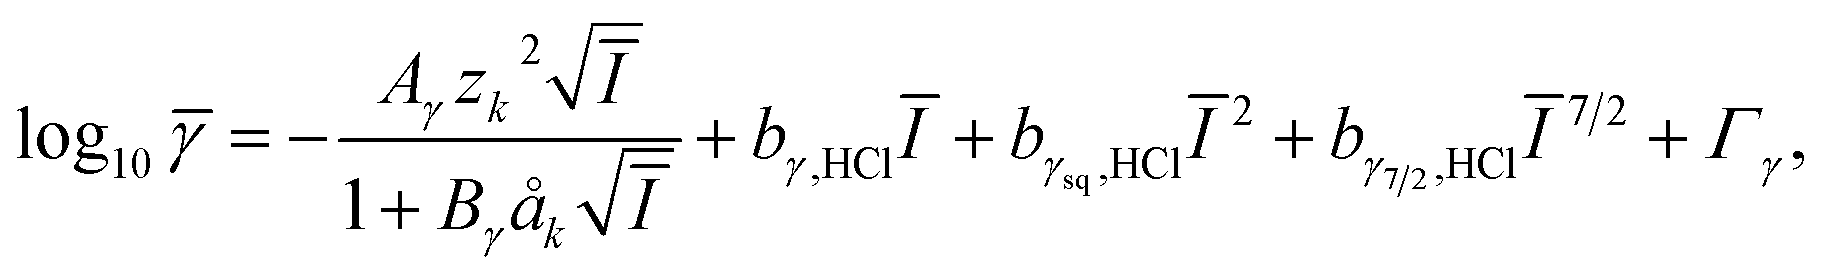 | (6) |
![[small gamma, Greek, macron]](https://www.rsc.org/images/entities/i_char_e0c4.gif) is the mean stoichiometric activity coefficient. Aγ and Bγ are the Debye–Hückel solvent parameters. Ī is the effective ionic strength and Γγ is the mole fraction to molality conversion factor.33 zk is the charge of the aqueous species of k. åk is the distance of closest approach to k species, which mainly depends on the charge number of species. The values of åk are assumed to be 4.0 Å, 5.0 Å, 9.0 Å and 11.0 Å for mono-, di-, tri-, and tetravalent species, respectively, referring to the reported values and the proton was the exception and åH+ was 9.0 Å.35
is the mean stoichiometric activity coefficient. Aγ and Bγ are the Debye–Hückel solvent parameters. Ī is the effective ionic strength and Γγ is the mole fraction to molality conversion factor.33 zk is the charge of the aqueous species of k. åk is the distance of closest approach to k species, which mainly depends on the charge number of species. The values of åk are assumed to be 4.0 Å, 5.0 Å, 9.0 Å and 11.0 Å for mono-, di-, tri-, and tetravalent species, respectively, referring to the reported values and the proton was the exception and åH+ was 9.0 Å.35
Activity coefficients of neutral species were estimated using the Setchénow model.36
|
log10γ[MClν]0 = bγ,[MClν]0Ī + Γγ,
| (7) |
The oxidation state of M is +ν.
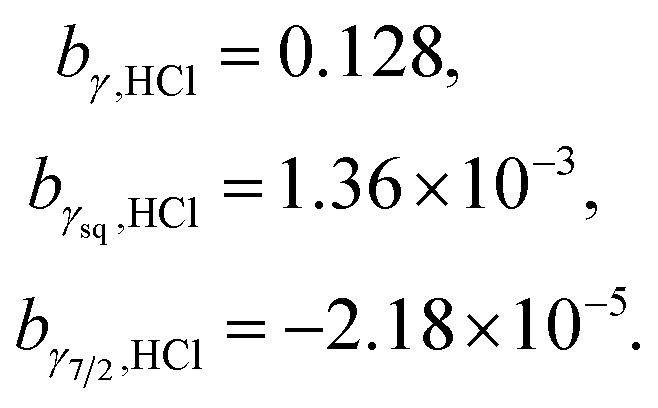
The b terms in eqn (6) and (7) would be optimised to fit the thermodynamic models to experimentally determined mean stoichiometric activity coefficients of H+ summarised by Hamer and Wu37 and Partanen et al.34 Virtually complete dissociation is assumed when a mean stoichiometric activity coefficient is considered, therefore  was assumed 12, which was large enough so that the existence of HCl was negligible.
The fitting result is demonstrated in Fig. 3 and the optimised b terms were as follows.
 | (8) |
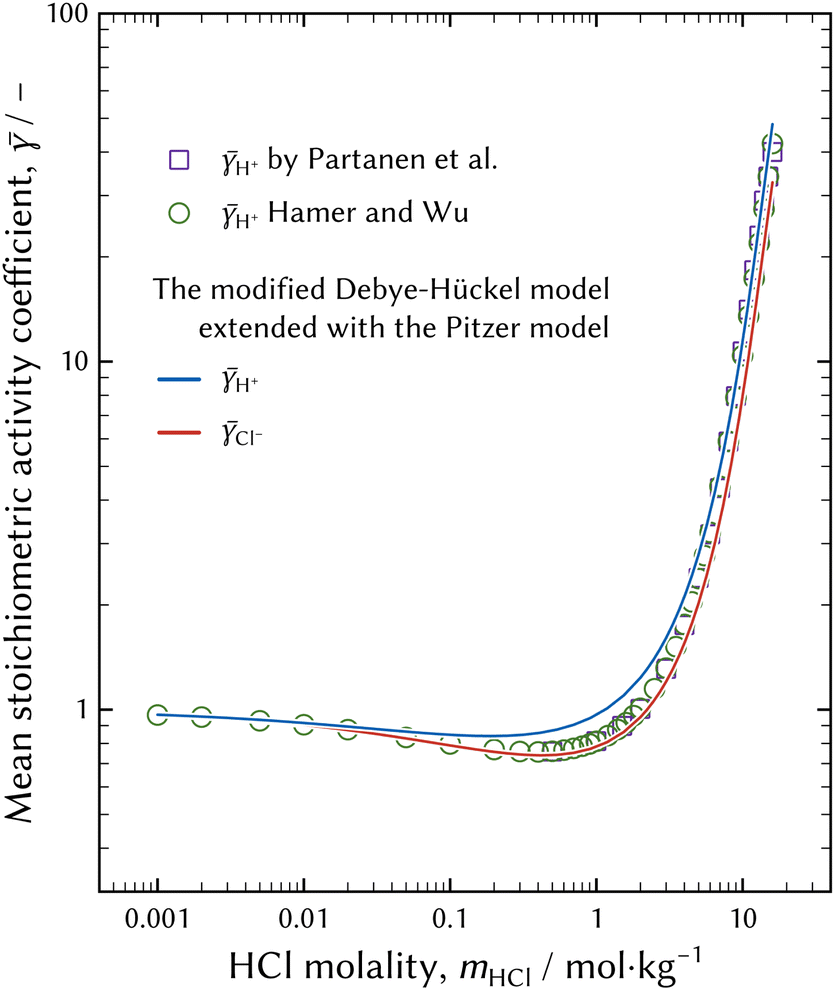 | ||
| Fig. 3 Representation of the mean stoichiometric activity coefficients of H+ and Cl−. b terms in eqn (8) were fitted to the observed mean stoichiometric activity coefficient of H+ summarised by Hamer and Wu.37 The difference in γ between H+ and Cl− was caused by the Debye–Hückel term in eqn (8). | ||
The modified Debye–Hückel model extended with the Pitzer model of eqn (6) with the optimised b terms reasonably represents the measured activity coefficient of H+, although the fitted activity coefficient of H+ deviates around the HCl molality of 1 mol kg−1. The activity coefficient model should be improved so that the estimated curve approaches the observed activity coefficient.
2.3 Anion exchange behaviour of chromium species
The adsorbability of chromium chloro complexes on an anion exchanger was investigated. The adsorbability tells us whether a negatively charged complex exists or not in solvent. Concentrations of chromium and hydrochloric acid were set at 80 mg dm−3 and 11.6 mol dm−3, respectively. DIAION SA10A© made by Mitsubishi Chemical Corporation is a strong basic anion exchange resin having quaternary ammonium groups, which was used as the adsorbent. Moisture adhering to the anion exchange resin was removed by centrifugation at 3000 rpm. for 10 min as a pre-treatment.38 Fifteen cm3 of the sample solution and 5 cm3 of resin were mixed in a flask and shaken horizontally at 100 rpm. for 10 min at 25 °C. Chromium concentrations before and after contact were analysed using a contrAA 600 atomic absorption spectrometer (Analytik Jena).2.4 Structure analysis
The Lambert–Beer law can be applied to XAS as well as to UV-vis absorption spectra. The series of XAS of X and those of individual species of χ were related as follows.| X = CtrXAS × χ, | (9a) |
| χ = Ctr−1XAS × X, | (9b) |
A theoretical model was fitted to the individual EXAFS spectra in k-space (k = 3 Å−1 to 11 Å−1) using the Demeter 0.9.26 package.39 The EXAFS spectrum of the assumed structure model was calculated using the FEFF programme bundled with the Demeter package. The best possible geometry configurations for each species were determined by the FEFF fitting results. Representation of the resultant XANES spectra was attempted using the FDMNES code40 and the geometry configurations examined by FEFF fitting analysis.
2.5 Kinetic analysis of the chromium aqua and chloro complex speciation using model free analysis
A series of UV-vis absorption spectra of the evolution in speciation was decomposed using the multivariate curve resolution-alternative least square (MCR-ALS) technique developed by J. Jaumot et al.41 The result is less significant in a physical and chemical sense because the MCR-ALS is a model free analysis. Molar attenuation coefficients of individual components decomposed by the MCR-ALS were compared with those in equilibrium state investigated using the thermodynamic model fitting analysis.Considering the nature of absorbance and concentration, the following three constraints were applied to decomposition into molar attenuation coefficients and the distribution during every MCR-ALS iteration.41
(1) Non-negativity: a molar attenuation coefficient and a concentration of species must be positive. A negative value is forced to be zero during iteration.
(2) Unimodality: it is assumed that a concentration profile as a function of time after dissolution has one maximum, and monotonically decreases/increases on the left/right sides.
(3) Colosure: the total concentration of chromium species in the sample solution was fixed at 0.10 mol dm−3.
Besides MCR-ALS decomposition, a qualitative analysis was carried out. Principal spectra were intuitively extracted observing isosbestic points and changes in UV-vis absorption spectra during hydration. Compositions of possible species were assessed fitting linear combinations of the extracted principal spectra.
3 Results and discussion
3.1 Distribution and molar attenuation coefficients of chromium chloro complexes
The thermodynamic model fitting analysis was applied to UV-vis absorption spectra in order to obtain distribution and molar attenuation coefficients of individual chromium chloro complexes.The result of the first derivative test6,28 of the series of UV-vis absorption spectra in the equilibrium state shown in Fig. 1 is shown in Fig. 4. The changes in the smoothness are sudden when the number of components is four, and this indicates the number of significant components, that is to say chromium chloro complexes.
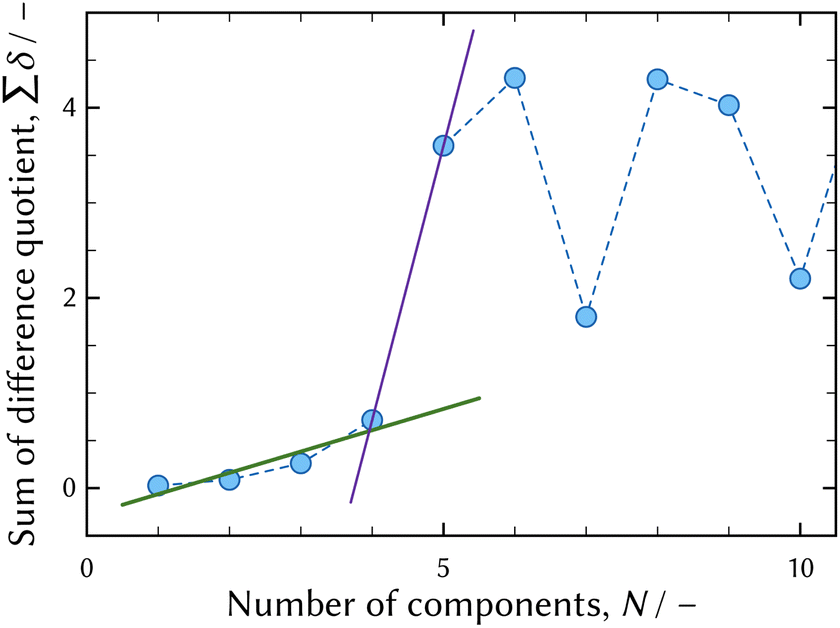 | ||
| Fig. 4 The results of the first derivative test6,28 of UV-vis absorption spectra shown in Fig. 1. The solid green and violet lines show the change in the slope when the number of components is four. | ||
The minimum coordination number of Cl ligands was supposed to be zero. The UV-vis absorption spectrum of the solution dissolving Cr(NO3)3·9H2O at pH 2 was equivalent to that of the solution dissolving CrCl3·6H2O at pH 2, although the possible ligands were different; one was Cl− and the other was NO3−. Hence, it was deduced that the generated chromium complexes in the two solutions were equal and were chromium aqua complexes without Cl− or NO3− ligands.
The maximum Cl− coordination number was estimated to be six using the ionic radius.42 The ionic radius ratio of rCl−/rCr3+ was 167 pm/75.5 pm = 2.212 when six coordination was assumed. According to the soft-sphere model, six coordination was possible because 1.366 < rCl−/rCr3+ = 2.212 < 2.414. In contrast to six coordination, eight coordination was not possible because rCl−/rCr3+ was outside the range. Thus, the maximum coordination number of Cl− was supposed to be six.
Thus, the possible combinations of the coordination numbers of Cl− ligands were the 20 combinations of four digits. The combinations had to include zero and the maximum had to be less than or equal to six. A combination is expressed as (n1n2n3n4) in this paper, where nk (k = 1, …, 4) were the coordination numbers of Cl− which could be substituted to n of eqn (4). In practice, n1 was always zero and three formation reactions and constants would be assumed for every thermodynamic model.
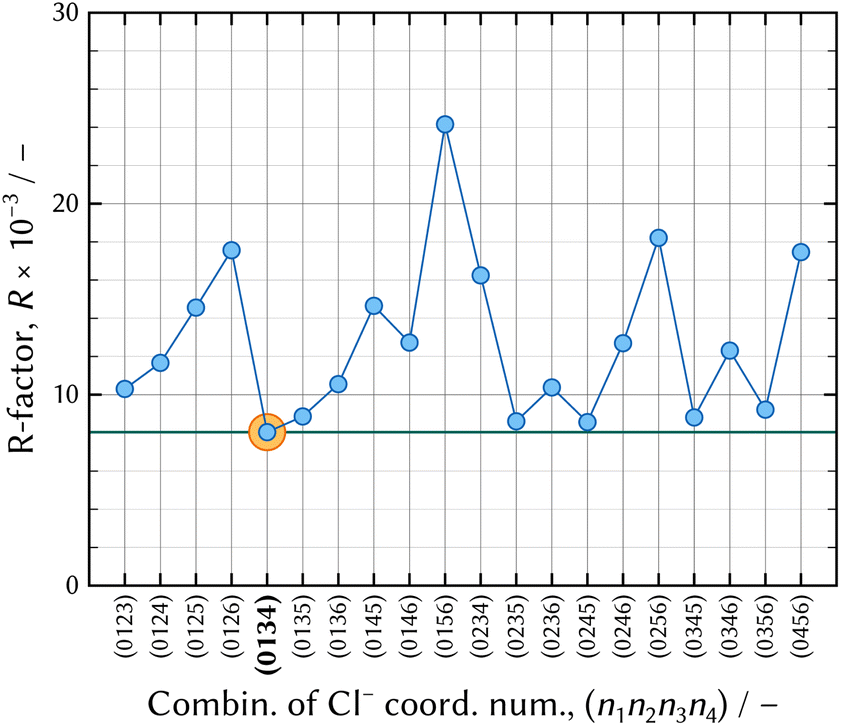 | ||
| Fig. 5 The results of the thermodynamic model fitting analysis. The solid green horizontal line indicates the minimum level of R-factor, which corresponds to that of the (0134) model. | ||
| Formation reaction | The logarithm of the cumulative formation constant, log10βn |
|---|---|
| a Setchénow coefficient for a neutral species of [CrIIICl3]0, bγ,[CrIIICl3]0 = 0.158. H2O ligand notation is omitted for simplicity and H2O ligand was not involved in the thermodynamic model fitting analysis. | |
| [CrIII]3+ + Cl− = [CrIIICl]2+ | −0.889 |
| [CrIII]3+ + 3Cl− = [CrIIICl3]0 | −2.83 |
| [CrIII]3+ + 4Cl− = [CrIIICl4]− | −5.87 |
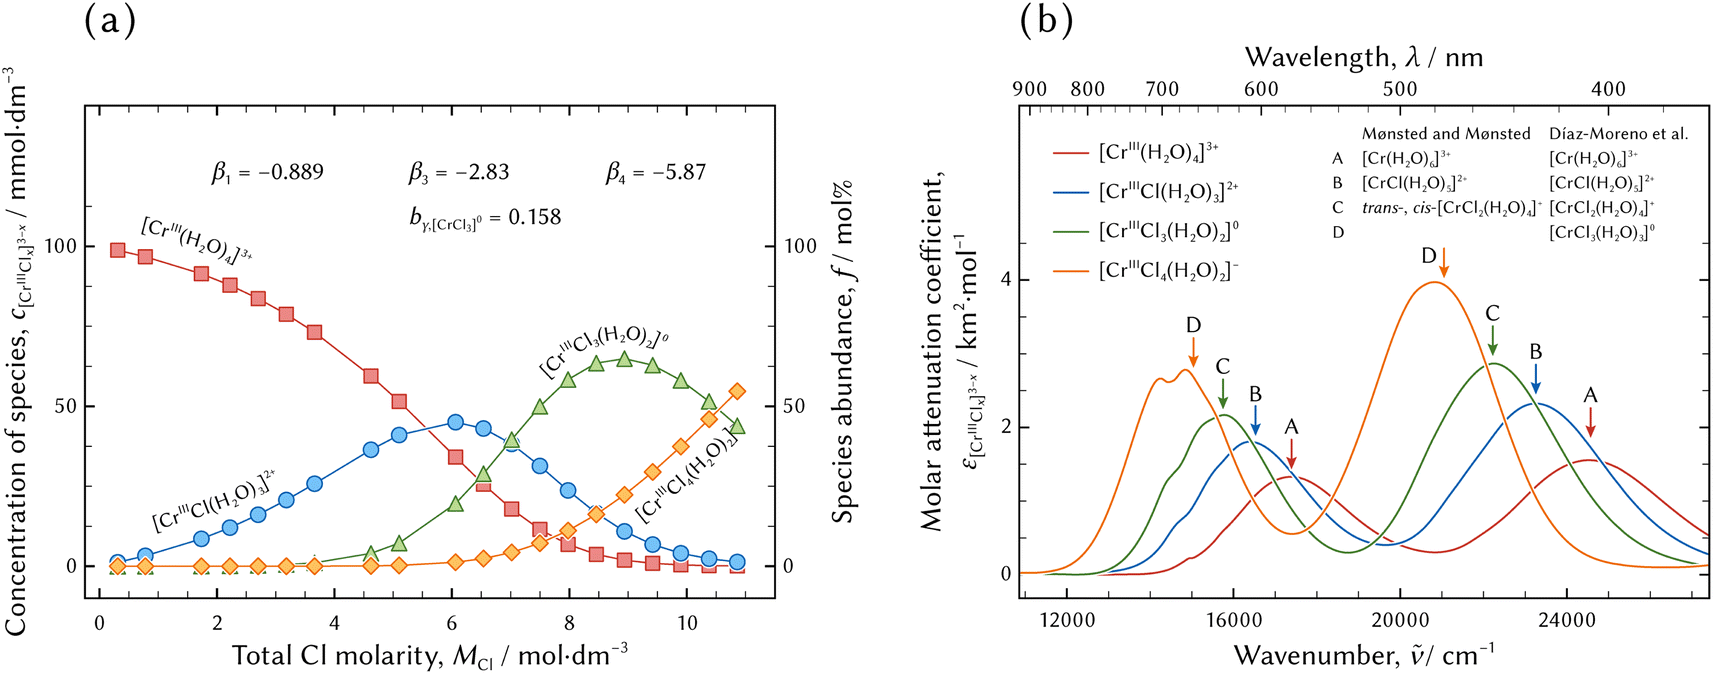 | ||
| Fig. 6 The results of the thermodynamic model fitting analysis. The best possible model was the (0134) model. The distribution of chromium aqua and chloro complexes in hydrochloric acid solutions and the thermodynamic parameters of the formation constants and Setchénow coefficient are demonstrated in (a). The molar attenuation coefficients of the individual species are displayed in (b). The arrows indicated by the capital letters indicate absorption bands reported by Mønsted and Mønsted14 and Díaz-Moreno et al.20 | ||
In Fig. 6(a), [CrIII(H2O)4]3+, [CrIIICl(H2O)3]2+, [CrIIICl3(H2O)2]0, and [CrIIICl4(H2O)2]− emerge and diminish in turn with the increase in Cl molarity. Two significant differences between the present study and the previous reports10–21 is the existence of [CrIIICl4(H2O)2]− instead of [CrIIICl2(H2O)4]+. The existence of a negatively charged [CrIIICl4(H2O)2]− will be discussed in the next section.
The molar attenuation coefficients of every chromium aqua and chloro complex are similar in the two absorption bands, the intervals between the two absorption bands, and the red shifts with the increase in the coordination number of Cl, while those of the ferric, cobaltous, and cupric aqua and chloro complexes are different as regards the characteristics of spectral features.6,25,26 It is supposed that the absorption mechanism of the chromium aqua and chloro complexes in the UV-vis range is different from those of the other metal aqua and chloro complexes. Another analysis such as ab initio calculation is necessary in order to clarify the difference in the absorption mechanism.
The absorption bands are in good agreement with previous reports by Mønsted and Mønsted14 and Díaz-Moreno et al.,20 although the assignment of chromium aqua and chloro complexes in the present study conflicts with the previous reports. In the previous reports, sample solutions were prepared by dissolving specific crystals having characteristics equivalent to assigned species and ageing for a certain time. The significant differences are the assignments of [CrIIICl3(H2O)2]0 and [CrIIICl4(H2O)2]− in the present study to [CrIIICl2(H2O)4]+ and [CrIIICl3(H2O)3]0, respectively. Spectrum analysis using ab initio calculation is necessary for reliable assignment of a spectrum to a species and it deserves further investigation in the future.
 | (10) |
 | ||
| Fig. 7 The chromium concentrations before and after the adsorption batch tests at the top, and the examined distribution coefficients at the bottom. The solid orange line indicates the distribution coefficient calculated using the distribution of chromium chloro complexes in the 10.9 mol dm−3 – Cl solution demonstrated in Fig. 6(a). | ||
As shown in Fig. 7, no adsorption was observed in the solution just after preparation, and then the amount of adsorption slightly increased. However, the chromium concentrations in the final solutions two and four weeks after preparation were at the equivalent level. This means that an equilibrium state in a concentrated HCl solution was attained in two weeks. This implies that a chromium aqua and chloro complex in a concentrated HCl solution attains equilibrium faster than that in a diluted HCl solution.
The distribution coefficient determined by the batch experiment was less than that assessed from the distribution of chromium aqua and chloro complexes shown in Fig. 6(b). It is supposed that the difference was caused by competition between the negatively charged chromium chloro complex of [CrIIICl4(H2O)2]− and Cl− ion for adsorption on a functional group, especially in a concentrated chloride aqueous media. Furthermore, it is possible that 10 min was too short a time to attain a steady state.
Thus, it was confirmed that the chromium species adsorbs on a strong basic anion exchange resin in an 11.6 mol dm−3 – HCl solution. It is deduced that a negatively charged chromium aqua and chloro complex is formed, although most literature has reported that the maximum coordination number of Cl− ligands to CrIII atom was three.10–21 [CrIIICl3(H2O)x]0 is a neutral species not adsorbed on anion exchanger. Adsorption of chromium species from a concentrated HCl solution ensures the (0134) model is a realistic model.
3.2 Analysis of X-ray absorption spectra
The EXAFS spectra of the individual species were acquired for the structure analysis. Dividing the series of the XANES and EXAFS spectra by the distribution of chromium chloro complexes in the sample solutions for XAFS measurement yielded the XANES and EXAFS spectra of the individual species. The distribution, the XANES, and the EXAFS spectra are shown in Fig. 8.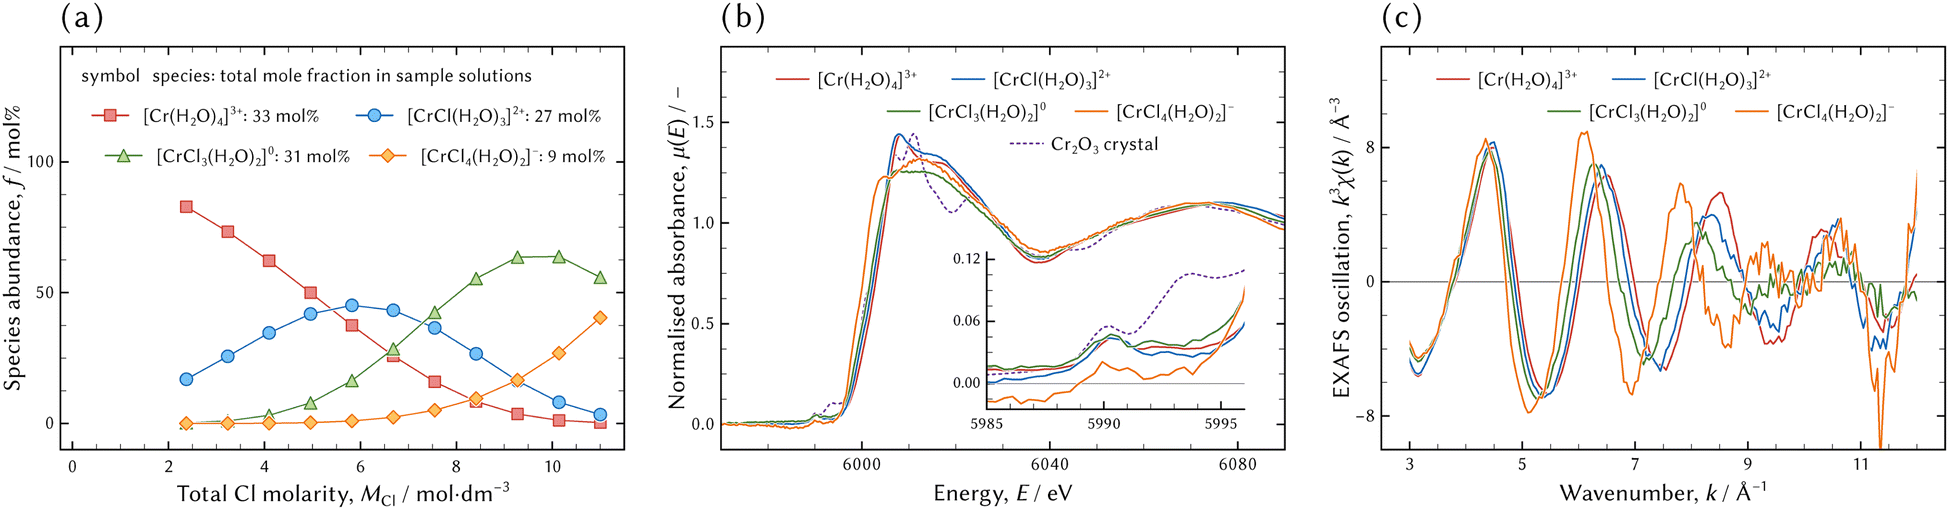 | ||
| Fig. 8 The distribution of chromium aqua and chloro complexes in the sample solutions for XAS measurement (a). The total mole fractions of the species in all sample solutions for XAS measurement are exhibited next to each species. The XANES (b) and EXAFS (c) spectra of the individual species obtained by matrix division of eqn (9b). The XANES spectrum of a Cr2O3 crystal is displayed in (b) for comparison. The rising slope of the Cr2O3 crystal at the absorption edge is almost hidden by that of [CrIIICl3(H2O)2]0. | ||
The XANES spectrum of [CrIIICl4(H2O)2]− was hardly acceptable because it had a negative intensity around the pre-edge peak (at 5990 eV) and it was noisier than the others. In addition, the slope of [CrIIICl4(H2O)2]− around the absorption edge was steeper than the others including Cr2O3, which was fully oxidised to three. The steeper slope implies that [CrIIICl4(H2O)2]− was more oxidised than Cr2O3; however that is impossible. This was for the same reason that the EXAFS spectrum of [CrIIICl4(H2O)2]− was not qualified enough. The stronger activity of Cl− would be necessary to acquire a better spectrum, but it was impossible under the conditions of the present study.
 | (11) |
It was judged that the model was inappropriate if any of the indices was outside the ranges. The thermodynamic model fitting analysis in the present study could not deal with the H2O coordination; therefore determination of the coordination number of the H2O ligands was involved in the structure analysis. Various possible coordination geometries were assumed and fitted to the obtained individual EXAFS spectra.
Table 4 shows the results of the FEFF fitting analysis when the (0134) model was assumed. Fig. 9 shows a visual representation of FEFF fitting analysis of the best possible structures, that is to say a planar square of [CrIII(H2O)4]3+, a distorted tetrahedron of [CrIIICl(H2O)3]2+, a trigonal bipyramid of [CrIIICl3(H2O)2]0, and a distorted octahedron of [CrIIICl4(H2O)2]−. In addition, magnitudes of Fourier transforms of the EXAFS oscillations are displayed in Fig. 10.
| Coord. number of | Assumed model | Point group | R-Factor, R (—) | Path | Coord. num. | Edge to model, ΔE (eV) | Shell distance, R (Å) | Debye–Waller factor, σ2 (Å2) | ||
|---|---|---|---|---|---|---|---|---|---|---|
| Cl | H2O | Chemical formulaa | Geometry configurationa | |||||||
| a Chemical formulae and geometry configurations in bold face are the best possible chromium aqua and chloro complexes among species whose coordination numbers of Cl− ligands are equal.b The values are out of an acceptable range. | ||||||||||
| 0 | 4 | [CrIII(H2O)4]3+ | Planar square | D4h | 0.0313 | Cr–O | 4 | 0.008 | 1.983 | 0.00264 |
| Tetrahedron | Td | 0.0423 | Cr–O | 4 | −0.024 | 1.982 | 0.00265 | |||
| 5 | [CrIII(H2O)5]3+ | Trigonal bipyramid | D3h | 0.0452 | Cr–O | 5 | −0.771 | 1.980 | 0.00439 | |
| 6 | [CrIII(H2O)6]3+ | Octahedron | Oh | 0.0922b | Cr–O | 6 | −1.76 | 1.978 | 0.00611 | |
| 1 | 2 | [CrIIICl(H2O)2]2+ | Planar isosceles triangle | C2v | 0.0538b | Cr–O | 2 | −2.06 | 1.950 | −0.00254b |
| Cr–Cl | 1 | −6.32 | 2.229 | −0.00002b | ||||||
| 3 | [CrIIICl(H2O)3]2+ | Planar kite | C2v | 0.0341 | Cr–O | 3 | −2.84 | 1.962 | 0.00085b | |
| Cr–Cl | 1 | −0.748 | 2.263 | 0.00307 | ||||||
| Distorted tetrahedron | C3v | 0.0340 | Cr–O | 3 | −2.87 | 1.962 | 0.00086b | |||
| Cr–Cl | 1 | −0.697 | 2.263 | 0.00309 | ||||||
| 5 | [CrIIICl(H2O)5]2+ | Distorted octahedron | C4v | 0.0288 | Cr–O | 5 | −3.13 | 1.978 | 0.00531 | |
| Cr–Cl | 1 | 15.3b | 2.356 | 0.00945 | ||||||
| 3 | 0 | [CrIIICl3]0 | Planar triangle | C3h | 0.169b | Cr–Cl | 3 | −11.4b | 2.184 | 0.00786 |
| 1 | [CrIIICl3(H2O)]0 | Distorted tetrahedron | C3v | 0.0311 | Cr–O | 1 | −5.66 | 1.939 | − 0.00263b | |
| Cr–Cl | 3 | −6.21 | 2.240 | 0.00689 | ||||||
| 2 | [CrIIICl3(H2O)2]0 | Trigonal bipyramid | D3h | 0.0358 | Cr–O | 2 | −9.94 | 1.948 | 0.00242 | |
| Cr–Cl | 3 | −1.23 | 2.269 | 0.00929 | ||||||
| 4 | 0 | [CrIIICl4]− | Planar square | D4h | 0.134b | Cr–Cl | 4 | −1.63 | 2.302 | 0.00807 |
| Tetrahedron | Td | 0.111b | Cr–Cl | 4 | −1.52 | 2.303 | 0.00799 | |||
| 2 | [CrIIICl4(H2O)2]− | Distorted octahedron | D4h | 0.0486 | Cr–O | 2 | −12.4b | 1.983 | 0.00339 | |
| Cr–Cl | 4 | 2.84 | 2.336 | 0.00809 | ||||||
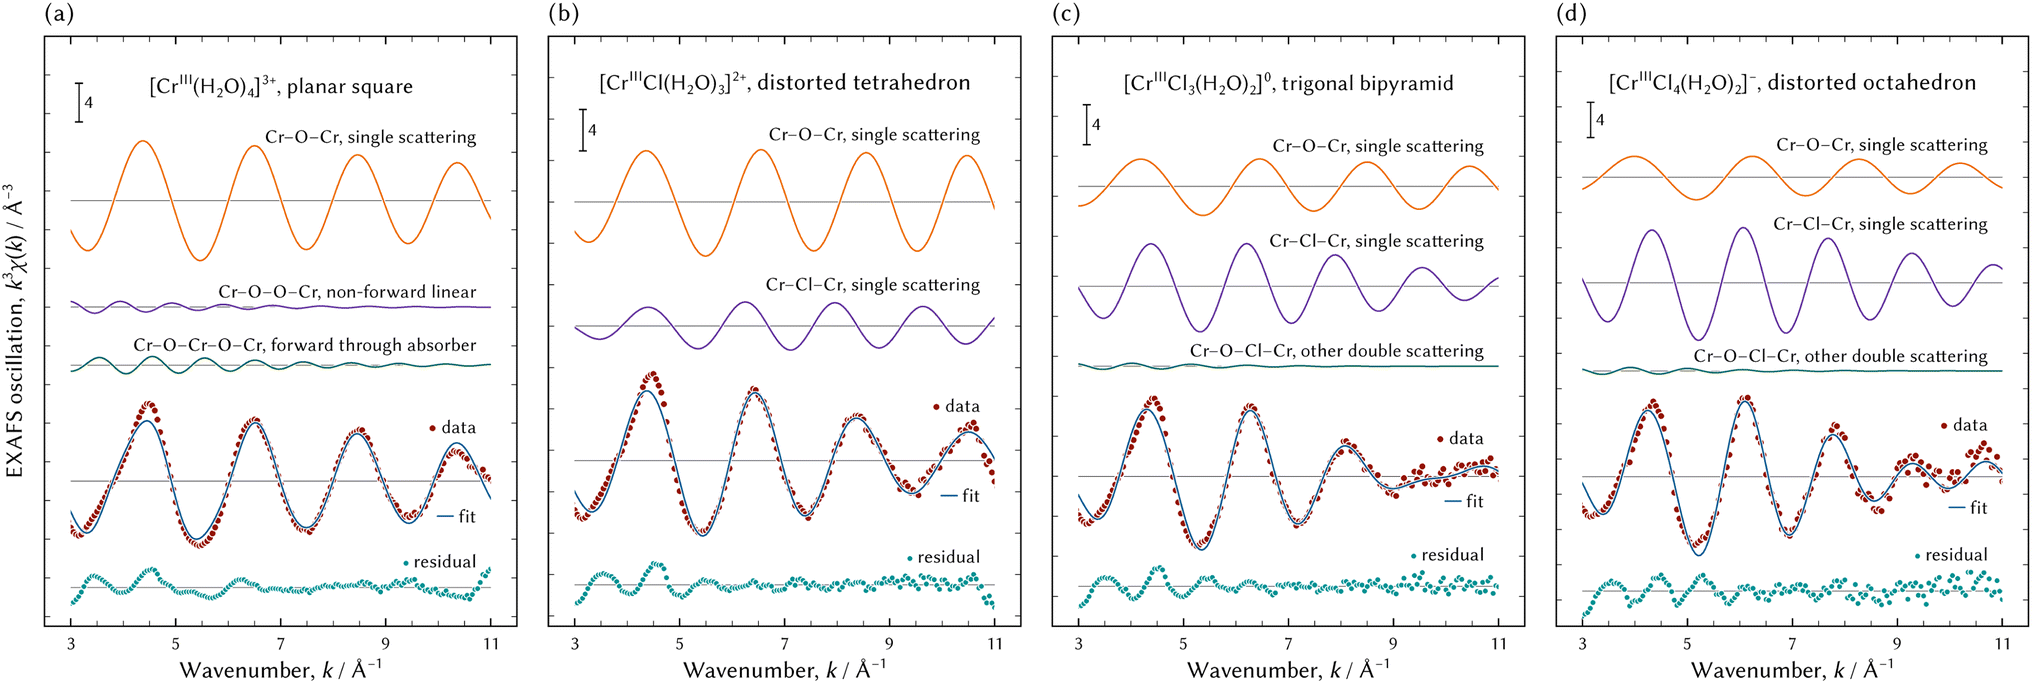 | ||
| Fig. 9 Examples of FEFF fitting analyses of chromium aqua and chloro complexes. | ||
 | ||
| Fig. 10 The representation of the magnitudes of the Fourier transforms of the observed EXAFS oscillations using the best possible geometry configurations. | ||
Geometry configurations of [CrIII(H2O)4]3+ and [CrIIICl(H2O)3]2+ had four-fold coordination, although previous literature reported all chromium aqua and chloro complexes had six-fold coordination and an octahedral geometry configuration.10–21
As for the chromium aqua complex without Cl ligands, the R-factor of the planar square of [CrIII(H2O)4]3+ was the smallest and it was deduced that it was the best possible structure. Previous literature reported that the chromium aqua complex was in octahedral geometry having six H2O ligands.11,12,14–20 Fitting an octahedral [CrIII(H2O)6]3+ model to the EXAFS spectrum yielded an R-factor of 0.0922, which indicates the assumed theoretical model was inappropriate. The extracted signal of the chromium aqua complex was qualified enough to be analysed because the total fraction of [CrIII(H2O)4]3+ was 33 mol% in the sample solutions.
It is generally considered that the coordination number of H2O ligands decreases with the increase in Cl molarity. Hence, it was deduced that the coordination number of H2O to [CrIIICl(H2O)x]2+ was less than or equal to that to [CrIII(H2O)4]3+, and then x should be less than or equal to four. The R-factors of the planar kite and the distorted tetrahedron of [CrIIICl(H2O)3]2+ were acceptable. It could not be determined which geometry configuration was suitable because the fitting results were equivalent to each other. It should be noted that the Debye–Waller factors of the Cr–O paths in both [CrIIICl(H2O)3]2+ were less than the typical value defined by eqn (11). A Debye–Waller factor represents a displacement of a scatter atom from an average position. An energy surface yielded by ab initio calculation can show the rigidity or flexibility in the position of a ligand. Therefore, an ab initio calculation is necessary for further evaluation. Moreover, a comparison in single point energies calculated by an ab initio technique specifies which geometry configuration is suitable to [CrIIICl(H2O)3]2+.
An acceptable model having three Cl ligands was only a trigonal bipyramid of [CrIIICl3(H2O)2]0. The number of H2O ligands was two, which is certainly less than [CrIIICl(H2O)3]2+.
The model of a distorted octahedron of [CrIIICl4(H2O)2]− was the best possible species among chromium tetrachloro complexes. The maximum peak of the magnitude of the Fourier transforms of the EXAFS oscillations of [CrIIICl4(H2O)2]− shown at the bottom of Fig. 10 is apparently considered to consist of two peaks. In other words, the two paths of Cr–O and Cr–Cl must be assumed to represent the maximum peak. Therefore, models of a planar square or tetrahedral [CrIIICl4]− were not appropriate.
However, the difference in absorption edge between the assumed model of the octahedral [CrIIICl4(H2O)2]− and the examined spectrum was greater than the recommended range defined by eqn (11). As shown in Fig. 8(b) and (c), the XANES and EXAFS spectra of [CrIIICl4(H2O)2]− were noisier than those of the other species. This is because the fraction of [CrIIICl4(H2O)2]− in all examined solutions was 9 mol%, much smaller than the others from 27 mol% to 33 mol%. Therefore, the extracted EXAFS spectrum of [CrIIICl4(H2O)2]− was not fully qualified for structure analysis and the indices defined by eqn (11) should not be fully employed for evaluation.
3.3 Speciation of chromium aqua and chloro complexes in pH 1 solution
Fig. 11 shows the evolution of UV-vis absorption spectra of a pH 1 solution dissolving CrCl3·6H2O, which was collected in order to qualitatively analyse the development in speciation of chromium aqua and chloro complexes. The UV-vis absorption spectrum in an equilibrium state was deemed to be approximately equivalent to that of the 0.3 mol dm−1 – Cl sample solution out of the sample solutions for UV-vis measurement listed in Table 2, because the Cl molarity was 0.4 mol dm−1 originating from CrCl3·6H2O crystal and added HCl.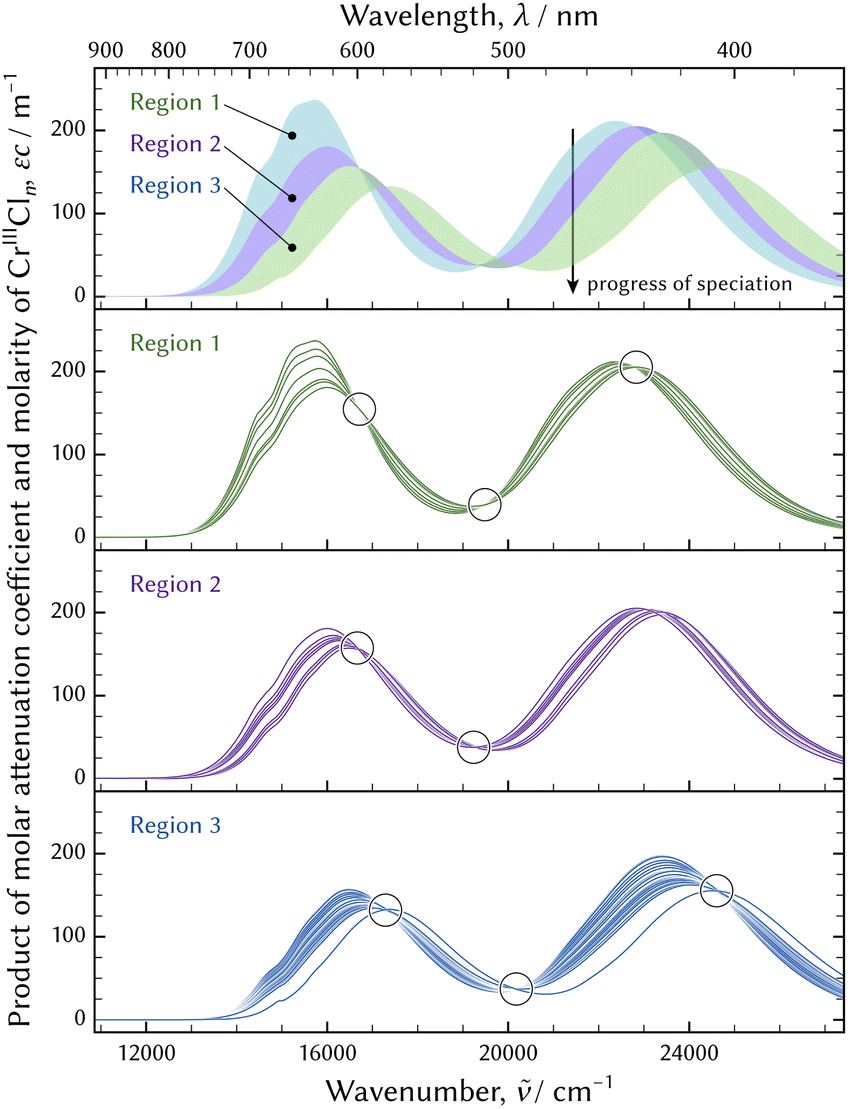 | ||
| Fig. 11 The evolution of UV-vis absorption spectra of a pH 1 solution dissolving CrCl3·6H2O at room temperature. The evolution was divided into three regions and the spectra developed in regions 1, 2, and 3 in turn. The three bottom plots show details of the spectra in each region. Isosbestic points indicated by circles were observed in each plot. | ||
A number of significant components in speciation were evaluated using the first derivative test.6,28 The result of the first derivative test is shown in Fig. 12 and it suggested four significant components.
 | ||
| Fig. 12 The result of the first derivative test6,28 of UV-vis absorption spectra shown in Fig. 11. The red and orange solid lines show the change in the slope when the number of components is four. | ||
The series of the UV-vis absorption spectra in the evolution was decomposed in two ways. One way was extraction of the principal spectra based on the isosbestic points. The evolution of the speciation was divided into three regions and isosbestic points were observed in each region, as shown in Fig. 11. Each region consisted of two components. The final component in one region and the initial component in the subsequent region were considered equivalent. Every spectrum could be reconstructed by fitting a linear combination of the two principal spectra. The other way was mathematical decomposition using the MCR-ALS technique.41
The molar attenuation coefficients of the principal spectra decomposed by the MCR-ALS technique are shown in Fig. 13. The principal spectra extracted based on the isosbestic points were the spectra observed just after preparation, at 15.9 ks, at 20.4 ks, and in an equilibrium state. These were equivalent to those of the initial, the second, the third, and the final components acquired through the MCR-ALS analysis and are not displayed in Fig. 13.
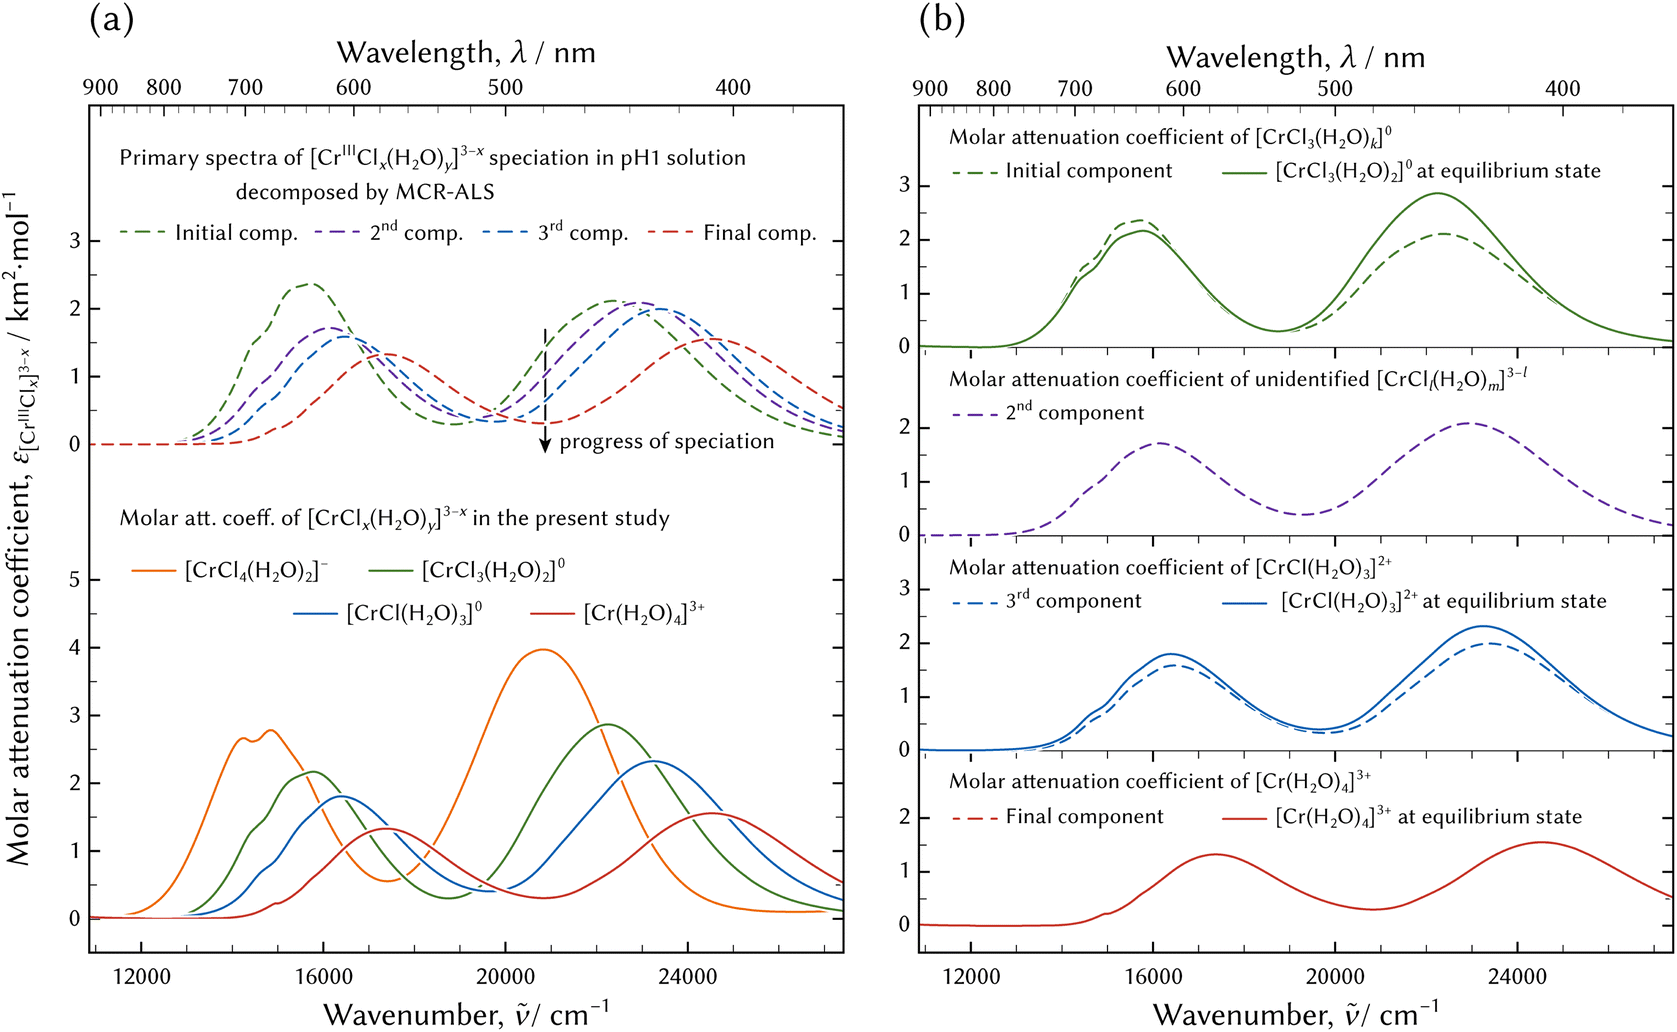 | ||
| Fig. 13 Molar attenuation coefficients of chromium aqua and chloro complexes: arranged by the experiments (a) and by the species (b). In (a), possible species in the evolution of the speciation in the pH 1 solution by dissolving CrCl3·6H2O and decomposed by MCR-ALS technique41 at the top, and species determined through the thermodynamic model fitting at the bottom. The absorption band of [CrIIICl4(H2O)2]− was not found in the evolution of the speciation in the pH 1 solution. | ||
The species development during the evolution to the equilibrium state is shown in Fig. 14. The developments were obtained by the MCR-ALS technique and linear combination fitting of the principal spectra in each region. The R-factor, which is a misfit between the observed and the fitted UV-vis absorption spectra, is larger around the boundary between regions 1 and 2. This implies that the representation of the principal spectra and the species development would contain more distortion compared to region 3.
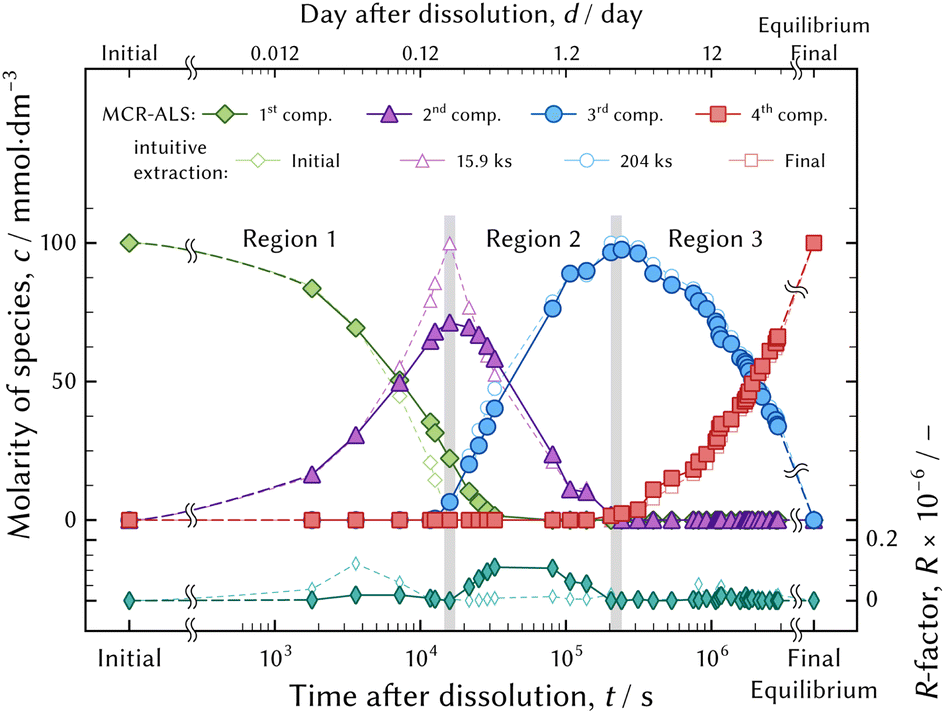 | ||
| Fig. 14 Development of species fraction in the pH 1 solution dissolving CrCl3·6H2O at room temperature obtained by the decomposition of the series of the spectra depending on the time after preparation using the MCR-ALS technique (thick and closed symbols) and the linear combination fitting of the principal components in each region (thin and open symbols). Equilibrium was attained over 30 days, because the solution had not been maintained at a constant temperature and the room temperature had ranged from 10 °C to 25 °C (night and day). The R-factor indicates a misfit between the observed and the fitted absorption spectra. | ||
The kinetic model fitting analysis deserves further investigation to understand the speciation mechanism in detail. An appropriate model would represent the evolution of the speciation as the thermodynamic model fitting analysis represents the series of the UV-vis absorption spectra in equilibrium state.
The absorption spectra of [CrIII(H2O)4]3+ and the final component in the speciation in the pH 1 solution were equivalent. Furthermore, those of [CrIIICl(H2O)3]2+ and the third component were also in good agreement. Therefore, the species of the aqua complex and the monochloro complex determined through the thermodynamic model fitting analysis and the third and the final components acquired through the qualitative analysis of the evolution of the speciation in pH 1 solution were identical.
It is interesting that the absorption bands of [CrIIICl3(H2O)2]0 determined through the thermodynamic model fitting analysis were equal to those of the initial component in the speciation in the pH 1 solution. On the other hand, their intensities were not equal. There is a possibility that the coordination number of Cl was three and that the geometry configuration including the coordination number of H2O ligands might be different. It is necessary to compare the structures between [CrIIICl3(H2O)2]0 and the initial component in the evolution of the speciation in order to reveal any agreement or difference in structure between them.
The absorption bands of the second component in the evolution of the speciation were different from those of the four examined chromium aqua and chloro complexes. The species might be assigned as [CrIIICl2(H2O)m]+ (m = 2 or 3), because the molar attenuation coefficient spectrum and the emerging and diminishing order are positioned between [CrIIICl(H2O)3]2+ and [CrIIICl3(H2O)2]0. The kinetics in speciation must be investigated to determine the unknown complex. The possible species of [CrIIICl2(H2O)m]+ (m = 2 or 3) must diminish when the system attains equilibrium because the species could not be confirmed in the equilibrium state examined in the present study. However, [CrIIICl2(H2O)m]+ (m = 2 or 3) may exist on the way to the equilibrium state; therefore it must be taken into account when considering chemical reactions.
Re. 1:
 | (12a) |
Re. 2:
 | (12b) |
Re. 3:
 | (12c) |
As seen from Fig. 14, reaction (12b) proceeds after reaction (12a) has finished, and so on. Fig. 6(a) and 8(a) show that more than two species exist simultaneously in an equilibrium state except in the diluted HCl solution, although only two species exist in the evolution of the speciation in the pH 1 solution. The speciation mechanism should be clear to estimate fractions of species accurately to build highly efficient processes.
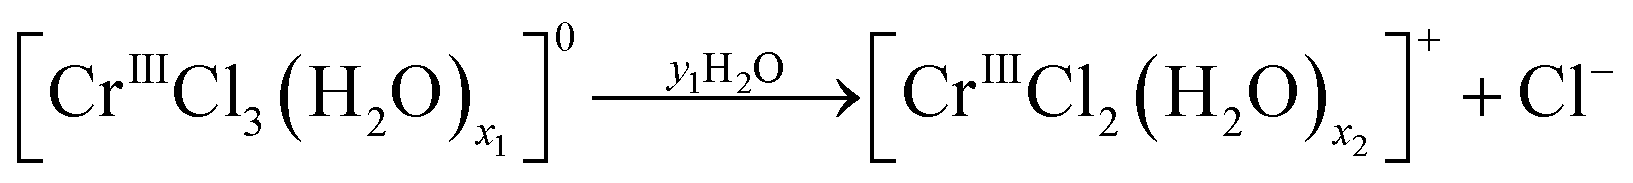
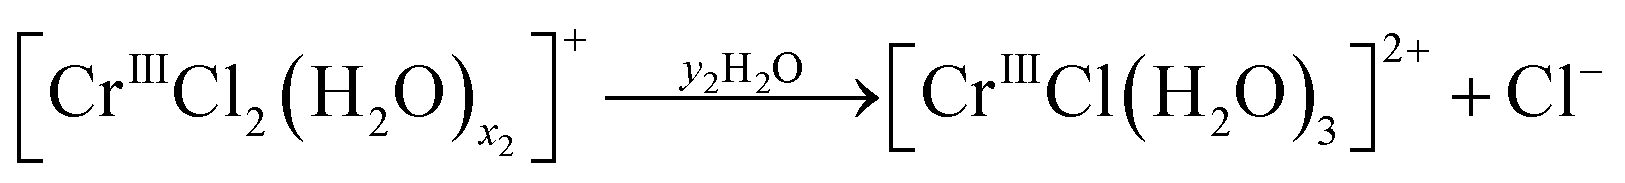
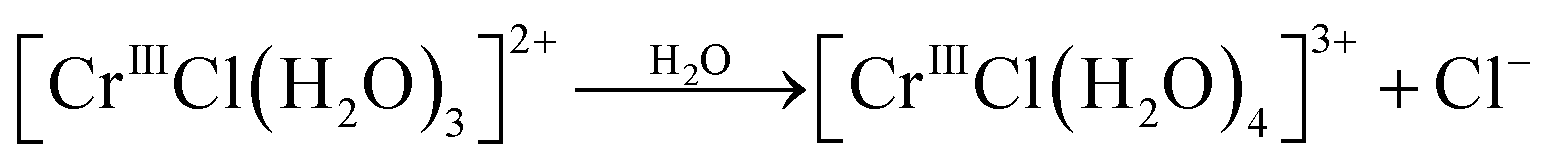
Based on the previous reports, the dissolution and speciation process of chromium aqua and chloro complexes is depicted at the top of Fig. 15.16,24 The crystal structure of trans-[CrIIICl2·4H2O]–Cl·2H2O was determined by I. G. Dance44 and the geometry configuration would be maintained for a while just after dissolution. Therefore, the existence of the octahedral [CrIIICl2(H2O)4]+ was assumed. After dissolution, [CrIIICl2(H2O)4]+ would be transformed by Cl−–H2O ligand exchange depending on the activities of Cl− and H2O.
 | ||
| Fig. 15 The dissolution and speciation process of CrCl3·6H2O crystal in hydrochloric acid solutions: the conventional mechanism at the top16,24 and the mechanism proposed in the present study at the bottom. | ||
On the other hand, another dissolution and speciation process based on the results examined in the present study is proposed at the bottom of Fig. 15.
(1) The geometry configuration of the chromium aqua complex and the chromium monochloro complex is a four-fold configuration, not a six-fold configuration as reported.
(2) There is a possibility that speciation between [CrIIICl(H2O)3]2+ and [CrIIICl3(H2O)2]0 transforms via [CrIIICl2(H2O)m]+ (m = 2 or 3).
(3) CrCl3·6H2O is dissolved as [CrIIICl3(H2O)x]0 not a dichloro complex.
The speciation process was qualitatively analysed, hence, it deserves quantitative analysis in more detail using appropriate conditions.
It is acceptable that a crystal structure is maintained for a while after dissolution. In that case, three Cl ligands should be coordinated to Cr in CrCl3·6H2O crystal as well as in a trigonal bipyramidal [CrIIICl3(H2O)2]0 complex. The structure investigated by I. G. Dance44 was, however, trans-[CrIIICl2·4H2O]–Cl·2H2O where only two Cl ligands were coordinated to Cr. I. G. Dance recrystallised chromium trichloride hexahydrate from water. The structure of CrCl3·6H2O crystal recrystallised from concentrated hydrochloric acid solution should be re-investigated, because solvent may affect the structure of precipitate.
4 Conclusions
The results examined in the present study, which were based on the experimental evidence and the statistical analysis, are different from previous reports.10–21 The authors consider the present investigation to be more reliable than previous ones. The distribution of chromium aqua and chloro complexes was quantitatively determined. On the other hand, the suggested speciation process is also convincing but still qualitative. The kinetic analysis deserves further investigation to understand the speciation mechanism in detail.The present study has revealed that the four chromium aqua and chloro complexes were formed, namely as a planar square of [CrIII(H2O)4]3+, a planar kite or distorted tetrahedron of [CrIIICl(H2O)3]2+, a trigonal bipyramid of [CrIIICl3(H2O)2]0, and a distorted octahedron of [CrIIICl4(H2O)2]−. In addition, the thermodynamic parameters of the formation constants and the Setchénow coefficient of the neutral [CrIIICl3(H2O)2]0 complex were successfully determined.
The distribution of chromium aqua and chloro complexes examined using the thermodynamic model fitting analysis in Section 3.1.2 was validated by the success of the structure analysis, although the structure of [CrIIICl4(H2O)2]− was not firmly determined.
During the speciation development in pH 1 solution, the chromium aqua and chloro complex transformed in the following order.
| [CrIIICl3(H2O)x]0 → [CrIIICl2(H2O)m]+ → [CrIIICl(H2O)4]2+ → [CrIII(H2O)4]3+, | (13) |
The chemical properties obtained in the present study are important information for hydrometallurgical processes, investigation, and so on, involving the chromium aqua and chloro complexes.
Author contributions
Masahito Uchikoshi: project administration, conceptualisation, investigation, software, writing – original draft, Daisuke Akiyama: investigation, Ken'ichi Kimijima: formal analysis, investigation, writing – review and editing, Kozo Shinoda: investigation, writing – review and editing.Conflicts of interest
There are no conflicts of interest to declare.Acknowledgements
The synchrotron radiation experiments of X-ray absorption spectroscopy were performed at BL-9C of Photon Factory under the approval of the Photon Factory Program Advisory Committee (Proposal No. 2019G127). A part of this work was supported by JSPS KAKENHI Grant Number JP18H01759.References
- K. A. Kraus and F. Nelson, Proc. Int. Conf. Peaceful Uses of Atomic Energy Geneve, 1995, vol.7, pp. 113–125 Search PubMed.
- I. Billard and L. Švecová, J. Solution Chem., 2018, 47, 1291–1292 CrossRef CAS.
- M. Uchikoshi and T. Kékesi, J. Appl. Electrochem., 2020, 50, 597–608 CrossRef.
- J. Brugger, W. Liu, B. Etschmann, Y. Mei, D. M. Sherman and D. Testemale, Chem. Geol., 2016, 447, 219–253 CrossRef.
- A. Lennartson, Nat. Chem., 2014, 6, 942 CrossRef.
- M. Uchikoshi, D. Akiyama, K. Kimijima and K. Shinoda, ISIJ Int., 2022, 62, 912–921 CrossRef.
- G. S. Pokrovski, E. Desmaele, C. Laskar, E. F. Bazarkina, D. Testemale, J.-L. Hazemann, R. Vuilleumier, A. P. Seitsonen, G. Ferlat and A. M. Saitta, Am. Mineral., 2022, 107, 369–376 CrossRef.
- E. Carocci, L. Truche, M. Cathelineau, M.-C. Caumon and E. F. Bazarkina, Geochim. Cosmochim. Acta, 2022, 317, 306–324 CrossRef.
- H. Yan, W. Sun, J. Liu, X. Tu and X. Ding, Ore Geol. Rev., 2021, 131, 104043 CrossRef.
- N. Bjerrum, Z. Phys. Chem., 1907, 59U, 581–604 CrossRef.
- P. J. Elving and B. Zemel, J. Am. Chem. Soc., 1957, 79, 1281–1285 CrossRef.
- H. S. Gates and E. L. King, J. Am. Chem. Soc., 1958, 80, 5011–5015 CrossRef.
- D. E. Bracken and H. W. Baldwin, Inorg. Chem., 1974, 13, 1325–1329 CrossRef.
- L. Mønsted and O. Mønsted, Acta Chem. Scand., Ser. A, 1978, 32, 19–24 CrossRef.
- M. Magini, J. Chem. Phys., 1980, 73, 2499–2505 CrossRef.
- T. Tsuru, S. Kobayashi and T. Inui, J. Surf. Finish. Soc. Jpn., 1982, 33, 608–613 Search PubMed.
- K. E. Collins, P. S. Bonato, C. Archundia, M. E. L. R. d. Queiroz and C. H. Collins, Chromatographia, 1988, 26, 160–162 CrossRef.
- M. J. Bjerrum and J. Bjerrum, Acta Chem. Scand., 1990, 44, 358–363 CrossRef.
- A. Munoz-Paez and E. S. Marcos, J. Am. Chem. Soc., 1992, 114, 6931–6932 CrossRef.
- S. Díaz-Moreno, A. Muñoz-Páez, J. M. Martínez, R. R. Pappalardo and E. S. Marcos, J. Am. Chem. Soc., 1996, 118, 12654–12664 CrossRef.
- A. Gáspár and P. Buglyó, Chromatographia, 2000, 51, S143–S147 CrossRef.
- T. Fujii, F. Moynier, Q.-Z. Yin and H. Yamana, J. Nucl. Sci. Technol., 2008, 45, 6–9 CrossRef.
- K. K. Larsen, D. Wielandt, M. Schiller and M. Bizzarro, J. Chromatogr. A, 2016, 1443, 162–174 CrossRef.
- M. G. Babechuk, I. C. Kleinhanns, E. Reitter and R. Schoenberg, Geochim. Cosmochim. Acta, 2018, 222, 383–405 CrossRef.
- M. Uchikoshi, K. Shinoda and T. Matsumoto, Adv. X-Ray Chem. Anal., Jpn., 2022, 53, 97–117 Search PubMed.
- M. Uchikoshi and K. Shinoda, Struct. Chem., 2019, 30, 61–74 CrossRef.
- H. W. Borchers, pracma: Practical Numerical Math Functions, 2022 Search PubMed.
- M. Uchikoshi, Bull. Chem. Soc. Jpn., 2019, 92, 1928–1934 CrossRef.
- R Core Team, R: A Language and Environment for Statistical Computing, R Foundation for Statistical Computing, Vienna, Austria, 2022 Search PubMed.
- E. R. Malinowski, Factor Analysis in Chemistry, John Wiley & Sons, 3rd edn, 2002 Search PubMed.
- Practical Guide to Chemometrics, ed. P. Gemperline, CRC Press, 2nd edn, 2006 Search PubMed.
- G. M. Anderson and D. A. Crerar, Thermodynamics in Geochemistry, Oxford University Press, 1993 Search PubMed.
- H. C. Helgeson and D. H. Kirkham, Am. J. Sci., 1974, 274, 1199–1261 CrossRef.
- J. I. Partanen, P. M. Juusola, K. P. Vahteristo and A. J. G. d. Mendonca, J. Solution Chem., 2007-01, 36, 39–59 Search PubMed.
- H. C. Helgeson, D. H. Kirkham and G. C. Flowers, Am. J. Sci., 1981, 281, 1249–1516 CrossRef.
- M. Setchénow, Z. Phys. Chem., 1889, 4U, 117–125 CrossRef.
- W. J. Hamer and Y. Wu, J. Phys. Chem. Ref. Data, 1972, 1, 1047–1100 CrossRef CAS.
- T. Kékesi and M. Isshiki, Mater. Trans. JIM, 1994, 35(6), 406–413 CrossRef.
- B. Ravel and M. Newville, IUCr, J. Synchrotron Radiat., 2005, 12, 537–541 CrossRef CAS PubMed.
- O. Bunau and Y. Joly, J. Phys.: Condens. Matter, 2009, 21, 345501 CrossRef CAS.
- J. Jaumot, A. d. Juan and R. Tauler, Chemom. Intell. Lab. Syst., 2015, 140, 1–12 CrossRef.
- R. Shannon, Acta Crystallogr., Sect. A: Cryst. Phys., Diffr., Theor. Gen. Crystallogr., 1976, 32, 751–767 CrossRef.
- S. Calvin, XAFS for Everyone, CRC Press, 2013 Search PubMed.
- I. G. Dance and H. C. Freeman, Inorg. Chem., 1965, 4, 1555–1561 CrossRef.
| This journal is © The Royal Society of Chemistry 2022 |