 Open Access Article
Enhancement of electrochromic properties using nanostructured amorphous tungsten trioxide thin films†
Cheong-Ha Kimab,
Yu-Sung Kima,
Jin-Young Choia,
In-Sik Leea,
Byung-Chul Chaa,
Dae-Wook Kim *a and
Jewon Lee*b
aAdvanced Manufacturing Process R&D Group, Ulsan Regional Division, Korea Institute of Industrial Technology (KITECH), 55, Jongga-ro, Jung-gu, Ulsan, 44313, Korea. E-mail: dwkim@kitech.re.kr
bDepartment of Nanoscience and Engineering, Inje University, Gimhae, Gyeongnam 50834, Korea. E-mail: jwlee@inje.ac.kr
First published on 9th December 2022
Abstract
Electrochromic technologies have recently attracted attention due to their energy-saving performance for reducing green gas emissions. The materials design and preparation of electrochromic materials with sufficient microstructure and crystallographic features for suitable ion intercalation/deintercalation are essential for high performance and efficiency. In the present work, nanostructured amorphous tungsten trioxide (WO3) films are electrodeposited to enhance electrochromic properties by controlling the pH of electrolytes. Electron microscopy and spectroelectrochemical analysis demonstrate that smaller grain sizes result in larger electrochemical reactive surface areas and shorter ion diffusion lengths. Consequently, the ions efficiently intercalated and deintercalated during the coloring and bleaching states, respectively. In particular, prepared WO3 films at electrolyte pH 1.4 demonstrate high optical modulation (74.83%) and good transmittance switching speeds (1.56 and 2.06 s during coloring and bleaching, respectively) at 650 nm, as well as comparable coloration efficiency (61.92 cm2 C−1 at 650 nm).
Introduction
Greenhouse gas emissions are the main cause of global warming, and are expected to worsen. According to the International Energy Agency (IEA) report, the carbon dioxide emissions and energy consumption of the global building sector are 36% and 39%, respectively.1,2 Thus, an enhancement in energy efficiency in buildings is necessary to reduce carbon dioxide emissions.Electrochromic smart windows have recently attracted attention because of their energy-saving performance, such as solar radiation.3,4 A fundamental of the electrochromic technology is as follows; when voltages are applied to a device, Li+ or H+ ions in the electrolyte migrate to the functional film, and their intercalation and deintercalation processes lead to changes in optical properties, including coloration and transmittance.5–7
Functional film materials can be classified into two types based on their reaction mechanism: anodic (V2O5, NiO, Co3O4, etc.) and cathodic (WO3, TiO2, Nb2O5, etc.) coloration materials.8–15 Among these materials, WO3 has been widely researched as a coloration material in electrochromic devices because of its good coloration efficiency, cycle reversibility, lifetime, and chemical stability.16,17
WO3 has an empty-perovskite structure composed of corner-sharing WO6 octahedra. A cation is available to insert into the interstitial sites, and when a negative potential is applied, a cation is intercalated, which leads to a coloration. However, when a positive potential is applied, an intercalated cation is deintercalated from the interstitial site, leading to bleaching.16,18 These electrochromic reactions can be described as follows.
| WO3 (colorless) + xe− + xM+ → MxWO3 (dark blue) |
Coloration is possible with both amorphous and crystalline WO3, and their reactions are caused by tiny polaron hopping and the Drude model, respectively.19,20 Because of the facile migration of cations in amorphous WO3, it outperforms crystalline WO3 in terms of quick reaction and increased efficiency.20 Moreover, since nanostructured WO3 provide large surface area with shorten ions diffusion length, which could achieve faster intercalation/deintercalation reaction and switching than that of bulk structure.21,22
Meanwhile, there are many methods for preparing WO3 films, such as electrodeposition, laser deposition, spray pyrolysis, thermal evaporation, magnetron sputtering, and hydrothermal methods.7,23–27 Among these, electrodeposition used in this study is widely used for preparing WO3 because of several merits, such as a simple process under room temperature and atmospheric pressure, the possibility of large-area deposition, and low capital cost.28,29
In this study, WO3 films are prepared using electrodeposition for coloration materials, and the electrolyte pH in the bath is controlled by adding perchloric acid (HClO4). Because the variation of electrolyte pH is expected to facilitate controlling film structure. The changes of electrolyte pH imply to control amount of reactant with tungstate species, which can induce variety of nucleation density. As a result, the controlled parameter would affect to structural properties including grain size and film density.
The influence of controlled pH during electrodeposition on nucleation density and their correlation with coloration efficiency is investigated. The most challenging issue in this study is investigating the effect of nucleation density on the electrochromic properties with the reaction speed and efficiency.
Experimental
A fluorine-doped tin oxide (FTO)-coated glass (7 ≤ Ω sq−1) substrates were cut into 0.8 × 3 cm2 pieces and then cleaned with isopropyl alcohol, acetone, and ultrapure water for 20 min. After washing, the FTO glass was air dried. The electrodeposition bath solution was synthesized by mixing 0.515 g sodium tungstate dihydrate (Na2WO4·2H2O) with 125 ml ultrapure water (25 ± 2 °C) and stirring the solution for 30 min. After that, 0.325 ml hydrogen peroxide (H2O2) was added to the solution, and the hydrogen ion concentration (pH) in the bath solution was adjusted between pH 1.8 and 1.2 by adding varying concentrations of HClO4. Additional stirring was performed for 30 min, and then the solution was used as an electrodeposition bath solution. WO3 thin film was prepared using a three-electrode potentiostat/galvanostat (PL-9, Physio Lab) equipment in an electrochemical setup where FTO glass, platinum coil, and Ag/AgCl (sat. 3 M KCl) electrodes were used as working, counter, and reference electrodes, respectively. An area of 0.8 × 1.5 cm2 working electrode was immersed in the bath solution. During the electrodeposition, the bath solution was stirred at 80 rpm, and a constant potential of −630 mV was applied to the working electrode for 360 s. The deposited WO3 film was washed with ultrapure water and dried at room temperature for 24 h for stabilization. The deposited WO3 films at pHs 1.8, 1.6, 1.4, and 1.2 were denoted as pH1.8WO3, pH1.6WO3, pH1.4WO3, and pH1.2WO3, respectively. The crystal structure of the WO3 films was analyzed using X-ray diffraction (XRD, Ultimate IV, Rigaku) with a Cu Kα source (λ = 1.5418 Å) at 2-theta ranging from 20° to 60° with 0.02° step size. The surface morphology, film thickness, and energy dispersive X-ray spectroscopy (EDS) of the WO3 films were measured using a field emission scanning electron microscope (FE-SEM, SU8020, HITACH). An additional surface property was investigated using atomic force microscopy (AFM, XE-100, Park Systems). The electrochemical properties of WO3 films were determined using a three-electrode electrochemical cell with WO3–FTO glass, platinum coil, and Ag/AgCl (sat. 3 M KCl) as working, counter, and reference electrodes, respectively. The electrodes were immersed in 1.0 M lithium perchlorate (LiClO4, Wako, ≥98%) and propylene carbonate (PC, JUNSEI, 98%) electrolyte. The cyclic voltammetry (CV) was measured for two cycles by applying a potential range of −1.0 to +1.0 V at a sweep rate of 50 mV s−1, while the chronoamperometry (CA) was measured by applying the same potential range for 15 s. During chronoamperometry measurement, the optical properties at 650 nm wavelength were measured in situ using a UV-Visible spectrophotometer (UV-Vis, Evolution 220, Thermo).Results and discussion
Preparation of WO3 films
The WO3 films were deposited using the following reactions during the electrodeposition, which was conducted at constant voltages, stirring rate, and time.30| 2WO42− + 4H2O2 → W2O112− + 2OH− + 3H2O |
| HxWO3 → WO3 + xH+ + xe− |
Fig. 1a shows the variation of current density at different pHs of 1.2–1.8 during electrodeposition. The current density tended to increase as the pH decreased. Because the hydrogen ions (H+) that react with peroxytungstate (W2O112−) in the lower pH conditions increase, nucleation density might be increased; thereby, more tungsten bronze (HxWO3) is formed, i.e., decreased electrolyte pH leads to increase nucleation density, resulting in increased current density during electrodeposition. Fig. 1b shows the deposition rate depending on the variation of electrolyte pH. Due to the increased nucleation rate, the thickness of deposited WO3 increases with increasing current density (inset of Fig. 3).
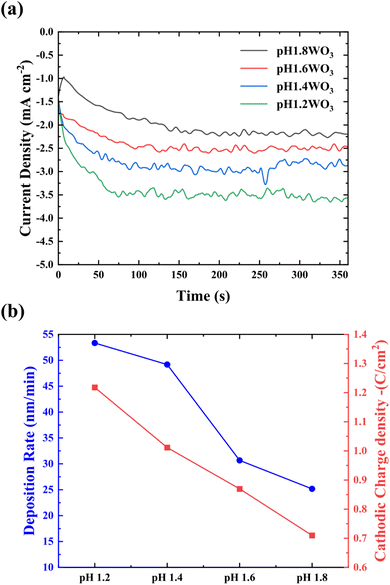 | ||
| Fig. 1 (a) Current density of WO3 deposited at various pH bath levels. (b) Variation of deposition rate (nm/min) with bath pH conditions and cathodic charge density. | ||
Characterization
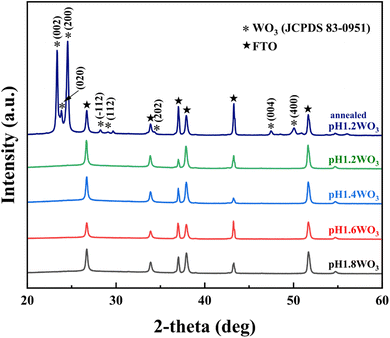
XRD patterns were conducted to examine the crystallinity of the electrodeposited films (Fig. 2). All the films show FTO peaks, and there are no obvious peaks corresponding to WO3. The pH1.2WO3 film was post-annealed at 400 °C to obtain structural information, and then it was compared to others. The post-annealed pH1.2WO3 film showed (002), (020), and (200) peaks of monoclinic tungsten oxide in the XRD patterns,31 implying that all films are formed as amorphous phases. Additionally, the obtained EDS spectra (Fig. S1†) confirmed that the impurities are not formed in the WO3 films. As a result, the nanostructured amorphous WO3 films are successfully prepared.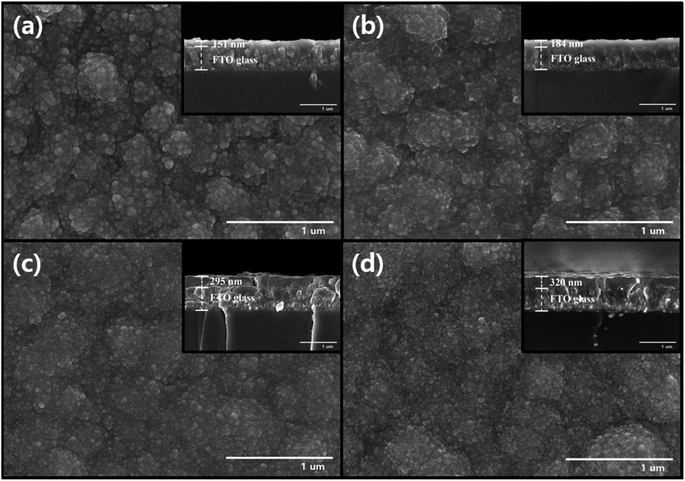 | ||
| Fig. 3 FE-SEM images for surface and cross-section (inset) of the (a) pH1.8WO3, (b) pH1.6WO3, (c) pH1.4WO3, and (d) pH1.2WO3. | ||
Based on the above section, an increasing current density is related to the nucleation rate,32 which highly affects the grain size of WO3. As shown in the FE-SEM images (Fig. 3), the grain size tends to increase as the electrolyte pH increases. The pH1.2WO3 film particularly presented a relatively small grain size and high density. However, such a denser structure could reduce the porosity of films, which might negatively contribute to cation intercalation/deintercalation.
Further investigation of the morphology was examined using AFM. In Fig. 4, the roughness (Rms) linearly decreased with a decrease in pH. These results were consistent with the FE-SEM observations, which showed that a controlled electrolyte pH during electrodeposition could effectively control grain size.
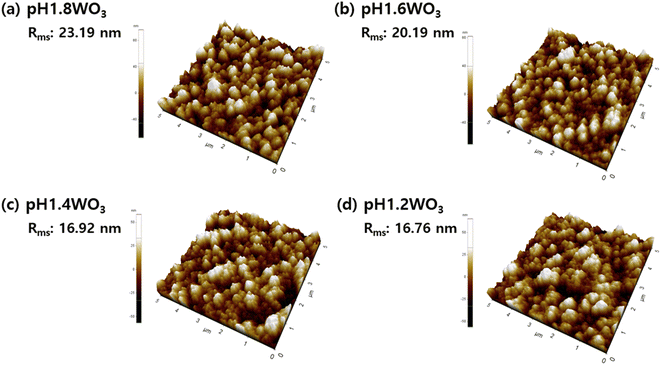 | ||
| Fig. 4 Three-dimensional AFM images of WO3 thin films prepared at (a) pH 1.8, (b) pH 1.6, (c) pH1.4, and (d) pH 1.2. | ||
From the obtained results, the lower electrolyte pH induces small grain size and densified film, i.e., the specific surface area was increased, and the porosity was decreased. Therefore, the effect of these phenomena on the electrochromic properties will be discussed in the electrochemical analysis.
Electrochemistry and spectroelectrochemistry
To examine the morphological effect, the CV with the 1.0 M LiClO4 and PC electrolyte was conducted in the range of −1.0 to +1.0 V (vs. Ag/AgCl). In Fig. 5, the area of CV curves is related to the charge storage capacity, which might be attributed to the specific surface area and film thickness.33,34 Furthermore, the diffusion coefficient of Li+ was calculated using Randles–Sevick's equation.35
 | (1) |
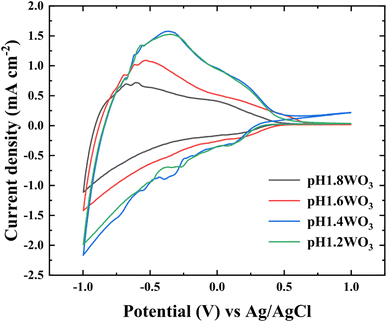 | ||
| Fig. 5 CV curves of the WO3 films prepared at various pH baths. CV curve plotted from −1.0 to +1.0 V at a sweep rate of 50 mV s−1 in the 1.0 M LiClO4 + PC electrolyte. | ||
Table 1 summarizes the kinetic parameters. As predicted, the calculated D presented a tendency to enhance with small grain size, which might originate from the large electrochemical reactive surface areas (ERSA) and shortened Li+ diffusion lengths.6,36 However, small degradation in the pH1.2WO3 might be related to an excessively small grain size, which could create numerous interfaces, thereby increasing interfacial resistance.37
| Index | ic (mA cm−2) | ia (mA cm−2) | Dc (cm s−1) | Da (cm s−1) |
|---|---|---|---|---|
| a ia and Da represent the anodic peak current density and anodic diffusion coefficient. | ||||
| pH1.8WO3 | 1.112 | 0.719 | 3.342 × 10⁻¹³ | 1.396 × 10⁻¹² |
| pH1.6WO3 | 1.419 | 1.091 | 5.441 × 10⁻¹³ | 3.221 × 10⁻¹² |
| pH1.4WO3 | 2.116 | 1.578 | 1.268 × 10⁻¹² | 6.728 × 10⁻¹² |
| pH1.2WO3 | 1.988 | 1.526 | 1.068 × 10⁻¹² | 6.299 × 10⁻¹² |
CA was conducted using 1.0 M LiClO4 with PC electrolyte at 1.0 and −1.0 voltages to evaluate electrochromic performance with the reactivity for ion insertion/extraction. Additionally, UV-Visible spectroscopy (UV-Vis) was used to investigate the velocity of switching between coloring and bleaching (Fig. 6). Fig. S2† shows the transmittance spectra in bleaching and coloration state at wavelength from 300 to 900 nm. The transmittance modulation of WO3 films tended to increase with decreasing electrolyte pH in both visible and near-infrared region.
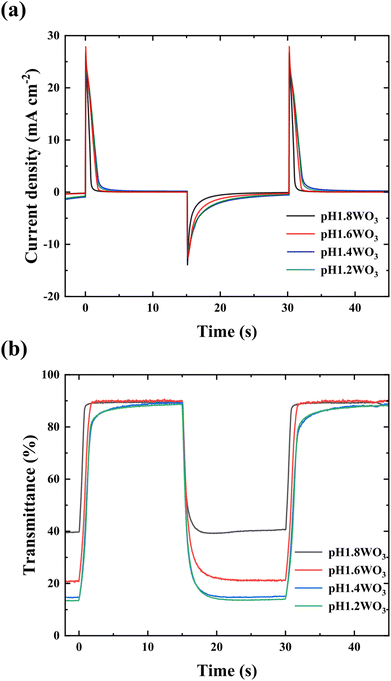 | ||
| Fig. 6 (a) CA curve for WO3 films, potential range −1.0 to +1.0 V (15 s) in LiClO4 + PC electrolyte; (b) electrochromic response recorded at 650 nm wavelength during chronoamperometry. | ||
The charge density (Q) during electrochromic was calculated from the spectra in Fig. 6a using the following equation.38
 | (2) |
The WO3 films exhibited charge densities of 13.99, 20.97, 33.36, and 31.25 mC cm−2 in decreasing order of electrolyte pH. This increasing charge density with decreasing pH trends could be attributed to a relatively large specific surface area and thicker film thickness with increasing active mass.36,39 The slightly lower charge density for pH1.2WO3 is because the film's interior is densified, and the multiple interfaces may disrupt ion intercalation.40,41
Table 2 summarizes the obtained spectroelectrochemical parameters. All films presented sharp spectra during transmittance switching (Fig. 6b), showing a rapid switching time of around 2 s (Table 2). This rapid reaction could be because of the amorphous nanostructure, which could provide large reactive areas with fast ion migration. Additionally, higher charge density at the coloration state results in improved transmittance modulation.
| Index | Tc (%) | Tb (%) | ΔT (%) | tc (s) | tb (s) | Qc (mC cm−2) | Qb (mC cm−2) | Reversibility (%) |
|---|---|---|---|---|---|---|---|---|
| a ΔT = transmittance modulation (ΔT = Tb − Tc), reversibility = (Qb/Qc) × 100. | ||||||||
| pH1.8WO3 | 39.17 | 89.65 | 50.48 | 1.31 | 0.80 | 13.99 | 13.74 | 98.21 |
| pH1.6WO3 | 20.73 | 90.66 | 69.93 | 1.99 | 1.48 | 20.97 | 20.80 | 99.19 |
| pH1.4WO3 | 14.62 | 89.45 | 74.83 | 1.56 | 2.06 | 33.36 | 33.24 | 99.64 |
| pH1.2WO3 | 13.53 | 88.72 | 75.19 | 1.76 | 1.96 | 31.25 | 30.83 | 98.66 |
One of the most important factors is coloration efficiency (CE), which is the rate of inserting charge (Qin) into the film and optical density (ΔOD). CE was calculated from spectroelectrochemical parameters using the following equation.
 | (3) |
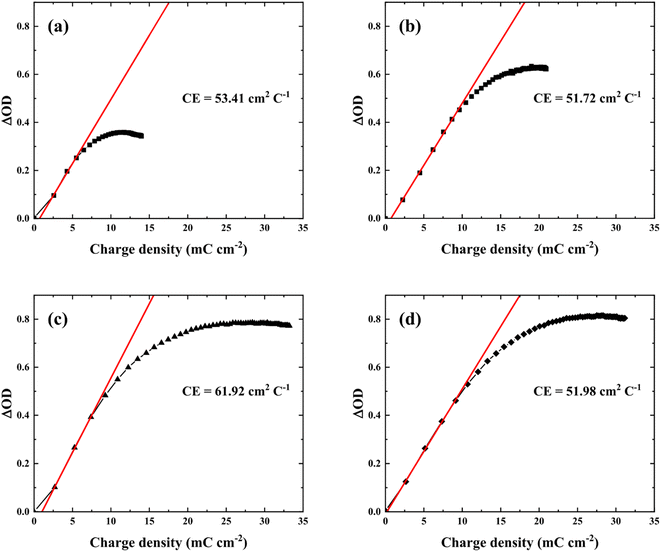 | ||
| Fig. 7 Optical density versus charge density of the WO3 films prepared at various electrolytes pH, (a) pH 1.8, (b) pH 1.6, (c) pH 1.4, and (d) pH 1.2. | ||
Based on the results, an amorphous nanostructure formed by varying nucleation density with electrolyte pH resulted in an effective intercalation/deintercalation reaction with higher CE and rapid switching. In addition, not only tuning surface and inside structure but modifying film thickness would also further improve electrochromic properties. Although pH1.2WO3 had a relatively thicker film, which could not fully utilize its thickness, i.e. large storage volume. Therefore, an investigation of films thickness effects and utilization under optimized pH conditions could lead to further improved electrochromic performance, and providing information of correlation between each parameter.
Furthermore, when compared to other electrochromic devices recently reported (Table 3), the pH1.4WO3 showed more improved switching speed and transmittance modulation with comparable CE.11,23,27,34,44,45
| No. | Method | Morphology | Electrolyte | Transmittance modulation (%) | Switching speed (s) | Coloration efficiency (cm2 C−1) | Ref. | |
|---|---|---|---|---|---|---|---|---|
| tc | tb | |||||||
| 1 | Electrodeposition (pH1.4WO3) | Nanoparticle | 1 M LiClO4/PC | 74.8 (λ = 650 nm) | 1.56 | 2.06 | 61.9 | This study |
| 2 | Spin coating | Nanoparticle | 1 M LiClO4/PC | 54.8 (λ = 633 nm) | 11.7 | 14.6 | 35.9 | 11 |
| 3 | Spin coating | Smooth surface | 1 M PEG![[thin space (1/6-em)]](https://www.rsc.org/images/entities/char_2009.gif) : :![[thin space (1/6-em)]](https://www.rsc.org/images/entities/char_2009.gif) LiI LiI |
40.0 (λ = 633 nm) | 31.7 | 9.6 | 34.8 | 34 |
| 4 | Electrodeposition | Uniform particle | 0.5 M H2SO4 | 36.7 (λ = 633 nm) | 5.3 | 5.1 | 62.4 | 44 |
| 5 | Electrodeposition | Smooth surface | 0.1 M HNO3 | 68.4 (λ = 632 nm) | 3.0 | 1.0 | 41.3 | 27 |
| 6 | Hydrothermal | Coral-like | 1 M LiClO4/PC | 78.1 (λ = 630 nm) | 5.0 | 6.0 | 56.5 | 45 |
| 7 | Hydrothermal | Nanobricks | 0.5 M LiClO4/PC | 28.0 (λ = 630 nm) | 9.7 | 6.9 | 39.3 | 23 |
Conclusions
A series of nanostructured amorphous WO3 films were electrodeposited in a pH-controlled electrolyte. Nucleation density could be controlled with variations in pH, affecting structural differences. The FE-SEM analysis showed that a lower electrolyte pH induces a small grain size; large ERSA and shorter diffusion length promote enhanced electrochromic performance. However, excessively small grain size with fast nucleation causes densified structure, which negatively affects ion diffusion with intercalation/deintercalation. Hence, the appropriate grain size and density of the pH1.4WO3 showed superior electrochromic performance, including higher CE (61.92 cm2 C−1) and transmittance modulation (74.83%) with quick switching. These results will provide explicit experimental evidence for the rational design of efficient coloration film materials by tuning the nanostructure to improve ion intercalation/deintercalation.Conflicts of interest
There are no conflicts to declare.Acknowledgements
This study has been conducted with the support of the Korea Institute of Industrial Technology as “Support Business of Customized Production Technology for Small and Medium Enterprises (kitech UR-22-0038)”. This research was supported by the Commercialization Promotion Agency for R&D Outcomes (COMPA) funded by the Ministry of Science and ICT (MSIT). (2022-RE(N)-S-0161582062860101, Core Technology Development for Plasma-Ready SEM/SEM-EDS System). This research was supported by Korea Research Fellowship program funded by the Ministry of Science and ICT through the National Research Foundation of Korea (2019H1D3A1A01071089).References
- M. A. J. Q. Franco, P. Pawar and X. Wu, Energy Build., 2021, 231, 110561 CrossRef.
- I. Sorar, İ. Bayrak Pehlivan, J. Bohlin, C. G. Granqvist and G. A. Niklasson, Sol. Energy Mater. Sol. Cells, 2020, 218, 110767 CrossRef CAS.
- Y. Yao, Q. Zhao, W. Wei, Z. Chen, Y. Zhu, P. Zhang, Z. Zhang and Y. Gao, Nano Energy, 2020, 68, 104350 CrossRef CAS.
- M. Brzezicki, Sustainability, 2021, 13, 9604 CrossRef CAS.
- C. Y. Ng, K. Abdul Razak and Z. Lockman, Thin Solid Films, 2015, 595, 73–78 CrossRef CAS.
- D. Ma, G. Shi, H. Wang, Q. Zhang and Y. Li, J. Mater. Chem. A, 2013, 1, 684–691 RSC.
- A. Karuppasamy, Appl. Surf. Sci., 2013, 282, 77–83 CrossRef CAS.
- L. Ottaviano, A. Pennisi, F. Simone and A. M. Salvi, Opt. Mater., 2004, 27, 307–313 CrossRef CAS.
- S. Pereira, A. Gonçalves, N. Correia, J. Pinto, L. Pereira, R. Martins and E. Fortunato, Sol. Energy Mater. Sol. Cells, 2014, 120, 109–115 CrossRef CAS.
- X. H. Xia, J. P. Tu, J. Zhang, J. Y. Xiang, X. L. Wang and X. B. Zhao, Sol. Energy Mater. Sol. Cells, 2010, 94, 386–389 CrossRef CAS.
- B.-R. Koo, K.-H. Kim and H.-J. Ahn, Appl. Surf. Sci., 2018, 453, 238–244 CrossRef CAS.
- I. Sorar, E. Pehlivan, G. A. Niklasson and C. G. Granqvist, Sol. Energy Mater. Sol. Cells, 2013, 115, 172–180 CrossRef CAS.
- R. Romero, E. A. Dalchiele, F. Martín, D. Leinen and J. R. Ramos-Barrado, Sol. Energy Mater. Sol. Cells, 2009, 93, 222–229 CrossRef CAS.
- K. N. Kumar, G. Nithya, H. Shaik, B. Hemanth, M. Chethana, K. Kishore, V. Madhavi, R. I. Jafri, S. A. Sattar, J. Gupta and G. V. A. Reddy, Phys. B, 2022, 640, 413932 CrossRef.
- K. N. Kumar, H. Shaik, J. Gupta, S. A. Sattar, R. I. Jafri, A. Pawar, V. Madhavi, G. V. A. Reddy and G. Nithya, Mater. Chem. Phys., 2022, 278, 125706 CrossRef.
- H. Yu, J. Guo, C. Wang, J. Zhang, J. Liu, G. Dong, X. Zhong and X. Diao, Electrochim. Acta, 2020, 332, 135504 CrossRef CAS.
- Y.-C. Nah, A. Ghicov, D. Kim and P. Schmuki, Electrochem. Commun., 2008, 10, 1777–1780 CrossRef CAS.
- V. Madhavi, P. Kondaiah, O. M. Hussain and S. Uthanna, Phys. B, 2014, 454, 141–147 CrossRef CAS.
- S.-H. Lee, H. M. Cheong, J.-G. Zhang, A. Mascarenhas, D. K. Benson and S. K. Deb, Appl. Phys. Lett., 1999, 74, 242–244 CrossRef CAS.
- M. M. El-Nahass, M. M. Saadeldin, H. A. M. Ali and M. Zaghllol, Mater. Sci. Semicond. Process., 2015, 29, 201–205 CrossRef CAS.
- S. Cong, Y. Y. Tian, Q. W. Li, Z. G. Zhao and F. X. Geng, Adv. Mater., 2014, 26, 4260–4267 CrossRef CAS.
- P. Yang, P. Sun, Z. Chai, L. Huang, X. Cai, S. Tan, J. Song and W. Mai, Angew. Chem., Int. Ed., 2014, 126, 12129–12133 CrossRef.
- V. V. Kondalkar, R. R. Kharade, S. S. Mali, R. M. Mane, P. B. Patil, P. S. Patil, S. Choudhury and P. N. Bhosale, Superlattices Microstruct., 2014, 73, 290–295 CrossRef CAS.
- J. M. Ortega, A. I. Martínez, D. R. Acosta and C. R. Magaña, Sol. Energy Mater. Sol. Cells, 2006, 90, 2471–2479 CrossRef CAS.
- K. J. Patel, C. J. Panchal, V. A. Kheraj and M. S. Desai, Mater. Chem. Phys., 2009, 114, 475–478 CrossRef CAS.
- C. Fàbrega, S. Murcia-López, D. Monllor-Satoca, J. D. Prades, M. D. Hernández-Alonso, G. Penelas, J. R. Morante and T. Andreu, Appl. Catal., B, 2016, 189, 133–140 CrossRef.
- Y.-T. Park and K.-T. Lee, Opt. Mater., 2021, 121, 111577 CrossRef CAS.
- J. B. Thorat, S. V. Mohite, A. A. Bagade, T. J. Shinde, V. J. Fulari, K. Y. Rajpure and N. S. Shinde, Mater. Sci. Semicond. Process., 2018, 79, 119–126 CrossRef CAS.
- J.-m. Li, C. Cai, L.-x. Song, J.-f. Li, Z. Zhang, M.-z. Xue and Y.-g. Liu, Trans. Nonferrous Met. Soc. China, 2013, 23, 2300–2306 CrossRef CAS.
- Y. Wang, Z. Meng, H. Chen, T. Li, D. Zheng, Q. Xu, H. Wang, X. Y. Liu and W. Guo, J. Mater. Chem. C, 2019, 7, 1966–1973 RSC.
- K. Thummavichai, L. Trimby, N. Wang, C. D. Wright, Y. Xia and Y. Zhu, J. Phys. Chem. C, 2017, 121, 20498–20506 CrossRef CAS.
- Q. Huang, H. Deligianni and L. T. Romankiw, J. Electrochem. Soc., 2006, 153, 332–336 CrossRef.
- V. S. Kumbhar, J. Lee, Y. Choi, H. Lee, M. Ryuichi, M. Nakayama, W. Lee, H. Oh and K. Lee, Thin Solid Films, 2020, 709, 138214 CrossRef CAS.
- B. Wen-Cheun Au, K.-Y. Chan and D. Knipp, Opt. Mater., 2019, 94, 387–392 CrossRef CAS.
- Z.-j. Xia, H.-l. Wang, Y.-f. Su, P. Tang, M.-j. Dai, H.-j. Lin, Z.-g. Zhang and Q. Shi, Coatings, 2020, 10, 577 CrossRef CAS.
- H. Chen, N. Xu, S. Deng, J. Zhou, Z. Li, H. Ren, J. Chen and J. She, J. Appl. Phys., 2007, 101, 114303 CrossRef.
- S. Wu, B. Yu, Z. Wu, S. Fang, B. Shi and J. Yang, RSC Adv., 2018, 8, 8544–8551 RSC.
- N. Naseri, R. Azimirad, O. Akhavan and A. Z. Moshfegh, Thin Solid Films, 2010, 518, 2250–2257 CrossRef CAS.
- L. Shen, G. Luo, J. Zheng and C. Xu, Electrochim. Acta, 2018, 278, 263–270 CrossRef CAS.
- L. Yang, X. Huang, C. Zou, X. Tao, L. Liu, K. Luo, P. Zeng, Q. Dai, Y. Li, L. Yi, Z. Luo and X. Wang, Ceram. Int., 2021, 47, 18196–18204 CrossRef CAS.
- M. Mirzaeian and P. J. Hall, Electrochim. Acta, 2009, 54, 7444–7451 CrossRef CAS.
- G. Yu, Y. Wang, K. Li, D. Chen, L. Qin, H. Xu, J. Chen, W. Zhang, P. Zhang and Z. Sun, Sustainable Energy Fuels, 2021, 5, 1211–1221 RSC.
- M. Mirzaeian, Q. Abbas, A. Ogwu, P. Hall, M. Goldin, M. Mirzaeian and H. F. Jirandehi, Int. J. Hydrogen Energy, 2017, 42, 25565–25587 CrossRef CAS.
- H. Najafi-Ashtiani, A. Bahari and S. Ghasemi, J. Electroanal. Chem., 2016, 774, 14–21 CrossRef CAS.
- J. Pan, Y. Wang, R. Zheng, M. Wang, Z. Wan, C. Jia, X. Weng, J. Xie and L. Deng, J. Mater. Chem. A, 2019, 7, 13956–13967 RSC.
Footnote |
| † Electronic supplementary information (ESI) available. See DOI: https://doi.org/10.1039/d2ra06472c |
| This journal is © The Royal Society of Chemistry 2022 |


