 Open Access Article
Synthesis of silver nanoclusters by irradiation reduction and detection of Cr3+ ions
Fei Hanb,
Jihao Liac,
Wenrui Wangb,
Mouhua Wanga and
Linfan Li *ac
*ac
aShanghai Institute of Applied Physics, Chinese Academy of Sciences, Shanghai 201800, China. E-mail: lilinfan@sinap.ac.cn
bUniversity of Chinese Academy of Sciences, Beijing 100049, China
cWuwei Institute of New Energy, Gansu 733000, China
First published on 21st November 2022
Abstract
In our work, a simple and fast synthesis method is provided to synthesize silver nanoclusters (AgNCs). In this method, with using polyacrylic acid (PAA) as a template, the silver ions were reduced to silver nanoclusters by irradiation reduction at room temperature. The prepared silver nanoclusters (PAA–AgNCs) with average particle size of 1.98 ± 0.79 nm have a fluorescence property, and their physical and chemical properties can be controlled by absorbed dose, PAA/Ag+ mole ratio and other factors. The fluorescence stability of the PAA–AgNCs is good, and it is unique in that the fluorescence emission of the s PAA–AgNCs depends on the excitation wavelength. In addition, based on the fluorescence quenching phenomenon of PAA–AgNCs in the presence of Cr3+ ion, we established a simple and efficient method for the detection of Cr3+ ion by using PAA–AgNCs as fluorescent probes.
1 Introduction
Recently, metal nanoclusters (MNCs), especially Au nanoclusters and Ag nanoclusters, have attracted great interest because of their superior biological, physical and chemical properties.1 In general, metal nanoclusters consist of several to several hundred metal atoms, most of which are around 2–3 nm in size or less than 2 nm.2 Therefore, it is very important that metal nanoclusters provide a bridge between atoms and nanoparticles. Because they are similar in size to the electron Fermi wavelength,3 metal nanoclusters tend to have discrete energy levels, resulting in their photoluminescence ability.2,4 In particular, silver nanoclusters have excellent fluorescence performance5 and have been proven to be an excellent candidate in fluorescent sensing,6,7 catalysis8 and biological imaging.9,10At present, a large number of synthesis methods of silver nanocluster have been developed, such as chemical reduction,11 photoreduction,12 ultrasonic reduction,13 etc. Although they are widely used in the synthesis of silver nanoclusters,14–16 they often have some limitations, such as complex follow-up processing, the need for sophisticated instruments, low yield and so on. Here, we present a simple, easily controlled irradiation reduction synthesis method of water-soluble silver nanoclusters. Compared with other methods, irradiation reduction has the advantages of uniform and pure products, simple and controllable synthesis process and high yield.17 In irradiation reduction, the key to the reduction process lies in the generation of reducing substances in the irradiation process: water molecules are ionized and excited by high energy gamma rays. And then, a large number of highly active components are produced by gamma rays in the solution, include eaq−, HO˙, H˙ and so on.17,18 Among them, reductive materials such as eaq− can reduce metal ions to form primary particles, which eventually grow into metal nanoclusters in situ.17,19,20 During this process, due to the strong penetration of gamma rays, reducing materials can be produced continuously and uniformly in the solution. On the other hand, the reducing materials come from the interaction between water and gamma rays, so the prepared silver nanoclusters are pure in the system.17,21 Therefore, irradiation reduction in the synthesis of metal nanoclusters shows excellent feasibility.
Here, we report a synthesize method of water-soluble silver nanoclusters (PAA–AgNCs) by irradiation reduction with using PAA as template. As a polyelectrolyte, PAA is an excellent template for the synthesis of silver nanoclusters due to the strong binding ability of the carboxylate groups in PAA to silver ions.22 In our study, the synthetic process and the fluorescence properties of PAA–AgNCs were studied. In addition, we found that the fluorescence of prepared PAA–AgNCs were quenched in the presence of Cr3+ ions. Thus, in this study, we further established an efficient and fast method for the quantitative detection of Cr3+ ions by using prepared PAA–AgNCs as fluorescent probes.
2 Experimental
2.1 Chemicals and materials
Sodium polyacrylate (PAA) was purchased from Sigma-Aldrich (Shanghai, China). Silver nitrate (AgNO3), isopropanol and chromium nitrate (Cr(NO3)3) were purchased from Sinopharm Chemical Reagent Co., Ltd. (Shanghai, China). All chemicals and solvents were analytical reagent (AR) and employed as received without further purification. Milli-Q water was used for all experiments.2.2 Apparatus
The detailed size of prepared silver nanoclusters were observed using high-resolution transmission electron microscopy (HR-TEM; JEM-3000F, JEOL, Ltd.). UV-vis spectra were obtained using a quartz cuvette with absorption wavelengths from 300 nm to 800 nm. Fluorescence intensity was recorded by a FS5 Fluorescence spectrophotometer with an excitation wave length of 517 nm, an excitation and emission slit width of 3/3 nm and a photomultiplier tube voltage of 400 V in emission mode.2.3 Preparation of PAA–AgNCs
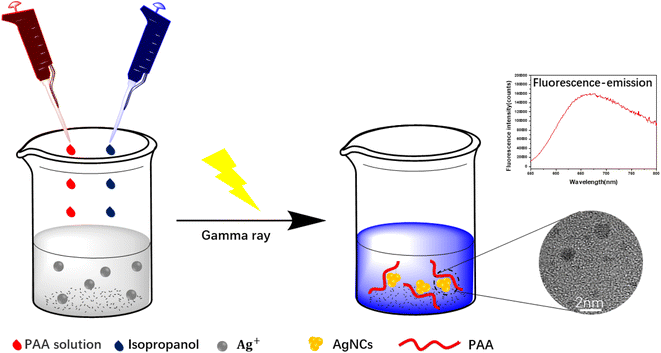
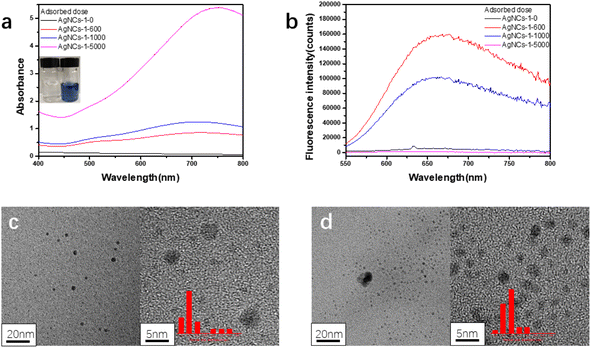
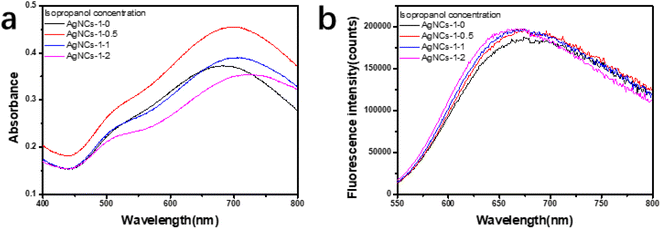
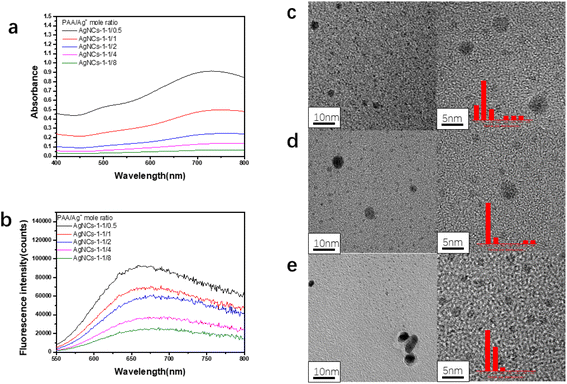
PAA–AgNCs were synthesized by irradiation reduction. First, sodium polyacrylate solution was prepared from sodium polyacrylate powder by 20 min ultrasonic dissolution in 16 mL deionized water. Then, the prepared sodium polyacrylate solution was added to the 4 mL fresh prepared silver nitrate solution drop by drop under agitation, and the mixed solution was stirred for 1 h to make the carboxylate in sodium polyacrylate fully combine with silver ions. Make sure that the concentration of sodium polyacrylate and silver nitrate in the mixture is 0.02 M. Then, 0.601 g isopropanol was added to the mixture as an oxidizing free radical scavenger with vigorous stirring for 1 h. The solution was sparged with N2 for 15 min, and then radiated at appropriate absorbed dose through Co60. The total synthesis process was conducted at room temperature. After irradiation, the solution changes from colorless to blue, the prepared PAA–AgNCs solution were stored in the refrigerator at 4 °C, hidden from light. In order to clearly and accurately describe the synthesis conditions of the sample, the sample synthesized at 600 Gy absorbed dose, 0.02 M silver nitrate concentration, 1/1 molar ratio of PAA to silver nitrate, and 0.5 M isopropanol concentration was named AgNCs-1. In the subsequent experimental exploration, the control variable method with only one variable changed was introduced into the study of the synthesis process of AgNCs.2.4 Fluorescence detection of Cr3+ ions
A stock solution of Cr3+ ions was prepared by dissolving a certain amount of chromium nitrate solid in deionized water. The stock solution of Cr3+ ions was properly diluted into standard working solutions of different concentrations for further research by adding deionized water. Typically, 1 mL of standard working solutions of Cr3+ ions was added into 1 mL of PAA–AgNCs stock solution. Then, the mixture oscillates for 2 hours before fluorescence measurements.2.5 UV-visible spectroscopy
3 mL prepared silver nanoclusters solution was transferred into a quartz cuvette, and then the cuvette was transferred into an ultraviolet spectrophotometer with water as the background reference for measurement.2.6 Fluorescence spectroscopy
400 μL prepared silver nanoclusters solution was transferred into a fluorescent quartz cuvette through a pipette, and then the fluorescent quartz cuvette was transferred into a fluorescence spectrophotometer for measurement.3 Results and discussion
3.1 Synthesis of AgNCs
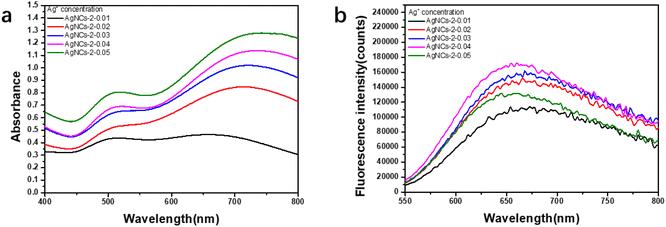
In this work, using PAA as template and isopropanol as oxidative free radical scavenger, silver nanoclusters (PAA–AgNCs) were prepared by gamma ray (Scheme 1), and the silver nanoclusters obtained had smaller particle size and photoluminescence ability. As shown in Fig. 1a, after irradiation, the initially colorless solution gradually turns blue, it has obvious characteristic absorption peaks at 500 nm and 700 nm. Meanwhile, the PAA–AgNCs produced red fluorescence emission at 679 nm upon excitation at 517 nm (Fig. 1b). Fig. 1c shows the TEM image of the prepared PAA–AgNCs. As shown in the Fig. 1c, the prepared silver nanoclusters are all spherical and wrapped in PAA, with an average particle size of 1.98 ± 0.79 nm. This is consistent with other work.23 To investigate the synthesis process of the PAA–AgNCs, we investigated the effects of a series of related parameters on the synthesis process, including absorbed dose, isopropanol content, PAA/Ag+ mole ratio and concentration.3.2 Fluorescence of AgNCs
A unique feature of silver nanoclusters is fluorescence, which is not observed for Ag nanoparticles.5 It can be seen from Fig. 1c that under the excitation at 517 nm, the silver nanocluster (AgNCs-2) produces a red fluorescence emission at 679 nm. The quantum yield is 0.19, calculated by use of rhodamine B in ethanol as a reference. Due to the small size of silver nanoclusters, silver nanoclusters tend to aggregate with each other to form non-fluorescent silver nanoparticles in order to reduce the surface energy, so fluorescence stability is one of the important properties of silver nanoclusters.20 The Fig. 5a shows the fluorescence changes of the nanoclusters with the extension of the storage time. After 30 days of dark storage at 4 °C, the fluorescence intensity was only slightly lower than the initial fluorescence intensity, indicating that the prepared PAA–AgNCs had better fluorescence stability.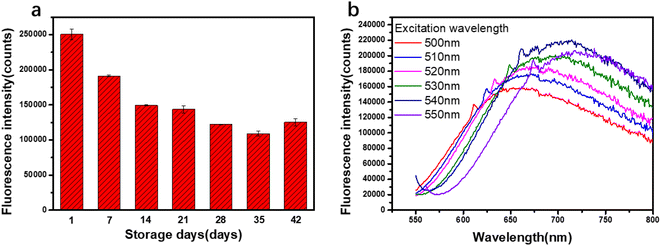 | ||
| Fig. 5 (a) The fluorescence intensity of PAA–AgNCs with different number of storage days; (b) fluorescence spectra of PAA–AgNCs with different excitation wavelengths. | ||
In addition, we found that the fluorescence emission of PAA–AgNCs is dependent on the excitation wavelength. As shown in the Fig. 5b, with the increase of the excitation wavelength, the fluorescence intensity of the silver nanocluster increases first and then decreases, and the maximum fluorescence emission peak appears red shift. This may indicate that the prepared PAA–AgNCs are composed of silver nanoclusters containing a different number of silver atoms. To date, all silver nanoclusters prepared by any synthetic method have generally exhibited this similar phenomenon.4,22,26
3.3 Detection of Cr3+ ions
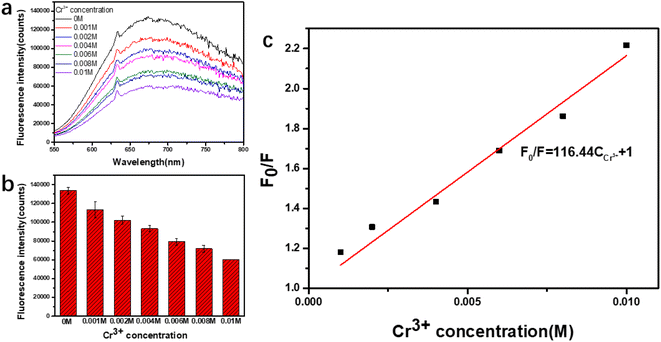
Cr3+ ions can have a serious effect on cell structure by binding to DNA and can do great harm to the human body.27 Meanwhile, it is widely used in agriculture and industry. So it is also an important environmental pollutant.28 Therefore, it is very important to develop a quick and sensitive detection reduction method of Cr3+ ions. The prepared PAA–AgNCs (AgNCs-2) show obvious fluorescence quenching in the presence of Cr3+ ions (Fig. 6a), so the silver nanoclusters synthesized by irradiation method can be used for the detection of Cr3+ ions.To confirm the feasibility of proposed detection strategy, we investigated the fluorescence intensity of prepared PAA–AgNCs in the presence of different concentrations of Cr3+ ions. The obtained fluorescence quenching data were analyzed by Stern–Volmer fluorescence quenching equation:29
 , and the linear correlation coefficient is 0.99865. The detection limit was calculated, following the IUPAC criterion,14 as the concentration of Cr3+ ions which produced an analytical signal three times the standard deviation of the blank signal. The result then suggested a detection limit as low as 0.000703 M. This fully proves that the prepared PAA–AgNCs can be used in detection of Cr3+ ions.
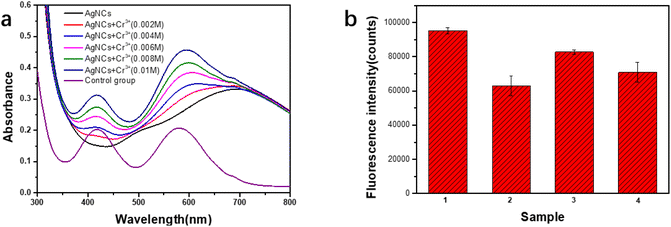
Generally, there are two mechanisms leading to fluorescence quenching of PAA–AgNCs, one is static quenching and the other is dynamic quenching.6 In order to explore the mechanism of fluorescence quenching of PAA–AgNCs by Cr3+ ions, the above two quenching mechanisms were examined. The average FL lifetimes of the PAA–AgNCs (τ0) and PAA–AgNCs with Cr3+ ions (τ) were estimated to be approximately 0.74 ns and 0.62 ns, respectively. The fluorescence lifetime of PAA–AgNCs before and after exposure to Cr3+ ions has only a small change, thus the fluorescence quenching mechanism is more inclined to static quenching.6 It is well known that PAA is a polyelectrolyte, and the carboxylic acid on the molecular chain has coordination effect with many metal ions, and Cr3+ ions is one of them.30 Further, according to the UV-vis spectrum (Fig. 7a), with the addition of Cr3+ ions, the peak of PAA–AgNCs at 500 nm gradually disappeared, and the peak of PAA–AgNCs at 700 nm began to shift to 580 nm of Cr3+ ions, and the characteristic peak at 400 nm of Cr3+ ions appeared with the increase of chromium ion concentration, indicating that a new complex without fluorescence emission was formed between Cr3+ ions and PAA–AgNCs. Meanwhile, under normal circumstances, the fluorescence intensity of PAA–AgNCs decreases significantly in the presence of Cr3+ ions (Fig. 7b). However, when additional PAA exists in the system, part of Cr3+ ions was combined with additional PAA without AgNCs binding, the fluorescence intensity of AgNCs will only decrease slightly (Fig. 7b). In addition, after Cr3+ ions and PAA–AgNCs were fully combined, and PAA was added into the system. For the addition of new PAA, Cr3+ ions and PAA will reach a balance again, so that part of Cr3+ ions that has made PAA–AgNCs fluorescence quenched can be separated from PAA–AgNCs. Therefore, the fluorescence intensity of PAA–AGNCs was also slightly increased (Fig. 7b). This also indirectly proved that added Cr3+ ions would combine with PAA–AgNCs to form a new complex, resulting in fluorescence static quenching of PAA–AgNCs.
4 Conclusion
In summary, the synthesis of water-soluble fluorescent PAA–AgNCs by irradiation reduction using a simple, inexpensive and commercially available polyelectrolyte PAA as template has proved to be a convenient synthetic method. This fluorescent water-soluble silver nanocluster can control the physical and chemical properties simply by changing the synthesis conditions. The excitation wavelengths and emission wavelengths of the PAA–AgNCs were 517 nm and 679 nm, respectively. Meanwhile, a simple and fast method for Cr3+ ions detection was established by using fluorescent PAA–AgNCs as fluorescent probes. In addition, we may expect that this irradiation-reduction method can be extended to the synthesis of other metal nanoclusters.Author contributions
All authors contributed to the study's conception and design. Data collection was performed by Fei Han and Wenrui Wang. Analysis of data was performed by Fei Han and Jihao Li. The first draft of the manuscript was written by Fei Han under the guidance of Linfan Li. Both authors read and approved the final manuscript.Conflicts of interest
There is no conflict of interest to declare.Acknowledgements
This work was supported financially by the Gansu Natural Science Foundation (project no. 20JR10RA778 and no. 20JR10RA777).References
- R. Jin, C. Zeng, M. Zhou and Y. Chen, Chem. Rev., 2016, 116, 10346–10413 CrossRef PubMed.
- L. Shang, S. Dong and G. U. Nienhaus, Nano Today, 2011, 6, 401–418 CrossRef.
- Y. Lu and W. Chen, Chem. Soc. Rev., 2012, 41, 3594–3623 RSC.
- Y. Chen, T. Yang, H. Pan, Y. Yuan, L. Chen, M. Liu, K. Zhang, S. Zhang, P. Wu and J. Xu, J. Am. Chem. Soc., 2014, 136, 1686–1689 CrossRef PubMed.
- I. Diez and R. H. Ras, Nanoscale, 2011, 3, 1963–1970 RSC.
- C. C. Hsu, Y. Y. Chao, S. W. Wang and Y. L. Chen, Talanta, 2019, 204, 484–490 CrossRef CAS.
- L. Burratti, E. Ciotta, E. Bolli, S. Kaciulis, M. Casalboni, F. De Matteis, A. Garzón-Manjón, C. Scheu, R. Pizzoferrato and P. Prosposito, Colloids Surf., A, 2019, 579, 8 CrossRef.
- Y. Lu, Y. Mei, M. Schrinner, M. Ballauff, M. W. Moller and J. Breu, J. Phys. Chem. C, 2007, 111, 7676–7681 CrossRef CAS.
- J. Yu, S. Choi and R. M. Dickson, Angew. Chem., Int. Ed. Engl., 2009, 48, 318–320 CrossRef CAS PubMed.
- W. Lesniak, A. U. Bielinska, K. Sun, K. W. Janczak, X. Shi, J. R. Baker and L. P. Balogh, Nano Lett., 2005, 5, 2123–2130 CrossRef CAS PubMed.
- S. Choi, Y. Zhao and J. Yu, J. Photochem. Photobiol., A, 2019, 374, 36–42 CrossRef.
- L. Shang and S. Dong, Chem. Commun., 2008, 1088–1090, 10.1039/b717728c.
- H. Xu and K. S. Suslick, ACS Nano, 2010, 4, 3209–3214 CrossRef.
- W. Guo, J. Yuan and E. Wang, Chem. Commun., 2009, 3395–3397, 10.1039/b821518a.
- J. Shen, Z. Wang, D. Sun, G. Liu, S. Yuan, M. Kurmoo and X. Xin, Nanoscale, 2017, 9, 19191–19200 RSC.
- J. Shen, Z. Wang, D. Sun, C. Xia, S. Yuan, P. Sun and X. Xin, ACS Appl. Mater. Interfaces, 2018, 10, 3955–3963 CrossRef CAS.
- S. M. Ghoreishian, S.-M. Kang, G. S. R. Raju, M. Norouzi, S.-C. Jang, H. J. Yun, S. T. Lim, Y.-K. Han, C. Roh and Y. S. Huh, Chem. Eng. J., 2019, 360, 1390–1406 CrossRef CAS.
- S. Singh, A. Guleria, A. K. Singh, M. C. Rath, S. Adhikari and S. K. Sarkar, J. Colloid Interface Sci., 2013, 398, 112–119 CrossRef PubMed.
- A. Abedini, A. R. Daud, M. A. A. Hamid, N. K. Othman and E. Saion, Nanoscale Res. Lett., 2013, 8, 10 CrossRef.
- H. X. Xu and K. S. Suslick, Adv. Mater., 2010, 22, 1078–1082 CrossRef CAS.
- L. He, L. F. Dumée, D. Liu, L. Velleman, F. She, C. Banos, J. B. Davies and L. Kong, RSC Adv., 2015, 5, 10707–10715 RSC.
- Z. Shen, H. Duan and H. Frey, Adv. Mater., 2007, 19, 349–352 CrossRef.
- Y. Ding, J. Gao, X. Yang, J. He, Z. Zhou and Y. Hu, Adv. Powder Technol., 2014, 25, 244–249 CrossRef.
- L. Shang and S. Dong, Biosens. Bioelectron., 2009, 24, 1569–1573 CrossRef PubMed.
- R. Konradi and J. r. Ruhe, Macromolecules, 2005, 38, 4345–4354 CrossRef.
- L. Lu, X. An and W. Huang, Anal. Methods, 2017, 9, 23–27 RSC.
- R. Bencheikh-latmani, A. Obraztsova, M. R. Mackey, M. H. Ellisman and B. M. Tebo, Environ. Sci. Technol., 2007, 41, 214–220 CrossRef CAS.
- J. R. Peralta-Videa, M. L. Lopez, M. Narayan, G. Saupe and J. Gardea-Torresdey, Int. J. Biochem. Cell Biol., 2009, 41, 1665–1677 CrossRef CAS PubMed.
- M. H. Gehlen, J. Photochem. Photobiol., C, 2020, 42, 14 CrossRef.
- K. Ma, L. Zhao, Z. Jiang, Y. Y. Huang and X. P. Sun, Polym. Compos., 2018, 39, 1223–1233 CrossRef CAS.
| This journal is © The Royal Society of Chemistry 2022 |

