 Open Access Article
Tb3+ and Sm3+ co-doped Ca2La3(SiO4)3F phosphor: synthesis, color regulation, and luminescence properties†
Kun Nie *ab,
Ranran Zhoua,
Chi-An Chengc,
Xiuqiang Duana,
Ziyao Hua,
Lefu Meid,
Haikun Liue,
Luoxin Wanga,
Hua Wanga and
Xiaoxue Ma*a
aState Key Laboratory of New Textile Materials & Advanced Processing Technology, Hubei Key Laboratory for New Textile Materials and Applications, School of Materials Science and Engineering, Wuhan Textile University, Wuhan 430200, P. R. China. E-mail: knie@wtu.edu.cn; maxiaoxue2010@126.com
bKey Laboratory of Testing and Tracing of Rare Earth Products for State Market Regulation, Jiangxi University of Science and Technology, Ganzhou 341000, P. R. China
cDepartment of Bioengineering, University of California Los Angeles, Los Angeles 90095, California, USA
dBeijing Key Laboratory of Materials Utilization of Nonmetallic Minerals and Solid Wastes, National Laboratory of Mineral Materials, School of Materials Sciences and Technology, China University of Geosciences, Beijing 100083, P. R. China
eDepartment of Energy and Chemical Engineering, Dongguan University of Technology, Dongguan 523808, China
First published on 21st November 2022
Abstract
The polychromatic phosphor with an apatite structure Ca2La3(SiO4)3F:0.15Tb3+,xSm3+ (CLSOF:0.15Tb3+,xSm3+) was synthesized via a solid-state route. The phase and morphology of the phosphor has been investigated by means of X-ray diffraction (XRD) and scanning electron microscopy (SEM). The structures of the as-prepared phosphor were verified by means of the Rietveld method. The optical performance was investigated thoroughly and the phosphors could emit multicolor light from short wavelengths to long wavelengths by gradually increasing the doping contents of samarium. All the results support that the energy transfer in CLSOF:0.15Tb3+,xSm3+ contributes to the color tunable property of the phosphor.
1. Introduction
Light emitting diodes (LEDs) are considered to represent the fourth generation of light sources in the general lighting industry because of their exceptional and unique qualities.1–3 Because LEDs possess attractive colors, a tiny form factor, and ease of construction, they have widespread usage in the decoration and night illumination of cities.4–6 Combining phosphors with n-UV chips (350–420 nm) is one approach that LEDs gives practical colors in their light output.7–9 In broad terms, the phosphor is made up of activators as well as hosts (there are situations where sensitizers are included).10 Single-phase multicolor phosphors have seen a lot of advancement in recent years thanks to the realization that they can circumvent certain drawbacks, such as varied light decay times and so on. The ion pair Tb3+→Sm3+ has the potential to generate light of several colors and satisfy our needs. Samarium has the potential to generate red light when used as a phosphor activator, whereas terbium has the potential to emit green light when used as a phosphor sensitizer.11–13An apatite compound is often selected to serve as the host because of its changeable crystal field environment and its strong chemical stability, which is unaffected by the former. M10(XO4)6Y2 is the chemical formula for the apatite structural compound and M might serve as a monovalent cation – usually an alkali metal – but also a trivalent cation like a lanthanide element, or even a divalent cation like an alkaline earth metal; X denotes S, Ge, Si, and P, among others; Y is most commonly shorthand for the element halogen and the element oxygen, both of which function as channel anions.14–16 Compounds of apatite have been the subject of much research in a variety of fields and for several different usages. For instance, Sr9Gd(PO4)5(SiO4)F2,17 Ba2La3(SiO4)3F,18 Ba2La3(SiO4)3Cl,19 etc. Considering that several single-phase multicolor phosphors may be generated via the transfer of energy between rare earth ions, structure regulation allows for the production of many variations that may be generated from the crystal structure of apatite, which has the potential to remarkably increase the variety of luminous materials and give other alternatives for the sector of solid-state lighting. However, as far as we are aware, there have been no reports concerning Ca2La3(SiO4)3F (CLSOF) doped with samarium and terbium as of yet.
We generated the Tb3+→Sm3+ doped with Ca2La3(SiO4)3F phosphor that features an apatite structure so that we could examine its structure as well as its luminescence characteristics, particularly the energy transmission. Adjustable phosphors in the colors green, yellow, orange, and red were produced by progressively modifying the doping ratio of rare earth ions. The host material remained unchanged during this process. Moreover, the structure and spectral features of phosphors were evaluated. The database of information on solid-state lighting might benefit from having a better grasp of this single phase and multicolor phosphor, which is significant both on a theoretical level and in terms of its practical application value.
2. Experimental details
2.1 Sample synthesis
CLSOF:0.15Tb3+,xSm3+ phosphors were produced using a traditional solid-state technique at a high temperature. During the experiment, a reducing atmosphere was not used. The chemicals required include analytical grade CaCO3, SiO2, and NH4HF2, as well as La2O3 (99.99%), Tb4O7 (99.99%), and Sm2O3 (99.99%) with a high purity. On an electronic scale, the chosen compounds were given a weight reading that corresponded to their stoichiometric ratio (0.0001 g accuracy) and had not been treated before and at the time of weighing. Next, all the chemicals were mixed in the same mortar and ground consistently. After that, the homogeneous mixture was placed into a corundum crucible. We subsequently initiated the heating process by placing the crucible that contained the uniform mixture inside a high-temperature tube furnace and the program of the high-temperature furnace needed to ensure that the temperature was kept at 1350 °C for 5 h, before cooling at ambient temperature. The sintered block was ground into powder to facilitate the next structural test and spectral test to fully understand the properties of the phosphor.2.2 Measurement
3. Results and discussions
The crystal structure of the prepared phosphor was evaluated by XRD diffraction technology and the test outcomes are depicted in Fig. 1. The picture is mainly composed of XRD spectra of CLSOF:0.15Tb3+, CLSOF:0.15Tb3+,xSm3+ (x = 0.04, 0.12, 0.18, 0.22, 0.32), CLSOF:0.15Sm3+ phosphors and a Ba2La3(SiO4)3F (BLSOF) standard card (ICSD no. 170852) was used as the reference. It can be observed that the number of diffraction peaks, their strength, and their location were compatible with the typical card diffraction pattern and that there were no impurity peaks present. This demonstrates that we were successful in synthesizing phosphors with an apatite structure in the absence of any additional impurities. A single-phase solid solution compound formed when the cations Sm3+ and Tb3+ were introduced into the lattice in lieu of La3+.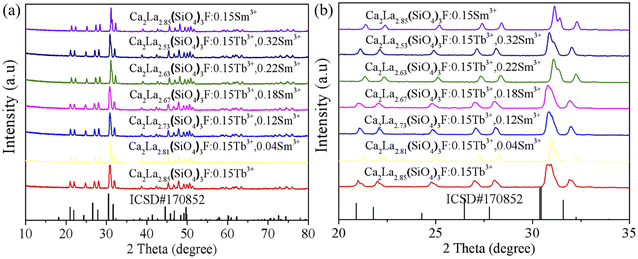 | ||
| Fig. 1 (a) XRD patterns of CLSOF:Tb3+,Sm3+ samples and (b) the enlarged XRD patterns. At the bottom is the standard card of BLSOF (ICSD no. 170852) for comparison. | ||
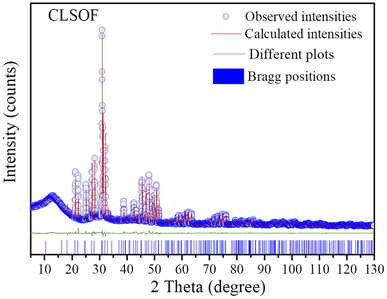
To get the crystallography information, the structure of the phosphor was improved by the use of the Topas 3.0 program and the initial information for Rietveld refinement refers to the crystal structure BLSOF. The Rietveld structure was refined. For the sake of intuition, the obtained results are visualized in Fig. 2. The calculated strength is imaged as the red solid line, the observed strength is imaged as the blue circle, and the refined Bragg diffraction peak position is imaged as the short blue vertical line. The estimated intensity and the actual intensity were compared, and the resulting difference is depicted as a green solid line in the picture. The outcome of convergence could be reached via the process of refining, and lower R factors are depicted in Table 1: Rexp = 4.586%, Rwp = 7.565%, Rp = 5.297%, χ2 = 1.650. The cell parameters are a = b = 9.64300(13) Å, c = 7.10861(11) Å and V = 572.452(18) Å3. The refined atomic coordinates are presented in Table 2 and the isotropic temperature factors for each constituent atom are displayed in CLSOF.
| Formula | CLSOF |
|---|---|
| Space group | P63/m |
| Symmetry | Hexagonal |
| a/b (Å) | 9.64300(13) |
| c (Å) | 7.10861(11) |
| a/b | 90° |
| γ | 120° |
| V (Å3) | 572.452(18) |
| R-Bragg | 6.21411374 |
| Rexp (%) | 4.586 |
| Rwp (%) | 7.565 |
| Rp (%) | 5.297 |
| χ2 | 1.650 |
| Atom | x | y | z | occ | beq |
|---|---|---|---|---|---|
| La2 | 0.24238(28) | 0.99034(37) | 0.25 | 0.55 | 1 |
| Ca2 | 0.24238(28) | 0.99034(37) | 0.25 | 0.45 | 1 |
| La1 | 0.6666667 | 0.3333333 | 0.98354(51) | 0.55 | 1 |
| Ca1 | 0.6666667 | 0.3333333 | 0.98354(51) | 0.45 | 1 |
| Si1 | 0.40932(82) | 0.36937(75) | 0.25 | 1 | 1 |
| O1 | 0.5974 | 0.4496 | 0.25 | 1 | 1 |
| O2 | 0.3442 | 0.4996 | 0.25 | 1 | 1 |
| O3 | 0.356 | 0.2721 | 0.0751 | 1 | 1 |
| F | 0 | 0 | 0.25 | 1 | 2.81 |
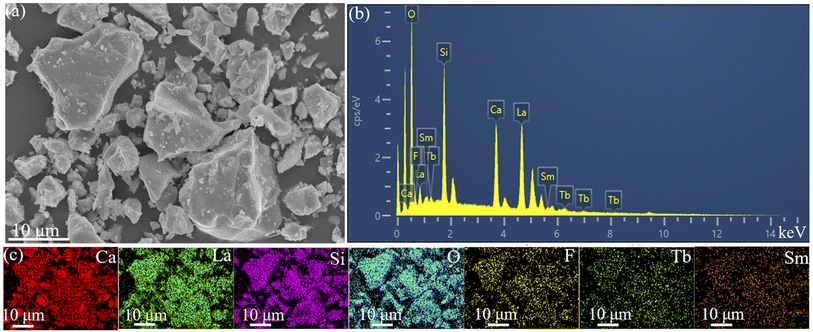
Fig. 3 illustrates the state in the micro world of CLSOF0.15Tb3+,0.12Sm3+. Fig. 3(a) shows the microscopic morphology of the sample, which is irregular and granular. The EDS in Fig. 3(b) depicts the energy spectrum peaks of Ca, La, Si, O, F, Tb, and Sm, which further illustrate the synthesis of the desired samples. The microscopically even distribution of the synthetic sample is demonstrated by the schematic diagram of element distribution that is depicted in Fig. 3(c).
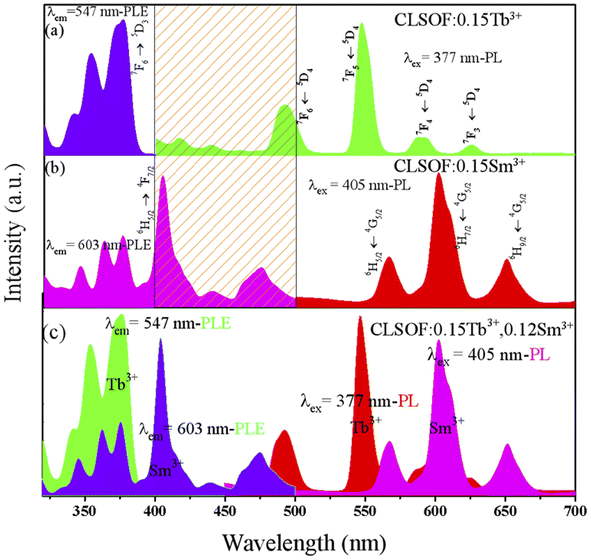
The spectral features of the CLSOF phosphor were examined, especially the excitation and emission spectra. First, the photoluminescence excitation (PLE) and photoluminescence emission (PL) spectra of the CLSOF:0.15Tb3+ phosphors were measured and are depicted in Fig. 4(a). This PLE spectrum displayed the normal excitation peaks of Tb3+ around 325–500 nm, whereas the emission peak with the strongest intensity was detected at 377 nm (7F6 → 5D3). The CLSOF:0.15Tb3+ phosphor exhibited a strong luminescence when it was activated at a wavelength of 377 nm. Four primary emission peaks made up the emission spectrum: 492 nm (5D4 → 7F6 transition), 547 nm (5D4 → 7F5 transition), 592 nm (5D4 → 7F4 transition), and 624 nm (5D4 → 7F3 transition), where the one at 547 nm was the strongest.
Second, Fig. 4(b) displays the results of measurements made on the emission and excitation spectra of the CLSOF:0.15Sm3+ phosphor. The CLSOF:0.15Sm3+ phosphor displayed an intense luminosity when it was stimulated by light with a wavelength of 405 nm. Three primary emission peaks that made up the emission spectrum include 567, 603, and 651 nm with a 4G5/2 → 6HJ/2 (J = 5, 7, 9) transition. There is some overlap between the PLE (405 nm, 440 nm, and 474 nm) of Sm3+ and PL (492 nm) of Tb3+, as can be seen in the portion of the slash that is emphasized in Fig. 4(a) and (b), a theoretical foundation has been provided for the transfer of energy from Tb3+ to Sm3+
Fig. 4(c) depicts the PL and PLE spectra of CLSOF:0.15Tb3+,0.12Sm3+ phosphor. Because the only objective of this research was to examine the transmission of energy from Tb3+ to Sm3+, it is essential to choose the excitation light of Tb3+ to inspire the phosphor. The required PL spectrum was achieved when the phosphor was activated by the PLE spectrum of Tb3+ and is illustrated in the purple layer of Fig. 4(c). It should come as no surprise that the emission spectrum was just the superposition of the spectra of samarium and terbium's respective emissions. In the emission spectra that were stimulated by 377 nm, it was possible to locate both the distinctive emission peaks of Sm3+ (such as 4G5/2–6H7/2 at 603 nm) as well as those of Tb3+ (such as 5D4–7F5 at 547 nm). This established the groundwork for future studies about the color adjustment of these particular series of phosphors. An energy level diagram with all the relevant transitions is shown in Fig. S1† to visually illustrate the mechanism of luminescence and energy transfer.
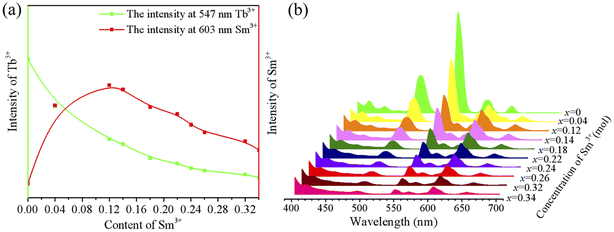
As depicted in Fig. 5, the PL spectra of the CLSOF:0.15Tb3+,xSm3+(x = 0, 0.04, 0.12, 0.14, 0.18, 0.22, 0.24, 0.26, 0.32, 0.34) phosphors were tested, and Tb3+ (at 547 nm) and Sm3+ (at 603 nm) have had their signature spectra investigated in great depth. As illustrated in Fig. 5(a), every emission spectrum has the same general shape, but the strength of the peak fluctuates predictably as the amount of Sm3+ doping increases. This change is easier to understand and more readily apparent in Fig. 5(b): there is a gradual weakening in the peak intensity of Tb3+, which may be due to Tb3+ transferring its energy to Sm3+; in particular, the peak intensity of Sm3+ initially rises, then reaches its highest point at a 0.12 Sm3+ doping content, before beginning to weaken, which may be attributed to the fact that Tb3+ transfers its own energy to Sm3+. These experimental observations provide more evidence of the transfer of energy from Tb3+ to Sm3+. To evaluate the thermal stability of the CLSOF phosphor, we tested the luminous intensity of the phosphor at 298 K, 423 K and 473 K (Fig. S2†), and the luminous intensity retention of the phosphor is shown in Fig. S2.† It can be seen that the phosphor has a good luminous stability when the temperature rises.
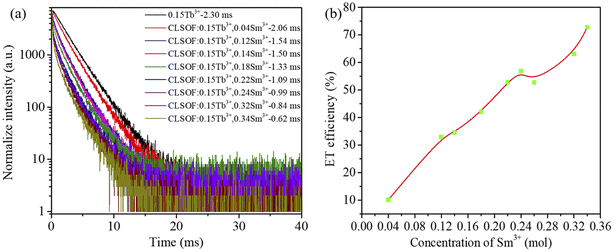
To evaluate the mechanism underlying the Tb3+ → Sm3+ energy transfer, the Tb3+ emission lifetime of CLSOF:0.15Tb3+,xSm3+ which was excited at 377 nm and monitored by 547 nm wavelength were characterized, and the outcomes were consistent with formula (1):20,21
I(t) = I0 + A1![[thin space (1/6-em)]](https://www.rsc.org/images/entities/char_2009.gif) exp(−t/τ1) + A2 exp(−t/τ1) + A2![[thin space (1/6-em)]](https://www.rsc.org/images/entities/char_2009.gif) exp(−t/τ2) exp(−t/τ2)
| (1) |
According to formula (2), the average lifetime could be acquired by the following formula:22,23
| τ∗ = (A1τ12 + A2τ22)/(A1τ1 + A2τ2) | (2) |
Based on the formula, the lifetimes of CLSOF:0.15Tb3+,xSm3+ are obtained. Obviously, the lifetime of Tb3+ is shortened when there is a higher content of Sm3+, which further confirmed the transfer of energy that occurred between Tb3+ and Sm3+ in the CLSOF:0.15Tb3+,xSm3+.
The efficiency of energy transfer in the CLSOF:0.15Tb3+,xSm3+ could be acquired by formula (3):24,25
| η = 1 − (τs/τs0) | (3) |
When the doping content of samarium in the CLSOF:0.15Tb3+,xSm3+ is 0.04, 0.12, 0.14, 0.18, 0.22, 0.24, 0.26, 0.32 and 0.34 mol, the energy transfer efficiency is 10.1%, 32.96%, 34.55%, 42.09%, 52.74%, 56.87%, 52.81%, 63.17% and 72.81%, successively, which is visualized in Fig. 7(b). It is obvious that when there is a higher doping content of samarium, a greater efficiency is observed in the transmission of energy.
The non-radiative energy transfer might be caused by either the exchange interaction or the electric dipole interaction between the sensitizer and the activator, or it could be caused between the activator and the activator. The critical distance analysis allows for the classification of the many types of non-radiative energy transmission. According to BLASSE theory, computation of the critical distance Rc may be done using formula (4) as follows:26–28
| Rc ≈ 2(3V/4πxcN)1/3 | (4) |
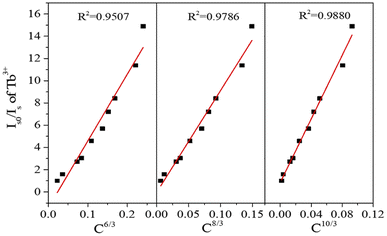
In a general sense, electric dipole interaction may be classified into the following three distinct classifications: dipole–dipole interaction, dipole–quadrupole interaction, and quadrupole–quadrupole interaction. To provide additional evidence on the mode of energy transfer, the following formula (5) was applied:29–31
| (Is0/Is) ∝ Cn/3 | (5) |
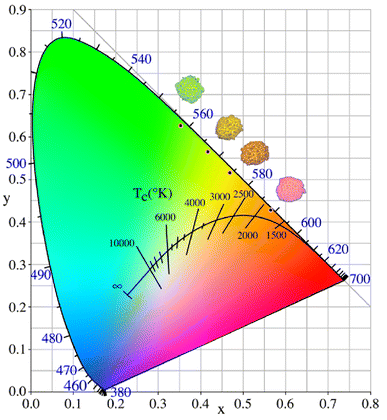
The color coordinates of the CLSOF:0.15Tb3+,xSm3+ phosphor were determined premised on the associated emission spectra, and the findings are displayed in Table 3. Additionally, to make the color change of phosphor more obvious, these color coordinates are marked in the CIE diagram (Fig. 8). It is obvious that the color of the phosphor could be changed from green (0.35, 0.62) to yellow and a reddish color (0.47, 0.51) by modifying the ratio of Tb3+ to Sm3+ in the doping contents. The images displayed from top to bottom in Fig. 8 illustrate the series of phosphors when subjected to irradiation of a 365 nm miner's lamp when the samarium doping level is 0, 0.04, and 0.18 mol of CLSOF:0.15Tb3+,xSm3+ and CLSOF:0.15Sm3+, respectively. In sum, this set of novel single-phase phosphors, CLSOF:0.15Tb3+,xSm3+, demonstrates the benefit of configurable polychromatic luminescence due to the transfer of energy.
| Formula | CIE value |
|---|---|
| Ca2La2.85(SiO4)3F:0.15Tb3+ | (0.3529,0.6262) |
| Ca2La2.81(SiO4)3F:0.15Tb3+,0.04Sm3+ | (0.4175,0.5658) |
| Ca2La2.73(SiO4)3F:0.15Tb3+,0.12Sm3+ | (0.4548,0.5302) |
| Ca2La2.71(SiO4)3F:0.15Tb3+,0.14Sm3+ | (0.4593,0.5620) |
| Ca2La2.67(SiO4)3F:0.15Tb3+,0.18Sm3+ | (0.4691.0.5160) |
| Ca2La2.63(SiO4)3F:0.15Tb3+,0.22Sm3+ | (0.4728.0.5116) |
| Ca2La2.61(SiO4)3F:0.15Tb3+,0.24Sm3+ | (0.4739,0.5098) |
| Ca2La2.59(SiO4)3F:0.15Sm3+,0.26Sm3+ | (0.4741,0.5089) |
| Ca2La2.53(SiO4)3F:0.15Tb3+,0.32Sm3+ | (0.4765,0.5054) |
| Ca2La2.51(SiO4)3F:0.15Tb3+,0.34Sm3+ | (0.4733,0.5068) |
| Ca2La2.51(SiO4)3F:0.15Sm3+ | (0.5648,0.4278) |
4. Conclusions
The conventional high-temperature solid phase approach was adopted to produce a single-phase polychromatic phosphor with the formula as follows: CLSOF:0.15Tb3+,xSm3+. Its structure and optical characteristics have been examined in great depth, and 0.12 mol of Sm3+ has been determined to be the optimal content for use in CLSOF:0.15Tb3+,xSm3+. The quadrupole–quadrupole (q–q) interaction is the mode of energy transmission from Tb3+ to Sm3+ in CLSOF. The color of the phosphors may be altered from green, yellow/orange, and even reddish color depending on the doping ratio of Tb3+/Sm3+. All the features acquired above illustrate that CLSOF:0.15Tb3+,xSm3+ could be one good single-phase multicolor phosphor.Conflicts of interest
The authors declare no competing financial interest.Acknowledgements
This research was supported by Key Laboratory of Testing and Tracing of Rare Earth Products for State Market Regulation (Jiangxi University of Science and Technology) (TTREP2022YB04), the National Natural Science Foundation of China (51872269, 52274273), the Science and Technology Research Project of Hubei Provincial Department of Education (B2021091), the Key Laboratory for New Textile Materials and Applications of Hubei Province (Wuhan Textile University) (FZXCL202107), the Open Project Program of High-Tech Organic Fibers Key Laboratory of Sichuan Province, China and the National Project Cultivation Plan of Wuhan Textile University. The authors would like to thank Liu Nian and Liu Tianying from Shiyanjia Lab (https://www.shiyanjia.com) for the XRD, and SEM characterizations. We sincerely thank Dr Chi-An Cheng of the University of California, Los Angeles, for polishing the paper. This work was partially financially supported by the Guangdong Basic and Applied Basic Research Foundation (2021A1515110283 and 2021A1515110702), the Project funded by China Postdoctoral Science Foundation (2021M702562).Notes and references
- B. Demir and E. Ayas, J. Solid State Chem., 2022, 306, 122783 CrossRef CAS.
- K. Nie, X. Ma, P. Lin, N. Kumar, L. Wang and L. Mei, J. Rare Earths, 2021, 39, 1320–1326 CrossRef CAS.
- H. Qian, C. Fan, F. Hussain, K. Song, X. Luo, W. Su, H. Wang, Q. Huang and L. Yang, J. Lumin., 2021, 235, 117991 CrossRef CAS.
- H. Liu, L. Mei, L. Liao, Y. Zhang, Q. Guo, T. Zhou, Y. Wang and L. Li, J. Alloys Compd., 2019, 770, 1237–1243 CrossRef CAS.
- B. Demir, D. Derince, T. Dayioglu, L. Koroglu, E. Karacaoglu, V. Uz and E. Ayas, Ceram. Int., 2021, 47, 34657–34666 CrossRef CAS.
- W. Yan, J. Li, W. Zhang, X. Gao and P. Zhang, J. Mater. Sci.: Mater. Electron., 2021, 32, 16648–16661 CrossRef CAS.
- P. Dang, G. Li, S. Liang, H. Lian and J. Lin, J. Mater. Chem. C, 2019, 7, 5975–5987 RSC.
- H. Liu, L. Liao, S. M. Aksenov, Q. Guo, L. Mei and D. V. Deyneko, Ceram. Int., 2021, 47, 23300–23308 CrossRef CAS.
- T. Tian, W. Liu, Q. Liu, Y. Zhang, Y. Chu, G. Liu and J. Xu, J. Rare Earths, 2022, 40, 709–716 CrossRef CAS.
- S. Slimi, P. Loiko, K. Bogdanov, A. Volokitina, R. M. Solé, M. Aguiló, F. Díaz, E. Ben Salem and X. Mateos, J. Alloys Compd., 2022, 896, 163109 CrossRef CAS.
- H.-K. Liu, L.-B. Liao, Y.-Y. Zhang, S. M. Aksenov, N. Liu, Q.-F. Guo, D. V. Deyneko, T.-Y. Wang, L.-F. Mei and C.-H. Sun, Rare Met., 2021, 40, 3694–3700 CrossRef CAS.
- Y. Wang, G. Lu, Y. Qiu, W. Sun, S. Qin, Y. Lin, B. Deng, D. Zhang and R. Yu, J. Rare Earths, 2021 DOI:10.1016/j.jre.2021.11.006.
- Y. Yuan, H. Lin, J. A. Cao, Q. Guo, F. Xu, L. Liao and L. Mei, J. Rare Earths, 2021, 39, 621–626 CrossRef CAS.
- L. Dong, L. Zhang, Y. Jia, B. Shao, W. Lü, S. Zhao and H. You, CrystEngComm, 2019, 21, 6226–6237 RSC.
- Y. Zhang, J. Bin, L. Mei and Z. Huang, J. Lumin., 2019, 206, 645–648 CrossRef CAS.
- H. Ye, M. He, T. Zhou, Q. Guo, J. Zhang, L. Liao, L. Mei, H. Liu and M. Runowski, J. Alloys Compd., 2018, 757, 79–86 CrossRef CAS.
- H. Liu, L. Liao, D. Yang, Q. Guo and L. Mei, Ceram. Int., 2016, 42, 16579–16583 CrossRef CAS.
- X. Ma, L. Liao, Q. Guo, H. Liu, T. Zhou and L. Mei, RSC Adv., 2018, 8, 27332–27341 RSC.
- Q. Guo, X. Ma, L. Liao, H. Liu, D. Yang, N. Liu and L. Mei, J. Solid State Chem., 2019, 280, 121009 CrossRef CAS.
- Y. Wu, Y. Zhuang, Y. Lv, K. Ruan and R.-J. Xie, J. Alloys Compd., 2019, 781, 702–709 CrossRef CAS.
- J. Tauc, Mater. Res. Bull., 1968, 3, 37–46 CrossRef CAS.
- T. M. Tolhurst, T. D. Boyko, P. Pust, N. W. Johnson, W. Schnick and A. Moewes, Adv. Opt. Mater., 2015, 3, 546–550 CrossRef CAS.
- D. Xu, W. Zhou, Z. Zhang, X. Ma and Z. Xia, Mater. Res. Bull., 2018, 108, 101–105 CrossRef CAS.
- S. Yan, Y. Jin, D. Pan, G. Xiang, X. Luo and Y. Yang, Ceram. Int., 2018, 44, 19900–19906 CrossRef CAS.
- P. K. Sahu, M. Ramrakhiani and S. Agrawal, J. Fluoresc., 2019, 29, 1249–1255 CrossRef.
- X.-X. Ma, W. Zhou, Z. Zhang, X.-R. Wang, B. Zhang and Y.-C. Guo, J. Lumin., 2018, 199, 82–86 CrossRef.
- Y. Jin, Y. Wang and Y. Wang, Ceram. Int., 2020, 46, 22927–22933 CrossRef.
- X. Ma, L. Liao, Q. Guo, H. Liu, D. Yang, N. Liu and L. Mei, RSC Adv., 2019, 9, 35717–35726 RSC.
- Y. Zhao, S. Wang, Y.-J. Han, J.-Y. Zhang, C. Liu, X.-F. Hu, Z.-W. Zhang and L.-J. Wang, J. Lumin., 2020, 223, 117253 CrossRef CAS.
- R. Zhou, C.-A. Cheng, S. Qiu, J. Chen, K. Nie, M. Wu, P. Lin, H. Wang, L. Wang and L. Mei, RSC Adv., 2021, 11, 28716–28722 RSC.
- Y. Ma, X. Peng, M. Fei, W. Zhang, L. Teng, F. Hu, R. Wei and H. Guo, J. Alloys Compd., 2020, 846, 156435 CrossRef CAS.
Footnote |
| † Electronic supplementary information (ESI) available. See DOI: https://doi.org/10.1039/d2ra06648c |
| This journal is © The Royal Society of Chemistry 2022 |

