 Open Access Article
Development of a new electrochemical method for the determination of copper(II) at trace levels in environmental and food samples†
Endale Tesfaye,
Bhagwan Singh Chandravanshi *,
Negussie Negash and
Merid Tessema
Department of Chemistry, College of Natural and Computational Sciences, Addis Ababa University, P.O. Box 1176, Addis Ababa, Ethiopia. E-mail: bscv2006@yahoo.com
First published on 12th December 2022
Abstract
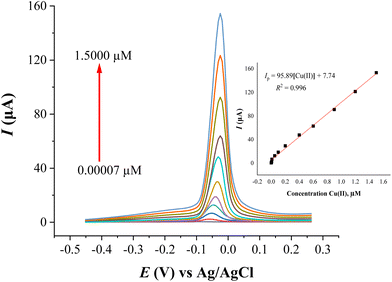
This paper presents the fabrication of a new modified carbon paste electrode (CPE) with N1-hydroxy-N1,N2-diphenylbenzamidine (HDPBA) and functionalized multi-walled carbon nanotubes (MWCNTs) (HDPBA–MWCNTs/CPE) for highly sensitive and selective determination of Cu(II) using the square wave anodic stripping voltammetry (SWASV) technique. The fabricated electrode was characterized using various spectroscopic techniques to study its morphological, structural, and electrochemical properties. The accumulation of Cu(II) on the surface of HDPBA–MWCNTs/CPE was done in 0.1 M ammonium chloride (NH4Cl, pH 5) solution at an applied potential of −0.70 V versus Ag/AgCl for 180 s, followed by electrochemical stripping in the positive scan of the voltammetry after a resting time of 10 s. The developed HDPBA–MWCNTs/CPE was found to be highly selective, sensitive and reproducible. At optimal conditions of the experiment, the proposed method exhibited a very low limit of detection (0.0048 nM Cu(II)), a wide linear dynamic range (0.00007–1.5000 μM Cu(II)), and good reproducibility with relative standard deviation (RSD) value of 3.7%. The effect of various foreign ions on the voltammetric response of Cu(II) was investigated and the electrode was found to be highly selective to Cu(II). The practical applicability of the proposed HDPBA–MWCNTs/CPE was studied by applying the electrode for the quantification of Cu(II) contents in environmental water (wastewater and tap water), soft drink (Fanta and Sprite), and food supplement (commercially available multi-mineral/vitamin tablets) samples. The present method was validated with atomic absorption spectrometry (AAS). The results found from the two methods are in good agreement with a 95% confidence level.
1 Introduction
Heavy metal ions are among the most common environmental pollutants because of their persistence in the environment, bioaccumulation and toxic nature. Sources of these metal ions in the environment can be both natural and anthropogenic activities. The natural sources include volcanic eruptions and weathering of metal-containing rocks, while anthropogenic sources include mining, industrial emissions, smelting, agricultural activities, and combustion of fossil fuels.1 The rapid development of industrialization, agricultural activities and urbanization in the world have caused to an increase in the anthropogenic share of heavy metal ions in the environment.2 These metal ions are released to the atmosphere during smelting, mining, and other industrial activities return to the land through wet and dry deposition. Wastewaters discharges such as domestic sewage and industrial effluents add heavy metal ions to the environment. Combustion of fossil fuels and application of chemical fertilizers also contribute to the anthropogenic input of metal ions in the environment.1,3 Once released from both anthropogenic and natural sources, heavy metals can pollute water bodies, soils and sediments. Finally, due to their persistent nature in the environment, they will contaminate the food chains, and lead different health risks to living organisms.4 Thus, it is essential to assess the degree of heavy metal pollution in water sources and food samples by determining their concentrations.5Environmental pollution is the main cause of the contamination of foods with toxic metal ions. For example, the contamination of the water and the natural composition of raw materials used in the beverage production (water, fruits, and added sugar), packaging materials, and processing technologies are the major factors for the contamination of soft drinks.6 The presence of heavy metals such as Cu, Zn, Fe, Pb, Ni, As, Cd, Mn, etc. in soft drinks may be due to the environmental contamination from water, food, and fruits utilized during production have been reported.6,7 The determination of metals in food supplements (such as multi-vitamin/multi-mineral tablets) have also been reported. Multi-mineral/vitamin tablets are widely used in the world. They contain essential vitamins (such as C and E) and some other minerals. These tablets are good sources of minerals and vitamins, they have no side effects on human health. Trace elements are used as a good supplement for maintaining the human health, but in excess amount/dose they become toxic. Pharmaceutical compounds like multi-mineral/vitamin tablets have different electro-active functional groups which can be detectable by electrochemical determinations.8,9 The contamination of heavy metal ions through the food chain can pose significant hazards to human health even at trace levels due to their bioaccumulation and toxic nature.10
Heavy metals have some biological importance to the plant and animals species. Some essential heavy metals induce physiological and biochemical functions by offering several proteins and enzymes to plants and animals, which have a significant role in redox reactions of metabolism. Beside their physiological and biochemical relevance, the heavy metals are also being widely used in the industrial and domestic applications, and their excess concentrations in the environment has caused to serious health risks.11,12 With the rapid expansion of various factories including paint, electroplating, paper and wood industries; copper gets released and adsorbed in the environments such as water and air which then inters into the food chain.13 Among the natural resources water is very important for all living beings, and water pollution by toxic metal ions may lead severe risk to human health and hygiene if they absorbed in the human body at higher concentration above the permissible level. Therefore, qualitative and quantitative determination of ions including Cu(II) is highly required in day-to-day life.14,15
Copper is one of the essential trace elements required for the human body to maintain a normal process. It is naturally present in some foods and is used as a dietary supplement. However, the excessive intake of copper may cause hepatitis; jaundice, liver cirrhosis, and haemolytic crisis.16 On the other hand, the deficiency of copper is manifested by impaired haematopoiesis, bone metabolism, cardiovascular, and disorders of the digestive and nervous systems.17 Thus, in order to maintain the human health, the Cu(II) content in various water and food samples needed to be monitored to ensure their safety and quality for human consumption.
Determination of heavy metal ions at trace levels is not an easy work. In recent times, various advanced spectroscopic techniques have been used for the determination of metal ions including Cu(II) with satisfactory results. However, these methods have known shortcomings and difficulties such as time consuming, expensiveness, using heavy instruments and unsuitability for the in situ analysis of metals. Moreover, these techniques required several complex steps and skills. In contrast, nowadays, the electrochemical techniques have been applied as the most efficient techniques for the determination of several metal ions due to their excellent sensitivity, easy miniaturization, fast determinations, simple preparation, portability, field-applicability, low-price maintenance, and ability to detect very low concentrations with small sample quantities.18–20
In electrochemical methods, carbon paste electrodes (CPEs) have been mostly used electrodes in the electrochemical sensing of various species of metal ions because of their popularity, including large potential windows, low ohmic resistance, and ease of modification.21 However, the main challenge in the bare CPEs is how to increase their selectivity and sensitivity for the determination of a specific metal ion. In order to achieve this requirement, modification of the unmodified electrodes with the desired properties is very important since modified electrodes can maintain more direct control over their chemical behaviors.22 Modified carbon paste electrodes (MCPEs) are versatile electrodes for the determination of heavy metal ions that have been extensively developed in recent times because of their regenerating ability, large surface area for modification, simple preparation, high sensitivity and selectivity of electrochemical techniques.22–29
Among various types of modifiers, organic ligands have been used for the modification of carbon paste electrodes in the electrochemical determination of metal ions due to their chelating capability with metal ions since they have electron donor atoms such as O, N, S, and P on their chemical structures which can form stable complexes with metals ions. N1-hydroxy-N1,N2-diphenylbenzamidine (HDPBA) (Fig. S1†) is a laboratory-synthesized metal-chelating ligand used in the present study. It can form stable complexes with target metal ions since it has a lone pair electrons of donor groups including –OH and –N functional groups on its chemical structure. The presence of these donor atoms on the structure of HDPBA has provided the ligand an excellent affinity to form stable metal complexes which leads to good selectivity of HDPBA towards the metal ions.30
Multi-walled carbon nanotubes (MWCNTs) have been widely used for the fabrication of chemically modified electrodes due to their novel properties such as high mechanical strength, ordered structure with high aspect ratio, high thermal conductivity, high electrical conductivity, high surface area and metallic or semi-metallic behavior. The combination of these special properties makes MWCNTs unique materials with capability to promote electron transfer reaction and enhance sensitivity in electrochemistry, and thus they are widely used in the development electrochemical sensors.31
The incorporation of MWCNTs materials with specific ligands can offer excellent sensing platforms for the determination of heavy metal ions because of the combination of the large surface area, high conductivity, strong adsorptive capability of the nanomaterials, and the excellent complexing ability of the ligands.32 The selectivity in the determination of metal ions can be improved by their chelation with the ligands.33 HDPBA modified carbon paste electrode has been successfully employed for the electrochemical determination of Hg(II), Cd(II) and Pb(II).27,28,34 However, to the best of our knowledge, carbon paste electrode modified with HDPBA with and without the incorporation of MWCNTs has not been used for the voltammetric determination of copper(II). Therefore, the development of carbon nanotubes/ligands modified CPE is very important for the electrochemical determination of heavy metals with magnificent sensing performance. Hence, this paper aims to develop a new highly sensitive and selective carbon paste electrode modified with N1-hydroxy-N1,N2-diphenylbenzamidine (HDPBA) and multi-walled carbon nanotubes (MWCNTs) composite for the determination of trace concentrations of Cu(II) in environmental and food samples including waters, soft drinks, and food supplement (commercial multi-mineral/vitamin tablets) samples using square wave anodic stripping voltammetry (SWASV).
2 Experimental
2.1 Apparatus and chemicals
Characterizations of surface morphologies of the developed electrodes were studied by scanning electron microscope (Cx-200 Coxem, Korea). The FTIR analyses were conducted using FTIR spectrometer (PerkinElmer, spectrum 100, USA) by a KBr pellet-making method. The recording of UV-Vis spectra was conducted using UV/Vis spectrometer (Lambda 950, PerkinElmer, USA). All the electrochemical measurements were done using an electrochemical analyzer (CHI 840C, USA) and it was connected with IBM (130100DX4) personal computer for data processing. A three-electrode system with a carbon paste working electrode (unmodified or modified), a saturated Ag/AgCl as a reference electrode, and Pt wire as an auxiliary electrode was used in all the electrochemical measurements. Stop clock, pH meter, and magnetic stirrer were used for time measurement, pH measurements, and stirring of the solutions, respectively. Atomic spectrometric measurements of Cu(II) were performed using the atomic absorption spectrometer (AAS) (Agilent 280Z AA Zeeman, GTA120).All chemicals used in this study were of analytical grade or higher purity. Unless otherwise described, distilled water was used for the preparation of solutions. Multi-walled carbon nanotube (MWCNT) was obtained from Sigma-Aldrich, USA (with purity > 90% and a size of about 100 nm). Graphite powder (BDH Laboratory Supplies Poole, England), and paraffin oil (Uvasol Merck, Germany) were applied as received for the preparation of carbon paste. A standard solution of Cu(II) (1000 mg L−1) was used for preparation of different concentrations of Cu(II) throughout the study. Ammonium chloride was used for supporting electrolyte/buffer solution preparation. The pH of ammonium chloride buffer solution was adjusted to appropriate values using hydrochloric acid and ammonia. Other chemicals such as sodium hydroxide, sodium acetate, acetic acid, potassium nitrate, sodium citrate, citric acid, boric acid, sodium hydroxide, phosphoric acid, sodium perchlorate and potassium phosphate salts were used for the preparations of various buffer solutions during the selection of suitable supporting electrolyte solution. Reagent-grade nitrate, chloride, and sulfate salts of other ions were applied in the interference study. Nitric acid and sulfuric acid were used for the real sample digestion and functionalization of MWCNTs. HDPBA was synthesized by the condensation of N-phenylhydroxyl amine with N-phenylbenzimidoylchloride in ether at 0 °C.35 The synthesized ligand (HDPBA) is a yellow crystalline powder with a melting point of 170 °C which was identical with previous reported melting point of 170 °C.35
2.2 Functionalization of multi-walled carbon nanotubes (MWCNTs)
Functionalization of the carbon nanotubes is commonly used to avoid graphitic nanoparticles, impurities, amorphous carbon, and to enhance the charge transfer characteristics.36 The MWCNTs used in the study were initially subjected to pretreatment using a mixture of H2SO4/HNO3 (3![[thin space (1/6-em)]](https://www.rsc.org/images/entities/char_2009.gif) :
:![[thin space (1/6-em)]](https://www.rsc.org/images/entities/char_2009.gif) 1 (v/v)) at room temperature for 12 h. The filtration of the suspension and washing of the solid with distilled water (until the pH become 6.8) were then performed. Finally, the washed solid was dried for 5 h at 120 °C.37
1 (v/v)) at room temperature for 12 h. The filtration of the suspension and washing of the solid with distilled water (until the pH become 6.8) were then performed. Finally, the washed solid was dried for 5 h at 120 °C.37
2.3 Preparation of electrodes
The carbon paste was made by hand mixing 1.00 g fine graphite powder with 0.36 mL paraffin oil in a mortar and pestle for 20 min. A portion of the mixture was then packed into the end of a plastic syringe (3 mm outer diameter and 5 cm length) with a Cu wire for electric contact. The surface of the packed electrode was polished on clean paper till a smooth surface of bare carbon paste electrode (CPE) was obtained. The modified carbon paste electrodes (MCPEs) were prepared in the same way, by replacing corresponding amounts of the graphite powder with HDPBA and MWCNTs in different ratios.22 Briefly, 10.0% (w/w) of MWCNTs and 90.0% (w/w) of carbon paste was used for MWCNTs/CPE; while 7.5% (w/w) of HDPBA and 92.5% (w/w) of carbon paste was used for HDPBA/CPE; and finally 7.5% (w/w) of HDPBA, 10.0% (w/w) of MWCNTs, and 82.5% (w/w) of carbon paste was used for HDPBA–MWCNTs/CPE. This finally modified electrode was used for the detailed study.Whenever regeneration of electrode is required, the renewal of the electrode was performed by removing a thin layer of the old surface and replacing it with a fresh paste. The fresh electrode was pretreated by using cyclic voltammetry (3–5 scans) in the supporting electrolyte solution (0.1 M NH4Cl) to get reproducible results. The fresh surface electrode gave signals with approximately the same degree of precision (less than 5%) as that found with the electrode with used surface. Under normal conditions, a single electrode surface can be used for multiple analytical determination over several weeks.
2.4 Analytical procedures
The voltammetric measurements were conducted by applying the following procedures: (i) preconcentration step: in this procedure, first, a known concentration of Cu(II) solution was added into 20 mL cell containing NH4Cl buffer solution (0.1 M, pH 5). The prepared electrode was then inserted into the cell and Cu(II) was preconcentrated on the electrode surface at an applied negative potential (−0.70 V) versus Ag/AgCl for a predetermined period of time with stirring the solution. After this step, stirring was ceased and a rest time of 10 s was permitted to settle the solution and decrease the background current. (ii) Stripping step: the voltammograms were recorded in the potential range of −0.50 to 0.40 V (positive scan) versus Ag/AgCl after preconcentration of Cu(II) as described in step (i). At the end of each measurement, the electrode was pretreated and renewed by performing 3–5 scans/runs of the voltammetry in 0.1 M NH4Cl buffer solution (pH 5). To eliminate the potential build-up of Cu(II) in the voltammetric cell, a fresh NH4Cl solution was used in each set of experiments.2.5 Real samples analysis
To evaluate the practical applicability of the developed modified electrode for real samples analysis, environmental water samples (industrial wastewater and tap water) from different sources, soft drinks (Fanta and Sprite) from local shops, and food supplements (commercially available multi-mineral/vitamin tablets, Rezumin, Lewis Pharmaceuticals Private Limited, India) from local pharmacy were collected, prepared and analyzed using the proposed method. Furthermore, to verify the validation and accuracy of the developed method, atomic absorption spectrometry (AAS) analysis was applied for water and soft drink samples. For water samples analysis, the collected water samples were first filtered through a Whatman No. 42 filter paper to remove solid particles. Then after, the pH of the water samples was adjusted to 5.0, and the quantification of Cu(II) in the given samples was conducted using the standard addition method.The digestion of the purchased soft drink samples was performed using the wet digestion method based on Godwill et al.38 Briefly, a 30 mL soft drink of each sample (separately) was taken, and evaporation of the gases inside the soft drink was performed first. Then after, 10 mL of 69% HNO3 was added to 10 mL of each soft drink sample, and the evaporation of the mixture on a hot plate was done till the disappearance of brown fumes, left white fumes. The volume was filled up to 25 mL by the addition of distilled water which was then filtered. Finally, after pH adjustment to 5, SWASV analysis was performed.
For food supplements (multi-mineral/vitamin tablets) analysis, after removing the outer coatings of the tablets, three tablet samples (copper is labeled as 800 μg (0.8 mg) per tablet) were dried in oven at 120 °C for 1 hour. To make a fine powder, the tablet samples were then ground in a mortar and pestle. An adequate amount the dried powdered tablet samples (corresponding to a stock solution of concentration 1 mM) were accurately weighted and taken in a 100 mL flask with concentrated HNO3 (5 mL) and stand it overnight before digestion. A 5 mL mixture of HCl and HNO3 (3![[thin space (1/6-em)]](https://www.rsc.org/images/entities/char_2009.gif) :
:![[thin space (1/6-em)]](https://www.rsc.org/images/entities/char_2009.gif) 1) was added to it and placed on a hot plate for 2 h. The mixture solution was heated till clear solution was appeared. After cooling the solution, it was then filtered with Whatman No. 42 filter paper and diluted up to 100 mL with distilled water. Different concentrations of standard (such as 0.1, 0.3, 0.7 and 1 μM) were made from the tablet stock solution using NH4Cl (0.1 M, pH 5). The metal ion content in samples was determined by standard addition method.8
1) was added to it and placed on a hot plate for 2 h. The mixture solution was heated till clear solution was appeared. After cooling the solution, it was then filtered with Whatman No. 42 filter paper and diluted up to 100 mL with distilled water. Different concentrations of standard (such as 0.1, 0.3, 0.7 and 1 μM) were made from the tablet stock solution using NH4Cl (0.1 M, pH 5). The metal ion content in samples was determined by standard addition method.8
3 Results and discussion
3.1 Characterizations of prepared modifiers and electrodes
The FTIR spectra of the prepared modifiers (HDPBA, MWCNTs and HDPBA–MWCNTs composite) were recorded using a PerkinElmer FTIR spectrometer with a spectral resolution of 1 cm−1 in the spectral range of 400–4500 cm−1 and the results are depicted in Fig. 1a and b. The FTIR peaks of as-prepared MWCNTs and functionalized MWCNTs are shown in Fig. 1a. Fig. 1a (spectra i, black color) depicts the FTIR peaks of as-prepared MWCNTs. The bands at 1600 and 1735 cm−1 can be attributed to C![[double bond, length as m-dash]](https://www.rsc.org/images/entities/char_e001.gif) C bonds in different environments of aromatic rings. The peak observed around a wave number of 3430 cm−1 is attributed to the O–H stretch of the hydroxyl group on the surfaces of MWCNTs could be due to water vapor which may be adsorbed by MWCNTs surface.39 Fig. 1a (spectra ii, red color) depicts the spectra of MWCNTs treated with sulfuric and nitric acid (3
C bonds in different environments of aromatic rings. The peak observed around a wave number of 3430 cm−1 is attributed to the O–H stretch of the hydroxyl group on the surfaces of MWCNTs could be due to water vapor which may be adsorbed by MWCNTs surface.39 Fig. 1a (spectra ii, red color) depicts the spectra of MWCNTs treated with sulfuric and nitric acid (3![[thin space (1/6-em)]](https://www.rsc.org/images/entities/char_2009.gif) :
:![[thin space (1/6-em)]](https://www.rsc.org/images/entities/char_2009.gif) 1 (v/v)) at 120 °C for 12 h. After the functionalization of MWCNTs, the intense band at about 3430 cm−1 is associated with the –OH bonds. The formation of an additional band (near 2900 cm−1) is ascribed to the formation of various carboxyl group (COOH) moieties at the carbon surface due to oxidation with acids. The C
1 (v/v)) at 120 °C for 12 h. After the functionalization of MWCNTs, the intense band at about 3430 cm−1 is associated with the –OH bonds. The formation of an additional band (near 2900 cm−1) is ascribed to the formation of various carboxyl group (COOH) moieties at the carbon surface due to oxidation with acids. The C![[double bond, length as m-dash]](https://www.rsc.org/images/entities/char_e001.gif) O characteristic peak is shown at 1740 cm−1. The spectra between 1380–1000 cm−1 confirm the presence of C–O bonds in different chemical surroundings. The results are well accorded with other reported literature.40,41
O characteristic peak is shown at 1740 cm−1. The spectra between 1380–1000 cm−1 confirm the presence of C–O bonds in different chemical surroundings. The results are well accorded with other reported literature.40,41
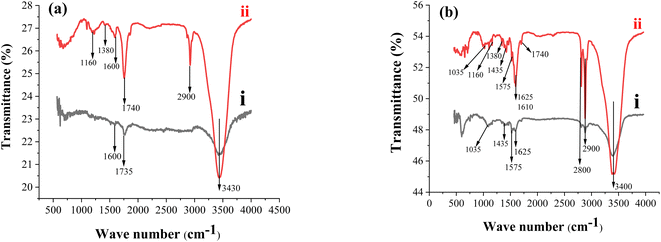 | ||
| Fig. 1 FTIR spectra of (a) as-prepared MWCNTs (i) and functionalized MWCNTs (ii); (b) HDPBA (i) and HDPBA–MWCNTs composite (ii). | ||
Fig. 1b (spectra i, black color) depicts the FTIR spectra for HDPBA. It exhibited major spectra at about 2900, 3400, 1575, 1625, 1035, and 1435 cm−1 which are assigned to the bonds of C–H (aromatic, stretching), O–H, C![[double bond, length as m-dash]](https://www.rsc.org/images/entities/char_e001.gif) N, C–N, N–O, and C
N, C–N, N–O, and C![[double bond, length as m-dash]](https://www.rsc.org/images/entities/char_e001.gif) C(aromatic) in the HDPBA structure, respectively. The results are similar to other previously reported values.42,43 Fig. 1b (spectra ii, red color) shows the FTIR spectra of HDPBA and MWCNTs composite (HDPBA–MWCNTs) structure. As shown in the figure, all the spectra found in the MWCNTs and HDPBA structures are observed in the HDPBA–MWCNTs composite spectra. The peaks around 3400, 2900, 1740, 1610, 1380, and 1160 cm−1 represent various bonds of functional groups in MWCNTs as described above, which confirm the presence of MWCNTs in HDPBA–MWCNTs composite structure. While the major spectra observed at 2800/2900, 3400, 1575, 1625, 1035, and 1435 cm−1 are ascribed to the structure of HDPBA in HDPBA–MWCNTs composite structure.
C(aromatic) in the HDPBA structure, respectively. The results are similar to other previously reported values.42,43 Fig. 1b (spectra ii, red color) shows the FTIR spectra of HDPBA and MWCNTs composite (HDPBA–MWCNTs) structure. As shown in the figure, all the spectra found in the MWCNTs and HDPBA structures are observed in the HDPBA–MWCNTs composite spectra. The peaks around 3400, 2900, 1740, 1610, 1380, and 1160 cm−1 represent various bonds of functional groups in MWCNTs as described above, which confirm the presence of MWCNTs in HDPBA–MWCNTs composite structure. While the major spectra observed at 2800/2900, 3400, 1575, 1625, 1035, and 1435 cm−1 are ascribed to the structure of HDPBA in HDPBA–MWCNTs composite structure.
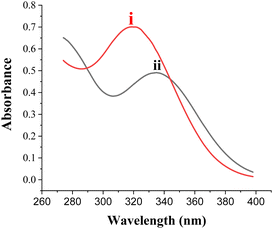
![[double bond, length as m-dash]](https://www.rsc.org/images/entities/char_e001.gif) N group in HDPBA. This is in good agreement with the value reported in the literature.42,43 But, after the addition of Cu(II) to the ligand solution, the absorption band shifted to the longer wavelength (λmax (ethanol) = 338 nm) (Fig. 2, curve ii). Thus, spectral shift with the addition of Cu(II) to the ligand (HDPBA) confirm the complex formation of Cu(II) with the ligand (HDPBA).
N group in HDPBA. This is in good agreement with the value reported in the literature.42,43 But, after the addition of Cu(II) to the ligand solution, the absorption band shifted to the longer wavelength (λmax (ethanol) = 338 nm) (Fig. 2, curve ii). Thus, spectral shift with the addition of Cu(II) to the ligand (HDPBA) confirm the complex formation of Cu(II) with the ligand (HDPBA).
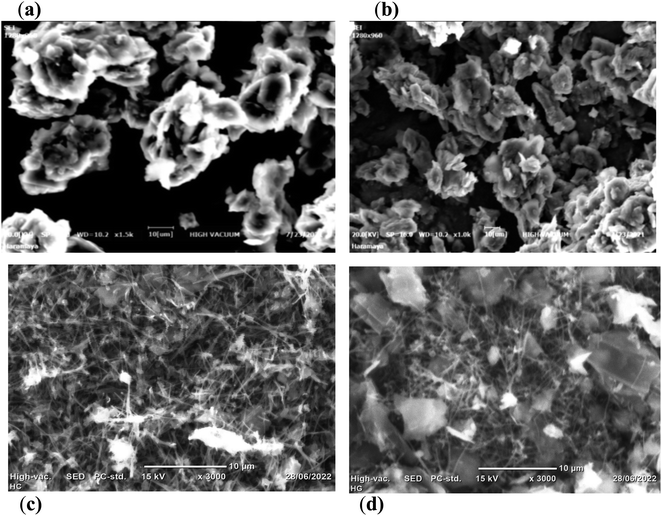 | ||
| Fig. 3 SEM images of (a) bare CPE,27,28,34 (b) HDPBA/CPE,27,28,34 (c) MWCNTs/CPE and (d) HDPBA–MWCNTs/CPE. | ||
Fig. 3c shows a SEM image for the surface morphology of MWCNTs/CPE. As shown in the figure, the MWCNTs are uniformly dispersed in the carbon paste electrode, and the MWCNTs tubes can be seen clearly in the image. The carbon nanotubes in the SEM image are tightly compact with high density in a homogeneous form. Moreover, MWCNTs with three-dimensional structures/interstices in a regular distribution among the carbon tubes are found in the SEM image of the MWCNTs/CPE, indicating a large surface area.
Fig. 3d depicts the SEM image for HDPBA–MWCNTs/CPE. Agglomerated and uneven distributed surfaces/pores are shown in the HDPBA–MWCNTs nanocomposite structure. Such a rough surface is suitable for the accumulation of Cu(II) on the electrode surface, which is significantly important for the sensing of metal ions. The MWCNTs tubes are also obviously shown in the composite structure. Both the morphologies of HDPBA/CPE (b) and MWCNTs/CPE (c) are observed in the HDPBA–MWCNTs nanocomposite structure (d). The results indicate that significant differences are found between the surface morphologies of bare CPE and HDPBA–MWCNTs modified CPEs, indicating a successful immobilization of the modifiers (HDPBA and MWCNTs) on the CPE surface.
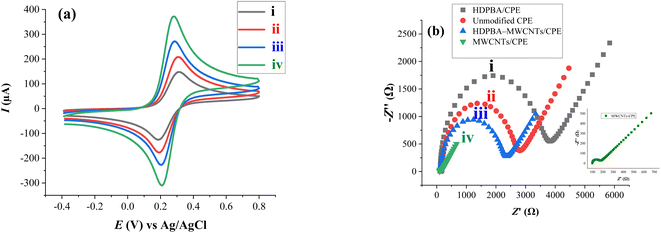 | ||
| Fig. 4 Cyclic voltammograms (a) and EIS plots (b) of ferricyanide (K3[Fe(CN)6]) at HDPBA/CPE (i), unmodified CPE (ii), HDPBA–MWCNTs/CPE (iii), and MWCNTs/CPE (iv). | ||
Moreover, EIS characterization of the prepared electrodes was done to verify the results found in CV. EIS is a basic tool for determining the electrochemical properties of electrodes' surface/interface and it can provide specific information of impedance changes in the electrodes modification process. The semicircle diameter in Nyquist/impedance plots corresponds to the charge transfer resistance (Rct). Hence, Rct can be employed to explain the interface properties of the electrodes. Rct values depend on the behavior of the materials incorporated in the surface of the electrodes.33
EIS plots were recorded in K3[Fe(CN)6] solution with KCl (0.1 M) supporting electrolyte in the frequency region from 0.1 Hz to 100![[thin space (1/6-em)]](https://www.rsc.org/images/entities/char_2009.gif) 000 Hz at a potential of 0 V versus Ag/AgCl with an amplitude of 0.005 V. Fig. 4b shows the impedance Nyquist plots of different prepared electrodes. The Rctvalue was found to be 2469 Ω for unmodified CPE (curve ii). After modification of the CPE with MWCNTs (MWCNTs/CPE), the semicircle becomes a straight line compared with unmodified CPE, and the Rct value decreased to 625 Ω (curve iv). The lower interfacial charge transfer resistance (Rct) value observed for MWCNTs/CPE could be attributed to the good conductivity and electrochemical properties of the nanomaterials, MWCNTs. However, the Rct value increased to 1835 Ω in further modification of MWCNTs/CPE with HDPBA (HDPBA–MWCNTs/CPE) (curve iii). As compared to other electrodes, HDPBA modified CPE (HDPBA/CPE) has highest EIS semicircle diameter with Rct value of 3403 Ω (curve i). This can be explained by the fact described above the lone pair electrons of –N and –OH groups in HDPBA repel the [Fe(CN)6]3− anion in the ferricyanide solution, evidently HDPBA behaves as a blocking layer for charge transfer to obstacle the movement of ferricyanide for the surface of the HDPBA/CPE.44–46 The results found from EIS plots are in accordance with the results obtained from CV characterization as given above. This proves the effective immobilization of HDPBA and MWCNTs on the CPE surface.
000 Hz at a potential of 0 V versus Ag/AgCl with an amplitude of 0.005 V. Fig. 4b shows the impedance Nyquist plots of different prepared electrodes. The Rctvalue was found to be 2469 Ω for unmodified CPE (curve ii). After modification of the CPE with MWCNTs (MWCNTs/CPE), the semicircle becomes a straight line compared with unmodified CPE, and the Rct value decreased to 625 Ω (curve iv). The lower interfacial charge transfer resistance (Rct) value observed for MWCNTs/CPE could be attributed to the good conductivity and electrochemical properties of the nanomaterials, MWCNTs. However, the Rct value increased to 1835 Ω in further modification of MWCNTs/CPE with HDPBA (HDPBA–MWCNTs/CPE) (curve iii). As compared to other electrodes, HDPBA modified CPE (HDPBA/CPE) has highest EIS semicircle diameter with Rct value of 3403 Ω (curve i). This can be explained by the fact described above the lone pair electrons of –N and –OH groups in HDPBA repel the [Fe(CN)6]3− anion in the ferricyanide solution, evidently HDPBA behaves as a blocking layer for charge transfer to obstacle the movement of ferricyanide for the surface of the HDPBA/CPE.44–46 The results found from EIS plots are in accordance with the results obtained from CV characterization as given above. This proves the effective immobilization of HDPBA and MWCNTs on the CPE surface.
3.2 Electrochemical determination of Cu(II) with prepared electrodes
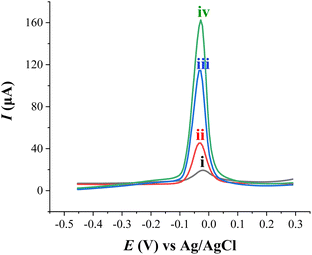
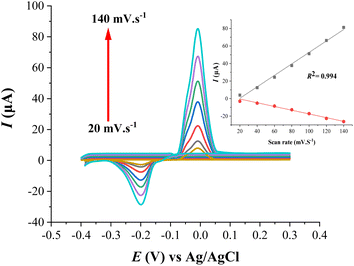
The electrode prepared with HDPBA (HDPBA/CPE) showed a larger and highly intense anodic peak current (peak iii) as compared with MWCNTs/CPE (peak ii) and unmodified electrode (peak i). This indicates the complex formation between ligand, HDPBA and Cu(II). The interaction of HDPBA molecules with the copper ions is based on an interfacial process that depends on the nature of the electrode surface functionalities. Based on the acids and bases theory defined by Pearson, metal ions will have a tendency to form complexes with ligands that have electronegative donor atoms.47 Since HDPBA is a ligand and can behave as a Lewis base (Fig. S1†), it can form a coordination bond with the Lewis acid, Cu(II) using the lone pairs electrons on the nitrogen and oxygen atoms showing relatively low π-acidity. This metal–ligand complex results in the preconcentration of a large concentration of Cu(II) on the surface of the modified electrode and consequently gives high current responses during the stripping step as compared to the unmodified electrode and MWCNTs/CPE. Therefore, HDPBA was successfully used as a complexing agent for the sensitive and selective electrochemical sensing of Cu(II) at the carbon paste electrode (CPE) modified with MWCNTs (HDPBA–MWCNTs/CPE). Such important characteristics of the modifier have a significant role to obtain very low detection limits in the voltammetric determinations of Cu(II) with modified CPE as a working electrode.
The anodic peak of Cu(II) at HDPBA–MWCNTs/CPE (peak iv) is higher than that of all other electrodes (peaks i, ii, and iii). This is explained by the fact described above that the HDPBA and MWCNTs had a synergetic effect on the preconcentration and detection of Cu(II). Because of HDPBA was applied as an excellent complexing agent for Cu(II) and MWCNTs in carbon electrodes could facilitate the charge transfer rate among electrode surface and the analyte which result in better electrochemical sensing performance of HDPBA–MWCNTs/CPE compared to the remaining electrodes (peaks i, ii, and iii). Thus, the use of MWCNTs and HDPBA as effective modifiers is very important to significantly improve the voltammetric signal of the carbon paste electrode for Cu(II) detection.
Accumulation step:
| (Cu2+) solution + MCPE → (Cu2+–MCPE) adsorbed complex |
| (Cu2+–MCPE) adsorbed complex + 2e− → (Cu–MCPE) adsorbed complex |
Stripping step:
| (Cu–MCPE) adsorbed complex − 2e− → (Cu2+) solution/surface + MCPE |
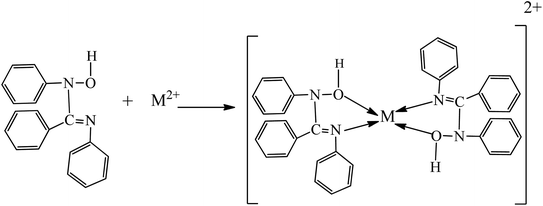
The proposed complexation mechanism between the synthesized ligand, N1-hydroxy-N1,N2-diphenylbenzamidine (HDPBA) and metal ion (M2+ = Cu2+) is also presented in Fig. 6.
3.3 Optimization of the experimental conditions
Similarly, at the constant composition of HDPBA (7.5%), the peak current intensity of Cu(II) was increased by increasing the contents of MWCNTs from 2.5% to 10.0%. This is due to the good conductivity and large surface area of the nanomaterials (MWCNTs). But after 10.0% of MWCNTs, the current response of Cu(II) was slightly diminished. This might be because of an agglomeration effect of nanomaterials and an increase in the background current. Therefore, 7.5% (w/w) of HDPBA, 10.0% (w/w) of MWCNTs and 82.5% (w/w) of carbon paste for HDPBA–MWCNTs/CPE were chosen as optimum electrode compositions and used for all subsequent measurements.
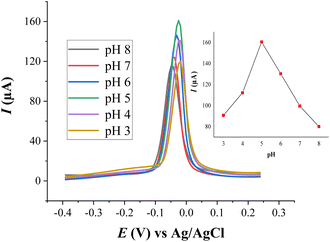
The effect of the solution pH on the current response of Cu(II) was determined by changing the pH values of NH4Cl buffer solution from 3 to 8 and the results are depicted in Fig. 7. The highest peak was recorded at pH 5.0. Below and above pH 5.0, the voltammetric peak currents of Cu(II) were diminished. The decrease of the voltammetric peak current at higher pHs (pHs > 5) can be ascribed to the hydrolysis of metal ion in the test solution; this leads the decrease in the preconcentrated metal ion on the surface of the modified electrode. The decrease in the current responses of Cu(II) at lower pHs (pHs < 5.0) can be attributed to the competition between the proton ion and Cu(II) for binding with the donating atoms of the modifier (HDPBA) at the surface of electrode because of the increase in the number of protons in acidic media. Moreover, at lower pH values, the modifier can gradually dissolve in the supporting electrolyte solution and loses its capability for immobilizing Cu(II). Therefore, pH 5.0 (NH4Cl, 0.1 M) was chosen as the optimum pH for further experiments.
In order to study the influence of accumulation time on the voltammetric currents of Cu(II), the accumulation time varied between 30 and 240 s. As shown in Fig. S3,† the current responses increased rapidly at first (up to 180 s), and then a gradual increment at more accumulation times (after 180 s). The gradual increase of the stripping peak current responses after 180 s can be explained by the saturation of the electrode surface with preconcentrated Cu(II) and/or the accomplishment of steady-state equilibrium of complex formation. Therefore, an accumulation time of 180 s was selected as the optimum time and used throughout the experiments of the present study.
Other optimum SWASV modulation parameters including pulse amplitude, frequency, and step potential were investigated for obtaining a maximum signal-to-noise ratio. Based on the shape and symmetry of peaks, the most appropriate values for amplitude, frequency, and step potential were found to be 100 mV, 60 Hz, and 6 mV, respectively.
3.4 Analytical performance of HDPBA–MWCNTs/CPE
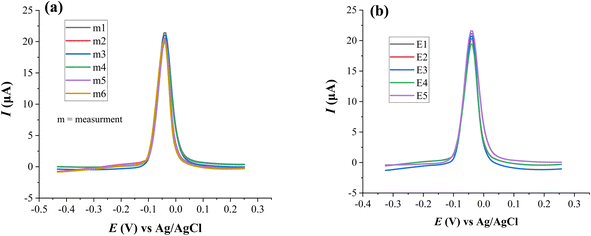
| Repeated measurements | Current response, Ip (μA) | Mean of Ip | Standard deviation | Relative standard deviation (RSD) |
|---|---|---|---|---|
| m1 | 21.4 | |||
| m2 | 20.58 | |||
| m3 | 21.06 | |||
| m4 | 19.86 | |||
| m5 | 20.44 | |||
| m6 | 20.39 | 20.62 | 0.54 | 2.62 |
| Electrodes | Current response, Ip (μA) | Mean of Ip | Standard deviation | Relative standard deviations (RSD) |
|---|---|---|---|---|
| E1 | 21.12 | |||
| E2 | 20.67 | |||
| E3 | 20.82 | |||
| E4 | 19.42 | |||
| E5 | 21.43 | 20.69 | 0.79 | 3.74 |
3.5 Selectivity study
The effect of potentially interfering ions on the detection of Cu(II) was examined at optimal voltammetric conditions. Several possible interfering metal ions and anions such as K+, Na+, Fe2+, Zn2+, Hg2+, Pb2+, Cd2+, Mg2+, Ca2+, Ni2+, Co2+, Cl−, NO3− and SO42− were tested to investigate the selectivity of the HDPBA–MWCNTs/CPE to Cu(II) detection in the present work. The study was performed by adding different concentrations of interfering ions in a known concentration of Cu(II) solution (0.1 μM) during the accumulation step. The results are given in Table 3. The maximum concentration of the interfering ions that caused a relative error of ±5% on the determination of 0.1 μM Cu(II) was taken as the tolerance limit.| Interfering ion | Interference level/concentration |
|---|---|
| K+,Na+, Zn2+, Mg2+, Ca2+, NO3− and Cl− | >200 (fold) |
| Co2+,Ni2+, Fe2+ and SO42- | >100 (fold) |
| Hg2+ and Cd2+ | >50 (fold) |
| Pb2+ | >30 (fold) |
As presented in the table, it was found that the addition of different concentrations of the tested ions (in four different groups, from 30-fold up to 200-fold molar excess) into Cu(II) solution (0.1 μM) had no substantial effect on the peak current of Cu(II). The results prove that the HDPBA–MWCNTs/CPE has higher selectivity for Cu(II) compared to other metal ions. This can be suggested that since Cu(II) has a small size compared to most of the mentioned divalent heavy metal ions, there could be fast adsorption interaction to Cu(II) through the coordination effect with –OH and –N groups of HDPBA (Fig. S1†) and carboxyl group (COOH) of functionalized MWCNTS as compared with other interfering ions. This indicates the proposed electrode is highly selective and can be employed for the quantification of Cu(II) from a complex matrix in the presence of other ions without any separation.
3.6 Comparison of the performance of HDPBA–MWCNTs/CPE with other reported electrodes
Table 4 shows the analytical performance/characteristics of the developed HDPBA–MWCNTs/CPE and other several electrodes reported in the literature for the determination of Cu(II). As given in the table, the present electrode has a wider and comparable linear range as compared to other reported electrodes. The LOD for the HDPBA–MWCNTs/CPE is much lower compared to the reported electrodes except for one electrode.59 But this electrode has a relatively higher accumulation time (10 min) than the proposed electrode (3 min). A shorter accumulation time used in the present method enables quick analysis. The results proved that the proposed electrode has excellent analytical performance as compared to almost all the reported electrodes and it has great applicability for the determination of very low concentrations of Cu(II).| Electrodea | Technique | Accumulation time (s) | Liner range (nM) | LOD (nM) | Ref. |
|---|---|---|---|---|---|
| a TC4/AuNPs/SPCE: thiolated calix[4]arene derivative modified on gold nanoparticles and screen-printed carbon electrode; L-cysteine/AuE: L-cysteine modified gold electrode; G-MWCNT/ITO: graphenated multi-walled carbon nanotubes modified indium tin oxide electrode; L-cys/AuNPs/CdS: L-cysteine functionalized gold nanoparticles/cadmium sulfide nanopheres; Cr: chromium(III) oxide; NALc/AuE: gold electrodes modified with N-acetyl-L-cysteine; ligand L: 2,2′–((pyridine-2,6-diylbis(azanylylidene))bis(methanylylidene))-bis(4-bromo phenol); BBKS: Bigarreau Burlatkernel shells; GQD–AuNPs: graphene quantum dots functionalized gold nanoparticles; Gly–Gly–His/MPA/AuE: covalent attachment of the tri-peptide glycyl–glycyl–histidine to self assembled monolayer of 3–4 mercaptopropionic acid formed on the gold electrode; Fe3O4@Au@L-cysteine: Fe3O4 and gold magnetic nanoparticles–L-cysteine. | |||||
| TC4/AuNPs/SPCE | DPV | 120 | 3148.0–15740 | 210.25 | 51 |
| L-Cysteine/AuE | SWV | 300 | 0.787–78.7 | 0.39 | 52 |
| G-MWCNT/ITO | SWASV | 150 | 50.00–2500 | 12.00 | 53 |
| L-cys/AuNPs/CdS/GCE | SWASV | 210 | 0.500–200 | 0.10 | 54 |
| Cr–CPE | SWASV | 100 | 157.40–12592 | 47.22 | 55 |
| NALc/AuE | ASV | 420 | 0.10–100 | 0.10 | 56 |
| Ligand L/CPE | DPV | — | 15.74–1574 | 0.55 | 48 |
| BBKS–CPE | SWV | 130 | 157.4–1259 | 153.78 | 57 |
| GQD–AuNPs/GCE | SWASV | — | — | 0.05 | 58 |
| Gly–Gly–His/MP/AuE | SWV | 600 | 0.00128–0.0253 | 0.0002 | 59 |
| Fe3O4@Au@L-cysteine/CPE | DPV | 120 | 2.0–400.0 | 0.40 | 60 |
| HDPBA–MWCNTs/CPE | SWASV | 180 | 0.07–1500 | 0.0048 | Present work |
3.7 Novelty of the study
For the first time, a highly sensitive and selective electrochemical sensor for the determination of copper(II) at trace levels has been developed using a carbon paste electrode modified with N1-hydroxy-N1,N2-diphenylbenzamidine (HDPBA) and multi-walled carbon nanotubes (MWCNTs) composite (HDPBA–MWCNTs/CPE). The preparation of the electrode is very simple (with easy renewable surface), cost-effective and not time-consuming. The developed electrode, HDPBA–MWCNTs/CPE exhibited excellent sensitivity, selectivity, stability, and reproducibility for the electrochemical sensing of target analyte, Cu(II). In contrast with most of the electrodes reported in the literature, the proposed electrode has achieved a better sensing performance with a very lower detection limit, wider linear range and short analysis time. The fabricated HDPBA–MWCNTs/CPE was effectively applied in the determination of concentrations of copper(II) in several types of environmental and food samples including water, soft drinks, and food supplement samples from different sources. It was found that the proposed method has good applicability for real sample analysis of different matrixes.3.8 Analytical application
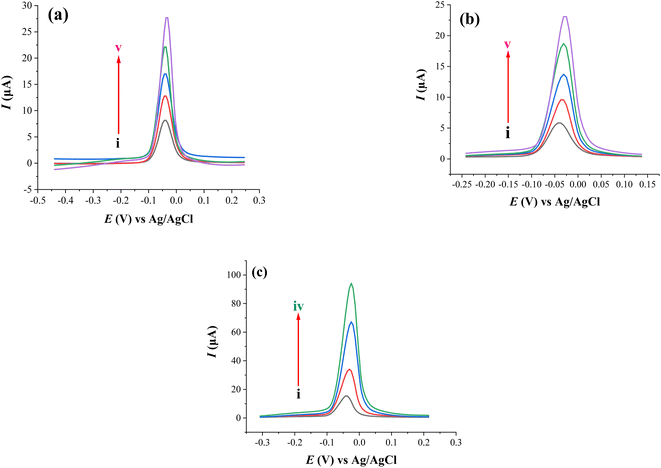
The practical applicability of HDPBA–MWCNTs/CPE was evaluated by utilizing it to determine Cu(II) in various real samples such as water samples (industrial wastewater and tap water), soft drinks (Fanta and Sprite), and food supplement (multi-mineral/vitamin tablets, Rezumin, India). The contents and recoveries of Cu(II) in the test samples were done using the standard addition method under optimal conditions. Furthermore, to verify the accuracy and validation of the developed method, the results obtained from the present method were validated with the results found from atomic absorption spectrometry (AAS). As can be seen in Table 5, the original concentrations of Cu(II) in wastewater and tap water samples were found to be 0.0814 μM and 0.0678 μM, respectively. While Cu(II) was not detected in soft drink samples (Fanta and Sprite) within the given detection range. The detected concentration of Cu(II) in multi-mineral/vitamin tablets (Rezumin) with the present method was found to be 784.80 μg per tablet, while its labeled concentration was 800.00 μg per tablet. The recovery values for the concentration of Cu(II) in the tasted samples were found to be 94.60% to 103.6%. The representative SWASVs for the analyzed wastewater, tap water, and multi-mineral/vitamin tablet samples are shown in Fig. 11.| Sample | Added (μM) | Found (μM) (proposed method) | Recovery (%) (proposed method) | Found (μM) (AAS method) | Recovery (%) (AAS method) |
|---|---|---|---|---|---|
| a ND: not detected. | |||||
| Wastewater | 0 | 0.0814 (±0.0021) | — | 0.0797 (±0.0011) | — |
| 0.05 | 0.1306 (±0.0032) | 98.40 | 0.1286 (±0.0043) | 97.80 | |
| Tap water | 0 | 0.0678 (±0.0017) | — | 0.0692 (±0.0021) | — |
| 0.05 | 0.1196 (±0.0024) | 103.6 | 0.1206 (±0.0030) | 102.8 | |
| Fanta | 0 | ND | — | ND | — |
| 0.05 | 0.0517 (±0.0031) | 103.4 | 0.0520 (±0.0022) | 104.0 | |
| Sprite | 0 | ND | — | ND | — |
| 0.05 | 0.0473 (±0.0010) | 94.60 | 0.0481 (±0.0013) | 96.20 | |
| Food supplement sample | Expected/μM | Measured/detected | Labeled (μg per tablet) | Recovery (%) | |
|---|---|---|---|---|---|
| (μM) | (μM per tablet) | ||||
| Multi-mineral/vitamin tablets (Rezumin) | 0.1 | 0.0981 (±0.02) | 784.80 | 800.00 | 98.10 |
The agreement between the results obtained from proposed method and AAS method was verified using paired t-test at a 95% confidence level (p = 0.05). The t-test confirms the results obtained from proposed method have no significant differences from those found from AAS. This indicates the reliability and accuracy of the proposed method. Therefore, it can conclude that the developed method has good applicability for the determination of trace levels of Cu(II) in real samples without significant matrix effects.
4 Conclusions
In this study, a novel chemically modified CPE has been developed using a laboratory-synthesized ligand, HDPBA, and MWCNTs composite for the determination of Cu(II) at picomolar levels using the SWASV technique. The electrochemical and surface properties of the fabricated electrode were effectively characterized using different spectroscopic techniques. The good metal-chelation/complex formation property of the ligand significantly improved the sensing performance of the modified electrode for selective and sensitive interaction with Cu(II). Moreover, the excellent conductivity and large surface area of MWCNTs further increased the sensitivity of the HDPBA–MWCNTs/CPE for the detection of Cu(II) at very lower concentrations. Under optimal conditions of the experiment, the developed HDPBA–MWCNTs/CPE has achieved a very low LOD, a wide linear range, and excellent selectivity and sensitivity. In addition, high stability and reproducibility, short analysis time, simple and low-cost electrode preparation with easy renewable surface are among the novel properties of the developed electrode. The proposed electrode was effectively used to determine Cu(II) in wastewater, tap water, Fanta, Sprite, and multi-minerals tablet samples without substantial matrix effects. Validation of the results was done by a comparative method using AAS at a 95% of confidence level. The results found from the proposed method have good agreement with those of AAS. In comparison with the atomic spectroscopic techniques, the proposed method has many advantages in terms of portability, instrumental cost, short analysis time, sensitivity, and selectivity. This indicates the HDPBA–MWCNTs/CPE can be used as a promising sensor not only for the quantification of Cu(II) but also for other metal ions at trace concentrations in various types of environmental, food samples and even other matrixes in the future due to the interesting analytical characteristics of the electrode.Data availability
All the data are included in the manuscript.Author contributions
Endale Tesfaye: data curation, validation, methodology, writing original draft, writing review and editing. Bhagwan Singh Chandravanshi: methodology, conceptualization, writing review and editing. Negussie Negash: methodology, writing review and editing. Merid Tessema: methodology, conceptualization, writing review and editing.Conflicts of interest
There are no conflicts to declare.Acknowledgements
There is no funding from any organization for this research work. The authors would like to express their appreciation to the Chemistry Department of Addis Ababa University for providing laboratory facilities. Endale Tesfaye is grateful to Gambella University, Ethiopia, for sponsoring his study.References
- H. Ali, E. Khan and I. Ilahi, Environmental chemistry and ecotoxicology of hazardous heavy metals: environmental persistence, toxicity, and bioaccumulation: review article, J. Chem., 2019, 6730305, DOI:10.1155/2019/6730305.
- P. C. Nagajyoti, K. D. Lee and T. V. M. Sreekanth, Heavy metals, occurrence and toxicity for plants: a review, Environ. Chem. Lett., 2010, 8, 199–216, DOI:10.1007/s10311-010-0297-8.
- V. I. Slaveykova and G. Cheloni, Preface: special issue on environmental toxicology of trace metals, Environments, 2018, 5(12), 138, DOI:10.3390/environments5120138.
- M. Wieczorek-Dabrowska, A. Tomza-Marciniak, B. Pilarczyk and A. Balicka-Ramisz, Roe and red deer as bioindicators of heavy metals contamination in north-western Poland, Chem. Ecol., 2013, 29(2), 100–110, DOI:10.1080/02757540.2012.711322.
- Z. Chen, L. Li, X. Mu, H. Zhao and L. Guo, Electrochemical aptasensor for detection of copper based on a reagentless signal-on architecture and amplification by gold nanoparticles, Talanta, 2011, 85, 730–735, DOI:10.1016/j.talanta.2011.04.056.
- G. N. Abdel-Rahmana, M. B. M. Ahmeda, B. A. Sabrya and S. S. M. Alib, Heavy metals content in some non-alcoholic beverages (carbonated drinks, flavored yogurt drinks, and juice drinks) of the Egyptian markets, Toxicol. Rep., 2019, 6, 210–214, DOI:10.1016/j.toxrep.2019.02.010.
- M. M. Ghuniem, M. A. Khorshed and E. R. Souaya, Method validation for direct determination of some trace and toxic elements in soft drinks by inductively coupled plasma mass spectrometry, Int. J. Environ. Anal. Chem., 2019, 99, 6, DOI:10.1080/03067319.2019.1599878.
- K. Rohitraj, S. Sharma, S. Saxena, M. M. Srivastava and S. P. Satsangi, Estimation of heavy metals in multivitamin tablets by differential pulse anodic stripping voltammetry, E-J. Chem., 2010, 7(S1), S169–S174 CrossRef.
- Z. Ali, A. Zuhri and W. Voelter, Applications of adsorptive stripping voltammetry for the trace analysis of metals, pharmaceuticals and biomolecules, Fresenius. J. Anal. Chem., 1998, 360, 1–9 CrossRef.
- X. Xu, G. Duan, Y. Li, G. Liu, J. Wang, H. Zhang, Z. Dai and W. Cai, Fabrication of gold nanoparticles by laser ablation in liquid and their application for simultaneous electrochemical detection of Cd2+, Pb2+, Cu2+, and Hg2+, ACS Appl. Mater. Interfaces, 2014, 6, 65–71, DOI:10.1021/am404816e.
- P. Patil, M. Kigga, M. P. Bhat, M. G. Gatti, S. Kabiri, T. Altalhi, H.-Y. Jung, D. Losic and M. Kurkuri, Chemodosimeter functionalized diatomaceous earth particles for visual detection and removal of trace mercury ions from water, Chem. Eng. J., 2017, 327, 725–733, DOI:10.1016/j.cej.2017.06.138.
- R. A. Wuana and F. E. Okieimen, Heavy metals in contaminated soils: a review of sources, chemistry, risks and best available strategies for remediation, ISRN Ecol., 2011, 402647, DOI:10.5402/2011/402647.
- P. Patil, K. V. Ajeya, M. P. Bhat, G. Sriram, J. Yu, H.-Y. Jung, T. Altalhi, M. Kigga and M. D. Kurkuri, Real-time probe for the efficient sensing of inorganic fluoride and copper ions in aqueous media, ChemistrySelect, 2018, 3, 11593–11600, DOI:10.1002/slct.201802411.
- G. Sriram, M. P. Bhat, P. Patil, U. T. Uthappa, H.-Y. Jung, T. Altalhi, T. T. M. Aminabhavi, R. K. Pai, M. Kigga and M. D. Kurkuri, Paper-based microfluidic analytical devices for colorimetric detection of toxic ions: a review, Trends Anal. Chem., 2017, 93, 212–227, DOI:10.1016/j.trac.2017.06.005.
- M. P. Bhat, M. Kigga, H. Govindappa, P. Patil, H. Jung, J. Yu and M. Kurkuri, Reversible fluoride chemosensor for the development of multiinput molecular logic gates, New J. Chem., 2019, 43, 12734–12743, 10.1039/C9NJ03399H.
- H. Wan, Q. Sun, H. Li, F. Sun, N. Hu and P. Wang, Screen-printed gold electrode with gold nanoparticles modification for simultaneous electrochemical determination of lead and copper, Sens. Actuators, B, 2015, 209, 336–342, DOI:10.1016/J.SNB.2014.11.127.
- M. Bingöl, G. Yentür, B. Er and A. B. Öktem, Determination of some heavy metal levels in soft drinks from Turkey using ICP-OES method, Czech J. Food Sci., 2010, 28, 213–216, DOI:10.17221/158/2008-CJFS.
- H. Setiyanto, D. R. Purwaningsih, V. Saraswaty, N. Mufti and M. A. Zulfikar, Highly selective electrochemical sensing based on electropolymerized ion imprinted polyaniline (IIPANI) on a bismuth modified carbon paste electrode (CPE-Bi) for monitoring nickel(II) in river water, RSC Adv., 2022, 12, 29554–29561, 10.1039/d2ra05196f.
- C. Kokkinos and A. Economou, Tin film sensor with on-chip three-electrode configuration for voltammetric determination of trace Tl(I) in strong acidic media, Talanta, 2014, 125, 215–220, DOI:10.1016/j.talanta.2014.02.070.
- J. Zuo, Y. Shen, J. Gao, H. Song, Z. Ye, Y. Liang and S. Zhang, Highly sensitive determination of paracetamol, uric acid, dopamine, and catechol based on flexible plastic electrochemical sensors, Anal. Bioanal. Chem., 2022, 414, 5917–5928, DOI:10.1007/s00216-022-04157-6.
- K. Kalcher, I. Svancara, M. Buzuk, K. Vytras and A. Walcarius, Electrochemical sensors and biosensors based on heterogeneous carbon materials, Monatsh. Chem., 2009, 140, 861–889, DOI:10.1007/s00706-009-0131-9.
- A. Afkhami, H. Khoshsafar, H. Bagheri and T. Madrakian, Construction of a carbon ionic liquid paste electrode based on multi-walled carbon nanotubes-synthesized Schiff base composite for trace electrochemical detection of cadmium, Mater. Sci. Eng., C, 2014, 35, 8–14, DOI:10.1016/j.msec.2013.10.025.
- S. Tajik, H. Beitollahi, F. G. Nejad, M. Safaei, K. Zhang, Q. V. Le, R. S. Varma, H. W. Jang and M. Shokouhimehr, Developments and applications of nanomaterials based carbon paste electrodes, RSC Adv., 2020, 10, 21561, 10.1039/d0ra03672b.
- A. Poudel, G. S. S. Sunder, A. Rohanifar, S. Adhikari and J. R. Kirchhoff, Electrochemical determination of Pb2+ and Cd2+ with a poly(pyrrole-1-carboxylic acid) modified electrode, J. Electroanal. Chem., 2022, 911, 116221, DOI:10.1016/j.jelechem.2022.116221.
- A. G. Ali, M. F. Altahan, A. M. Beltagi, A. A. Hathoota and M. Abdel-Azzem, Voltammetric and impedimetric determinations of selenium(IV) by an innovative gold-free poly(1-aminoanthraquinone)/multiwall carbon nanotube modified carbon paste electrode, RSC Adv., 2022, 12, 29554, 10.1039/d2ra05196f.
- J. Hou, Y. Fan, X. Ma, X. Dong and S. Yao, Effects of modified fly ash doped carbon paste electrodes and metal film electrodes on the determination of trace cadmium(II) by anodic stripping voltammetry, RSC Adv., 2021, 11, 17240, 10.1039/d0ra07493d.
- E. Tesfaye, B. S. Chandravanshi, T. Hailu, N. Negash and M. Tessema, Square wave anodic stripping voltammetric determination of Hg(II) with N1-hydroxy-N1,N2-diphenylbenzamidine modified carbon paste electrode, Electroanalysis, 2022, 34, 892–903, DOI:10.1002/elan.202100468.
- E. Tesfaye, B. S. Chandravanshi, N. Negash and M. Tessema, A novel carbon paste electrode modified with N1-hydroxy-N1,N2-diphenylbenzamidine for the electrochemical determination of cadmium(II) in environmental samples, J. Anal. Methods Chem., 2022, 3426575, DOI:10.1155/2022/3426575.
- H. Khani, M. K. Rofouei, P. Arab, V. K. Gupta and Z. Vafaei, Multi-walled carbon nanotubes ionic liquid carbon paste electrode as a super selectivity sensor: application to potentiometric monitoring of mercury(II), J. Hazard. Mater., 2017, 183, 402–409, DOI:10.1016/j.jhazmat.2010.07.039.
- M. Payehghadr and S. E. Hashemi, Solvent effect on complexation reactions, J. Inclusion Phenom. Macrocyclic Chem., 2017, 89, 253–271, DOI:10.1007/s10847-017-0759-8.
- N. Maleki, A. Safavi and F. Tajabadi, High-performance carbon composite electrode based on an ionic liquid as a binder, Anal. Chem., 2006, 78, 3820–3826, DOI:10.1021/ac060070+.
- R. N. Goyal, M. Oyama, V. K. Gupta, S. P. Singh and R. A. Sharma, Sensors for 5-hydroxytryptamine and 5-hydroxyindole acetic acid based on nanomaterials modified electrodes, Sens. Actuators, B, 2008, 134, 816–821, DOI:10.1016/j.snb.2008.06.027.
- V. K. Gupta, R. N. Goyal and R. A. Sharma, PVC-based membranes of N,N′-dibenzyl-1,4,10,13-tetraoxa-7,16-diazacyclooctadecane as Pb(II)-selective sensor, Anal. Chim. Acta, 2009, 647, 66–71, DOI:10.1016/j.snb.2006.02.019.
- E. Tesfaye, B. S. Chandravanshi, N. Negash and M. Tessema, A new modified carbon paste electrode using N1-hydroxy-N1,N2-diphenylbenzamidine for the square wave anodic stripping voltammetric determination of Pb(II) in environmental samples, Sens. Bio-Sens. Res., 2022, 38, 100520, DOI:10.1016/j.sbsr.2022.100520.
- K. Satyanarayana and R. K. Mishra, 1,2,3-Phenyloxyamidine – a new type of analytical reagent solvent extraction and spectrophotometric determination of vanadium(V), Anal. Chem., 1974, 46(11), 1609–1610, DOI:10.1021/ac60347a023.
- F. Valentini, A. Amine, S. Orlandocci, M. L. Terranova and G. Palleschi, Carbon nanotube purification: preparation and characterization of carbon nanotube paste electrodes, Anal. Chem., 2003, 75, 5413–5421, DOI:10.1021/ac0300237.
- B. C. Janegitz, L. H. Marcolino-Junior, S. P. Campana-Filho, R. C. Faria and O. Fatibello-Filho, Anodic stripping voltammetric determination of copper(II) using a functionalized carbon nanotubes paste electrode modified with crosslinked chitosan, Sens. Actuators, B, 2009, 142, 260–266, DOI:10.1016/j.snb.2009.08.033.
- E. A. Godwill, I. C. Jane, I. U. Scholastica, U. Marcellus, A. L. Eugene and O. A. Gloria, Determination of some soft drink constituents and contamination by some heavy metals in Nigeria, Toxicol. Rep., 2015, 2, 384–390, DOI:10.1016/j.toxrep.2015.01.014.
- M. Bahgat, A. A. Farghali, W. M. A. El Rouby and M. H. Khedr, Synthesis and modification of multi-walled carbon nano-tubes (MWCNTs) for water treatment applications, J. Anal. Appl. Pyrolysis, 2010, 501, 77–84, DOI:10.1016/j.jaap.2011.07.002.
- T. A. Saleh, The influence of treatment temperature on the acidity of MWCNT oxidized by HNO3 or a mixture of HNO3/H2SO4, Appl. Surf. Sci., 2011, 257, 7746–7751, DOI:10.1016/j.apsusc.2011.04.020.
- L. Stobinski, B. Lesiak, L. Kover, J. Toth, S. Biniak, G. Trykowsk and J. Judek, Multiwall carbon nanotubes purification and oxidation by nitric acid studied by the FTIR and electron spectroscopy methods, J. Alloys Compd., 2010, 501, 77–84, DOI:10.1016/j.jallcom.2010.04.032.
- G. Moges and B. S. Chandravanshi, Separation and spectrophotometric determination of iron(III) and cobalt(III) with N1-hydroxy-N1,N2-diphenylbenzamidine in presence of azide, Ann. Chim., 1984, 74, 627–631 CAS.
- B. Berhanu and B. S. Chandravanshi, Extraction and spectrophotometric determination of molybdenum(V) using N1-hydroxy-N1,N1-diphenylbenzamidine and thiocyanate, Anal. Lett., 1995, 28(9), 1681–1691, DOI:10.1080/00032719508002774.
- M. A. Deshmukh, R. Celiesiute, A. Ramanaviciene, M. D. Shirsat and A. Ramanavicius, EDTA_PANI/SWCNTs nanocomposite modified electrode for electrochemical determination of copper(II), lead(II) and mercury(II) ions, Electrochim. Acta, 2018, 259, 930–938, DOI:10.1016/j.electacta.2017.10.131.
- M. A. Deshmukh, G. A. Bodkhe, S. Shirsat, A. Ramanavicius and M. D. Shirsat, Nanocomposite platform based on EDTA modified Ppy/SWNTs for the sensing of Pb(II) ions by electrochemical method, Front. Chem., 2018, 6(45), 1–11, DOI:10.3389/fchem.2018.00451.
- S. R. Deepak, K. Nitin and P. S. Soami, Trace determination of cadmium in water using anodic stripping voltammetry at a carbon paste electrode modified with coconut shell powder, J. Anal. Sci. Technol., 2014, 5(19), 1–8, DOI:10.1186/s40543-014-0019-0.
- J. Wang, Encycl. Electrochem., 2007, 3, 125–133, DOI:10.1002/9783527610426.bard060001.
- F. Nourifard, M. Payehghadr, M. Kalhor and A. Nejadali, An electrochemical sensor for determination of ultratrace Cd, Cu and Hg in water samples by modified carbon paste electrode base on a new Schiff base ligand, Electroanalysis, 2015, 27, 2479–2485, DOI:10.1002/elan.201500333.
- A. Afkhami, M. Soltani-Shahrivar, H. Ghaedi and T. Madrakian, Construction of modified carbon paste electrode for highly sensitive simultaneous electrochemical determination of trace amounts of copper(II) and cadmium(II), Electroanalysis, 2016, 28, 296–303, DOI:10.1002/elan.201500308.
- C. Hu, K. Wu, X. Dai and S. Hu, Simultaneous determination of lead(II) and cadmium(II) at a diacetyldioxime modified carbon paste electrode by differential pulse stripping voltammetry, Talanta, 2003, 60, 17–24, DOI:10.1016/S0039-9140(03)00116-4.
- C. J. Mei, N. A. Yusof and S. A. A. Ahmad, Electrochemical determination of lead & copper ions using thiolated calix[4]arene-modified screen-printed carbon electrode, Chemosensors, 2021, 157(9), 1–14, DOI:10.3390/chemosensors9070157.
- A. C. Liu, D. Chen, C. C. Lin, H. H. Chou and C. Chen, Application of cysteine monolayers for electrochemical determination of sub-ppb copper(II), Anal. Chem., 1999, 71, 1549–1552, DOI:10.1021/ac980956g.
- E. Guo, Simultaneous electrochemical determination of lead and copper based on graphenated multi-walled carbon nanotubes, Int. J. Electrochem. Sci., 2015, 10, 7341–7348 CAS.
- L. G. Li, M. Chen, H. Q. Hao, Q. Q. Xu, J. Wu, C. G. Xie and X. C. Fu, Electrochemical determination of trace copper(II) based on L-cysteine functionalized gold nanoparticle/CdS nanosphere hybrid, Anal. Methods, 2016, 8, 3592–3598, 10.1039/C6AY00354K.
- Z. Koudelkova, T. Syrovy, P. Ambrozova, Z. Moravec, L. Kubac, D. Hynek, L. Richtera and V. Adam, Determination of zinc, cadmium, lead, copper and silver using a carbon paste electrode and a screen printed electrode modified with chromium(III) oxide, Sens, 2017, 17, 832, DOI:10.3390/s17081832.
- B. Zeng, X. Ding, F. Zhao and Y. Yang, Electrochemical determination of copper(II) by gold electrodes modified with N-acetyl-L-cysteine, Anal. Lett., 2002, 35, 2245–2258, DOI:10.1081/AL-120016099.
- L. Hermouche, Y. Aqil, K. Abbi, Y. El Hamdouni, F. Ouanji, S. El Hajjaji, M. El Mahi, E. Lotfi and N. Labjar, Eco-friendly modified carbon paste electrode by Bigarreau Burlatkernel shells for simultaneous trace detection of cadmium, lead, and copper, Chem. Data Collect., 2021, 32, 100642, DOI:10.1016/j.cdc.2020.100642.
- S. L. Ting, S. J. Ee, A. Ananthanarayanan, K. C. Leong and P. Chen, Graphene quantum dots functionalized gold nanoparticles for sensitive electrochemical detection of heavy metal ions, Electrochim. Acta, 2015, 172, 7–11, DOI:10.1016/j.electacta.2015.01.026.
- W. Yang, D. Jaramillo, J. J. Gooding, D. B. Hibbert, R. Zhang, G. D. Willett and K. J. Fisher, Sub-ppt detection limits for copper ions with Gly-Gly-His modified electrodes, Chem. Commun., 2001, 1982–1983, 10.1039/B106730N.
- M. Fayazi, M. Ghanei-Motlagh and C. Karami, Application of magnetic nanoparticles modified with L-cysteine for preconcentration and voltammetric detection of copper(II), Microchem. J., 2022, 181, 107652, DOI:10.1016/j.microc.2022.107652.
Footnote |
| † Electronic supplementary information (ESI) available. See DOI: https://doi.org/10.1039/d2ra06941e |
| This journal is © The Royal Society of Chemistry 2022 |

