 Open Access Article
The viscosity of polyelectrolyte solutions and its dependence on their persistence length, concentration and solvent quality
E. Mayorala,
J. D. Hernández Velázquez b and
A. Gama Goicochea
 *b
*b
aInstituto Nacional de Investigaciones Nucleares, Ocoyoacac 52750, Estado de México, Mexico
bDivisión de Ingeniería Química y Bioquímica, Tecnológico de Estudios Superiores de Ecatepec, Ecatepec de Morelos 55210, Estado de México, Mexico. E-mail: agama@alumni.stanford.edu
First published on 13th December 2022
Abstract
In this work, a comprehensive study of the influence on shear viscosity of polyelectrolyte concentration, persistence length, salt concentration and solvent quality is reported, using numerical simulations of confined solutions under stationary Poiseuille flow. Various scaling regimes for the viscosity are reproduced, both under good solvent and theta solvent conditions. The key role played by the electrostatic interactions in the viscosity is borne out when the ionic strength is varied. It is argued that these results are helpful for the understanding of viscosity scaling in entangled polyelectrolyte solutions for both rigid and flexible polyelectrolytes in different solvents, which is needed to perform intelligent design of new polyelectrolytes capable of fine tuning the viscosity in complex fluids.
I. Introduction
Polyelectrolytes (PEs) are charged polymers present in natural surroundings such as in biological macromolecules and are frequently present in many industrial processes, such as in the drilling fluids for enhanced oil recovery, drug delivery, drag reduction, and flocculants, among others.1,2 PEs display typically different behavior from neutral polymers, particularly in regard to their colligative and transport properties, due to their electrostatic interactions among the charged groups along the chain. PE solutions have been the subject of extensive theoretical and experimental research, to seek for fundamental understanding of their equilibrium and transport properties. PE solution rheology is a complex issue;2 on the one hand, the chain conformation within the electrostatic blob depends on solvent quality, that is, the thermodynamic interactions between the solvent and the polymer. However, it is also known that ions in the solution affect the PEs interactions.3–13 It is known that the chain structure of PEs is rodlike up to the correlation length (ξ), while for length scales larger than ξ it is flexible and can be described by a random walk of correlation blobs.2,14 Numerous scaling regimes for the viscosity (η) and the characteristic relaxation time (τ) for flexible PEs in salt-free solutions have been proposed.2 In particular, when PE concentration exceeds the overlap concentration (c*), the relative viscosity (η/η0, where η0 is the pure solvent's viscosity) is found to be proportional to the square root of PE concentration (cp) as (η/η0 ∼ cp1/2).1,5Recent work has explored the influence of the flexibility of PEs on their rheology,15 but a complete understanding of its effect on solution viscosity, critical PE concentration, and the role of ionic strength from the dilute to the entangled regime is still lacking. Also, a comprehensive examination of chain stiffness on the scaling of the viscosity of PEs has not been achieved. The scaling of the viscosity has been studied as a function of PE concentration,15 yet the relationship between chain flexibility, PE concentration, and solvent quality has not been thoroughly investigated. Further research is essential to improve the understanding of viscosity in entangled PE solutions for both rigid and flexible chains.
The relation between the viscosity of a PE solution and the PE concentration (cp) follows power laws in the unentangled, semi-dilute regime that differ from those for neutral polymer solutions.16–18 The empirical scaling Fuoss law states a relation between the viscosity (η) and polyelectrolyte concentration (cp), such that η ∝ cps, where s is a scaling power-law exponent.1 Classical theories predict the empirical Fuoss's scaling laws, η ∝ cp1/2 and η ∝ cp5/4, for PE solutions with no added salt (nominally “salt-free”),1,14,19 and for PE solutions with salt added,2,3 respectively. Recently, new power-law exponents have been measured for salt-free PE solutions, finding 0.68 for sodium carboxymethylcellulose (NaCMC)20–22 and acrylamide-sodium-2-acrylamido-2-methylpropane-sulfonate (AM-NaAMPS),23 and 0.91 for salt-free hyaluronic acid (HA)24 and chitosan,25 all of which have different flexibilities. Although scaling theories are known to be applicable to flexible PE, characteristics such as the polymer persistence length ξ are not taken into account by those theories.2,14,26 Numerical simulations are powerful tools to explore different scenarios and complement the predictions of analytical theories that have been proposed to explain experimental trends in properties of both polyelectrolytes and neutral polymers.2,14,19,27–30
Through molecular dynamics simulations, it has been found that the PE concentration plays a fundamental role in the viscosification of aqueous solutions.31–33 Mintis and co-workers31–33 successfully reproduced experiments of zero shear rate viscosity (η0) in salt-free aqueous solutions, as a function of the PE concentration for poly(N,N-dimethylaminoethyl methacrylate) (PDMAEMA)33 using atomistic simulations. Although atomic-scale molecular simulations are very accurate, the modeling of shear viscosity requires long computational times, especially for systems with long-range interactions such as the electrostatic interaction. A useful alternative is coarse-grained computer simulations, where the short-range, non-electrostatic interactions allow for the modeling of entangled PE complex solutions.34 Here we report mesoscale numerical simulations of PEs in an aqueous solution under a Poiseuille flow for increasing stiffness of the PE chains and predict the viscosity. The influence of solvent quality on viscosity is studied as well as the net charge of the coarse-grained salt ions.
II. Models and methods
We perform a set of coarse-grained simulations using the well-known dissipative particle dynamics (DPD)35–37 model to investigate the influence of PE concentration, persistence length, salt concentration and solvent quality on the viscosity of confined solutions under stationary Poiseuille flow. The DPD model has proven to be useful in the study of several systems under stationary38–40 and oscillatory flows.41,42 In the DPD model, the total force (fi) that any DPD particle experiences is the sum of three fundamental pairwise forces, namely dissipative FDij, random FRij and conservative forces . These short-ranged forces are additive central forces that obey Newton's third law and conserve momentum. Here, the maximum strength constants of FDij and FRij are coupled through the fluctuation-dissipation theorem.36 The conservative force FCij = aij(1 − rij/rc)
![[r with combining circumflex]](https://www.rsc.org/images/entities/b_char_0072_0302.gif) ij, is a soft, linearly decaying repulsive force that depends on the relative distance between particles (rij), where
ij, is a soft, linearly decaying repulsive force that depends on the relative distance between particles (rij), where ![[r with combining circumflex]](https://www.rsc.org/images/entities/b_char_0072_0302.gif) ij = (ri − rj)/|ri − rj| is the unit position vector. The maximum strength of this force is given by the parameter aij when the relative distance between particles is smaller than a cutoff radius (rij < rc), and FCij = 0 when rij ≥ rc, with rc = 1. The aij parameters are obtained directly from the Flory–Huggins solubility parameter. Further details can be found elsewhere.37 Table 1 displays the aij parameters used in the systems modeled in this work. These values correspond to a coarse-graining degree equal to three, i.e., the volume of a DPD bead equals the volume of three water molecules.37
ij = (ri − rj)/|ri − rj| is the unit position vector. The maximum strength of this force is given by the parameter aij when the relative distance between particles is smaller than a cutoff radius (rij < rc), and FCij = 0 when rij ≥ rc, with rc = 1. The aij parameters are obtained directly from the Flory–Huggins solubility parameter. Further details can be found elsewhere.37 Table 1 displays the aij parameters used in the systems modeled in this work. These values correspond to a coarse-graining degree equal to three, i.e., the volume of a DPD bead equals the volume of three water molecules.37
| aij | S | PE | C |
|---|---|---|---|
| S | 78.3 | 60.0 (78.3) | 60.0 (78.3) |
| PE | 78.3 | 79.3 (78.3) | |
| C | 78.3 |
In addition to the three fundamental DPD forces, additional forces are needed to model chain-like structures (surfactants, polymers, PEs, etc.) to bond two and three consecutive DPD particles conforming the linear chain. Thus, we add two harmonic forces; one is a Hookean force based on the Kremer–Grest bead–spring model43
FSij = −kS(rij − r0)![[r with combining circumflex]](https://www.rsc.org/images/entities/b_char_0072_0302.gif) ij, ij,
| (1) |
| FAijk = −kA(θijk − θ0) | (2) |
 | (3) |
| kA | 2.5 | 4 | 10 | 30 | 50 | 90 | 100 | 110 | 150 | 180 | 200 | 210 | 500 |
| Lp | 0.93 | 1.58 | 4.29 | 13.24 | 22.38 | 40.47 | 44.99 | 49.52 | 67.60 | 81.17 | 91.21 | 94.74 | 225.87 |
To produce parabolic flow, the system is confined by effective surfaces. Confinement is implemented perpendicularly to the z-direction, using a unidirectional implicit force placed at the top (+lz/2) and bottom (−lz/2) sides of the simulation box. These effective walls act over all the DPD particles and are modeled as a short-ranged, linearly decaying forces
 | (4) |
![[x with combining circumflex]](https://www.rsc.org/images/entities/b_char_0078_0302.gif) , to all particles in the system. Zero velocity along the z-direction is applied to the solvent particles whose distance from either wall is z ≤ 0.15rc, to avoid slip.50 This restriction is applied only to solvent beads, since imposing to PE chains would graft them to the surfaces. In Fig. 1(a), a schematic representation of the setup used in this work is presented, showing the PEs confined by two parallel walls (see eqn (4)) separated a distance D = lz = 23rc. An external constant force along the x-axis acts on all beads, producing a parabolic velocity profile typical of Poiseuille flow, shown in Fig. 1(b). This setup has been used successfully to predict the shear viscosity of supercritical CO2 with polymers as viscosifying agents,49 and also in studies of viscosification of solutions with branched copolymers.34
, to all particles in the system. Zero velocity along the z-direction is applied to the solvent particles whose distance from either wall is z ≤ 0.15rc, to avoid slip.50 This restriction is applied only to solvent beads, since imposing to PE chains would graft them to the surfaces. In Fig. 1(a), a schematic representation of the setup used in this work is presented, showing the PEs confined by two parallel walls (see eqn (4)) separated a distance D = lz = 23rc. An external constant force along the x-axis acts on all beads, producing a parabolic velocity profile typical of Poiseuille flow, shown in Fig. 1(b). This setup has been used successfully to predict the shear viscosity of supercritical CO2 with polymers as viscosifying agents,49 and also in studies of viscosification of solutions with branched copolymers.34
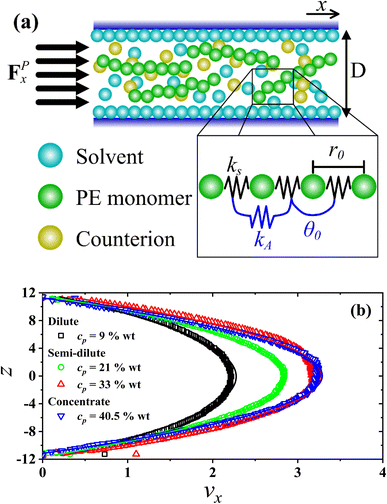 | ||
| Fig. 1 (a) Illustration of the setup implemented in this work for confined PEs under Poiseuille flow. A thin layer of solvent particles is formed close to the walls (z ≤ 0.15rc), having a velocity equal to zero along the z-direction. The linear and angular bonding in PEs is depicted as well, wherein the constants kS = 100, r0 = 0.7rc (see eqn (1)) and θ0 = 180° (see eqn (2)) are fixed in all cases, varying only the values of kA (see Table 2). (b) Profiles of the x-component of the velocity of solvent beads under stationary flow, along the z-direction of the simulation box, perpendicular to the direction of the external force (FPx) producing the flow for salt-free systems for different polyelectrolyte concentration (cp, in wt%) and Lp = 40.47 nm. Solid lines are the parabolic fits (see eqn (5)). The axes are expressed in reduced units. | ||
The viscosity (η) of the system is obtained directly after fitting the analytic velocity profiles with the steady-state solution of the Navier–Stokes equation:38
 | (5) |
The electrostatic interaction is modeled by means of the standard Ewald sums method,52,53 adapted for DPD method using charge distributions instead of point charges.54 The charge distribution used here is a Slater-type, radially decaying exponential with decay length λ, and given by55
 | (6) |
The magnitude of the reduced electrostatic force between two charge distributions with valence Zi and Zj separated by a distance r* = rij/rc is given by
 | (7) |
III. Simulation details
All simulations were carried out under canonical ensemble conditions, i.e., at constant number density and temperature, where the reduced number density is ρ = 3, and the temperature is always fixed at kBT = 1, which is also the reduced unit of energy. The intensity of the random force is σ = 3, and dissipation parameter is γ = 4.5.36 The cutoff radius is the reduced unit of length, and it is rc = 1 ≈ 6.46 Å for a coarse-grained degree of three. It is to be noted that the influence of the cutoff radius rc on the scaling properties of a system predicted by DPD has been studied by Füchslin and coworkers.58 They found that those scaling properties are invariant to coarse-graining changes, as long as the number density and the cutoff radius remain constant, which is our case. As for the influence of the walls cutoff length zc on the simulation results, it has also been analyzed in a previous work,51 where it is shown that the value chosen here minimizes the slippage at the wall–fluid interface. The PEs were modeled as linear chains made up of 15 DPD particles each, freely joined by harmonic springs, varying the PE concentration from cp = 1 wt% to cp = 42 wt%. The dimensions of the simulation box were set in all cases as lx = ly = 12rc and lz = 23rc, with the total number of DPD particles equal to N = 104.The number of counterions in the system is the same as the number of PE monomers, and four different values for the coarse-grained salt ions charges were chosen to change the ionic strength, Z = 0, 6, 9 and 12, all in units of the elementary charge, e. The parameters of the Ewald sums were α = 0.15 Å−1, the maximum vector kmax = (5, 5, 5), β = 0.929 and λ = 6.95 Å.53 The solvent quality was determined by the parameters of the conservative DPD force, aij, between solvent and polyelectrolyte monomer beads, choosing aij = 60 to model good solvent, and aij = 78.3 for theta solvent conditions, see Table 1. All simulations were run for 15 blocks of 104 time steps each, using a time step of Δt = 0.03 ≈ 0.1 ps. The first 5 blocks of each simulation are used to reach stationary flow, while the last 10 blocks were used to the production phase, where properties are averaged.
IV. Results and discussion
The effect of the flexibility of the PE chains in the performance of the viscosity is studied, under good and theta solvent conditions, with and without salt as a function of the PE concentration under Poiseuille flow; see setup in Fig. 1 for details. The results are discussed in the next sections. The results are presented in two sections, one for each solvent quality and for each case, with and without salt. The effect of increasing the persistent length (Lp) at different concentration (cp in wt%) is studied, to explore the different scaling regimes.(a) Good solvent salt free system
The non-bonding, conservative DPD force does in principle allow beads to overlap, because the force is finite when their relative distance is zero. In fact, such force is FCij(0) = aij for zero relative interparticle distance. However, in practice, DPD beads never cross each other, especially for a relatively large coarse-graining degree, Nm = 3, which is our case, when aij = 78.3. Therefore, the conservative force parameter in physical units becomes aij = 78.3(kBT/rc), which yields a large interparticle repulsion at room temperature. Fig. 3 shows the results of the viscosity of different Lp values (see eqn (3)) as a function of PE concentration in salt-free, good solvent conditions, using parameters presented in Table 1. The relative viscosity (η/η0), defined as the ratio of the viscosity of PE in solution over the viscosity of the pure solvent, η0, grows as a function of PE concentration for: flexible (Lp = 0.93, 1.58 and 4.29 nm, black, red and blue curves in Fig. 3, respectively) and rigid (Lp = 90.21 and 94.74 nm, green and olive curves in Fig. 3, respectively) PE structures. However, non-monotonous behavior is observed for semiflexible structures (Lp = 40.47, 44.97, 49.52 and 67.60 nm, navy, violet, purple and wine curves in Fig. 3, respectively), where an increase in the viscosity is initially observed in a diluted regime (cp < 20 wt%) and in the concentrated regime (cp > 35 wt%), followed by a decrease in the viscosity for the semi-diluted (20 wt% < cp < 35 wt%), see Fig. 3.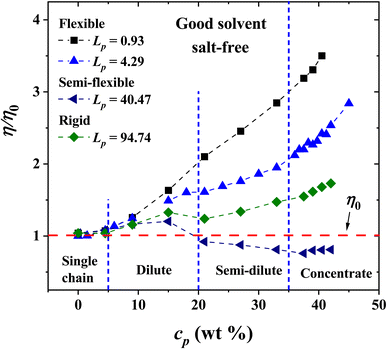 | ||
| Fig. 3 Relative viscosity η/η0 as a function of polyelectrolyte concentration, cp, under salt-free, good solvent conditions. The values of the persistence length Lp are reported in nm. | ||
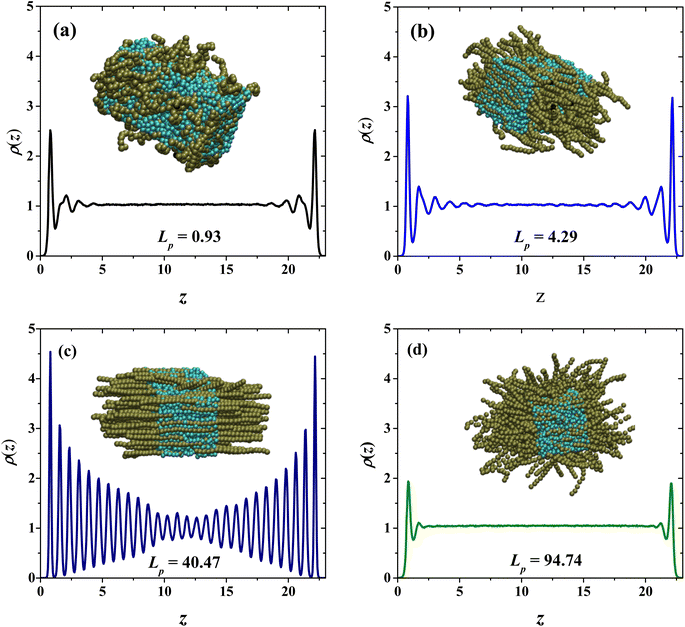
To understand this behavior, Fig. 4 presents snapshots and density profiles for the phases obtained in our systems depending on the flexibility of PEs in the semi-diluted region, at fixed PE concentration (cp = 33 wt%). The choice of harmonic-bonding interaction parameters (eqn (1)) between beads along a polyelectrolyte chain avoids bond crossings. Additionally, the interchain interactions are always taken into account, because non-bonding DPD interchain interactions are repulsive, as long as the distance between beads from neighboring chains is smaller than rc. In the dilute regime the chains do not overlap, they are far from each other and at very low concentrations can be considered as a single chain problem. For this reason, the effect of the flexibility is negligible and the behavior of the relative viscosity as a function of concentration is almost the same. For semi-dilute and concentrated solutions, the PEs start to overlap, and their conformation is clearly modified. This case is especially critical in practice because it is related to the condensation threshold emerging different conformations: hexagonal (canonical) and isotropic19 and the change in the solution's viscosity is very different from the dilute regime. In the absence of salt, the electrostatic repulsions between monomers are long ranged in the semi-dilute regime and the entropy contributions due to chain flexibility are not very significant. The semi-dilute solutions can form parallel stackings of rods, creating a phase which is macroscopically uniaxial as seen for flexible and semi-flexible PEs in Fig. 4(b) and (c), closer to the hexagonal phase also known as canonical phase.19 This type of configuration is found for semiflexible PEs (22.38 nm ≤ Lp ≤ 67.60 nm), see Fig. 4(c). The other possible configuration is the so-called random isotropic phase (see Fig. 4(a) and (d)), consisting of overlapping, partially flexible PEs, which can be analyzed by scaling methods.19
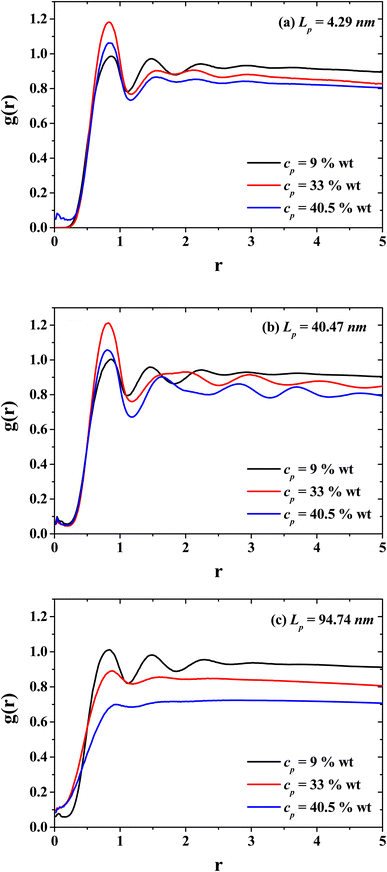
Fig. 5 presents the radial distribution functions (g(r)'s) between the solvent (CO2) and the monomers of the PEs for three characteristic persistence lengths belonging to the three different stiffness regimes: the flexible regime (Lp = 4.29 nm, Fig. 4(a)), semi-flexible regime (Lp = 40.47 nm, Fig. 4(b)) and rigid regime (Lp = 94.74 nm, Fig. 4(c)). The radial distribution functions for three different PE concentrations are shown (dilute, semi-dilute and concentrated regime, cp = 9, 33 and 40.5 wt%, respectively) to investigate the effects on the spatial distribution between CO2 and the PEs produced by the PE stiffness. Without salt, the spatial ordering between CO2 and PEs is reduced when the concentration of PEs increase. This effect is notorious when the PEs exhibit an isotropic phase for rigid polymers (see Fig. 4(d) and 7(a)), because the CO2 fails to form layers around the PEs due to the entanglement between the PEs. Therefore, the PEs at the concentrated regime tend to thicken the CO2. On the other hand, and contrary to what happen in the rigid regime, in the semi-flexible regime (Fig. 5(b)) the CO2 and PEs become structured, as expected for the hexagonal phase (see Fig. 4(c)). Such structure between the CO2 and PEs is responsible for the PEs working as CO2 thinners at this stiffness of the PEs. These results support the fact that in the dilute regime the effect of the PE stiffness on the viscosity is negligible since the spatial distribution between CO2 and PEs are similar. This feature can be seen from the g(r) functions of systems with cp = 9 wt% (black curves in Fig. 5).
(b) Scaling in the isotropic phase: flexible and rigid polyelectrolytes
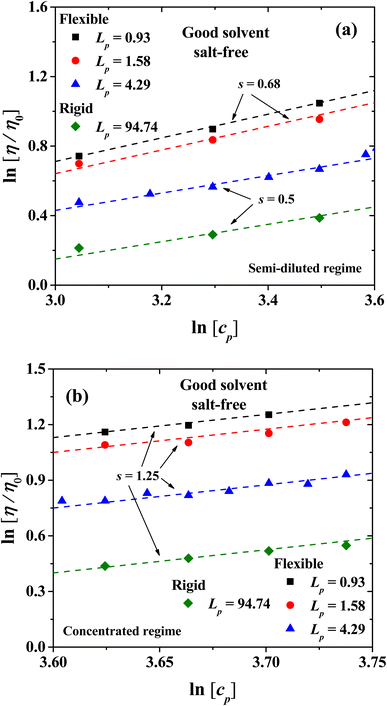
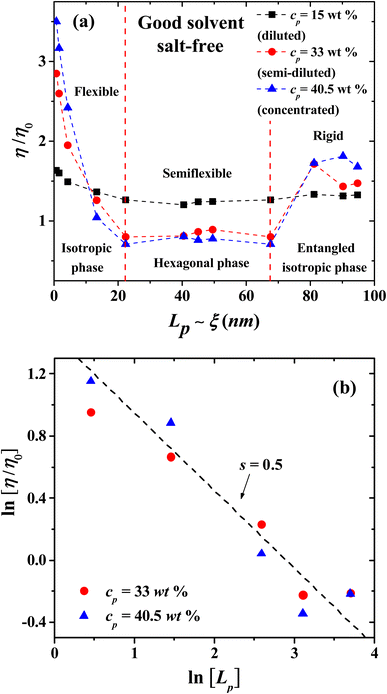
The viscosity in the isotropic phase obeys scaling laws. Fig. 6 shows the logarithmic plot of the dependence of the relative viscosity with PE concentration, for the semi-dilute and concentrated regimes, and the exponents (s) of the scaling η/η0 ∼ cps. For the semirigid and rigid polyelectrolytes with Lp = 4.29 nm and 94.74 nm, respectively, the classical scaling exponent for the viscosity (η) of semi-dilute, entangled PE solutions from Fuoss law is obtained η/η0 ∼ cp1/2 in the salt-free regime, see Fig. 6(a).23 For more flexible PEs, where the entropic contribution becomes important (Lp = 0.93 nm and 1.58 nm), the exponent s = 0.68 is found; see the circles and squares in Fig. 6(a). This prediction is in agreement with the experimental results for sodium carboxymethylcellulose (NaCMC)20–22 and acrylamide-sodium-2-acrylamido-2-methylpropane-sulfonate (AM-NaAMPS).23In the concentrated regime all the PE systems show the scaling exponent s = 5/4 = 1.25, in agreement with the expected behavior from Fuoss law for PE; see Fig. 6(b).2,3 The scaling model of a PE chain in semi-diluted solutions is based on the hypothesis of the existence of a single length scale, namely the correlation length ξ. Theoretical and experimental studies2,14,20 find that the correlation length depends on polymer concentration as ξ ∼ cp−1/2. On length scales up to the correlation length ξ, the conformations of a PE chain in semi diluted solutions are presumed to be Gaussian, while for length scales larger than ξ the PE chain is expected to be flexible and scaling properties emerge.2,14 The hypothesis of a single length scale in semi dilute PE solutions is supported by experiments and molecular dynamic simulations2,14 showing that Lp and ξ are proportional. Fig. 7 shows the dependence of the relative viscosity on the persistent length, which offers additional information with respect to its dependence on concentration (Fig. 3). Three regimes are found, associated with flexible, semi-flexible, and rigid PE chains. The relative viscosity in semi-diluted and concentrated regimes shows a power law decay for small persistence lengths (Lp < 20 nm), where the PEs are flexible. For semi-flexible PEs (20 nm < Lp < 67.6 nm) the viscosity remains nearly Lp independent, while for rigid PEs (Lp > 67.6 nm) the viscosity increases with Lp; see Fig. 7(a). The data displayed in Fig. 7(b) show that the relative viscosity in the semi dilute and concentrated regime does scale as η/η0 ∼ Lp−1/2, as expected.2,14
(c) Good solvent with salt
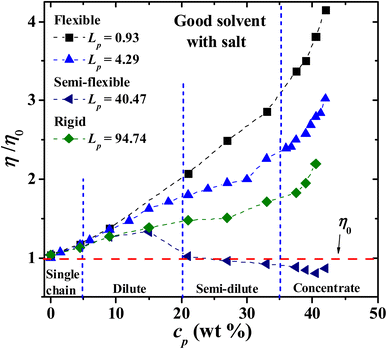
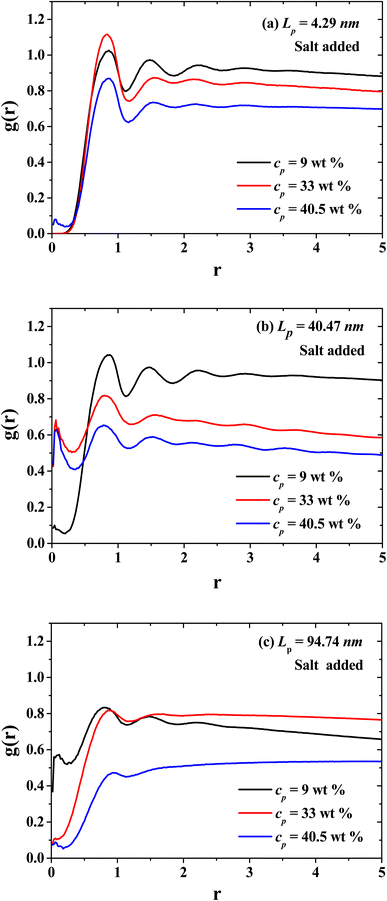
Next, the behavior of PEs with salt added to the solution is explored. Fig. 8 displays the results of the viscosity for four Lp values as the PE concentration is increased. It is found that the relative viscosity increases as a function of the PE concentration for flexible (Lp = 0.93 nm, 4.29 nm) and rigid (Lp = 90.21 nm) chains, as in the salt-free case (see Fig. 3). For semi-flexible PEs, such as those with Lp = 44.99 nm, an increase in the viscosity is found in the single chain and diluted regime (cp < 20 wt%) and a decrease in the viscosity for semi diluted and concentrated regime (cp > 20 wt%). This is due to the different spatial conformations acquired by these systems; see the discussion of Fig. 3. At the largest PE concentration, the relative viscosity for Lp = 0.93 nm is even larger than in the solvent-free case, Fig. 3. The salt ions screen the Coulomb interaction and the PEs behave as flexible neutral polymers.In Fig. 9, the radial distribution functions (g(r)'s) between the CO2 solvent and PEs of three different stiffness regimes are presented: flexible regime, semi-flexible regime and rigid regime. Additionally, the g(r)'s for the dilute, semi-dilute and concentrated regimes are presented in Fig. 9 as well. The spatial ordering between CO2 and PEs is reduced when the concentration of PEs increase, especially when the PEs is in the isotropic rigid phase where the CO2 viscosity decreases. In the semi-flexible (Fig. 9(b)) regime the CO2 and PEs produce a structured hexagonal phase and the PEs work as CO2 thinners at this stiffness regime of the PEs.
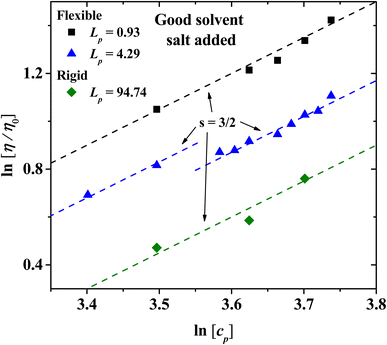
For semi-dilute and concentrated solutions, the scaling exponents with salt added in the isotropic phase for flexible and rigid PEs are presented in Fig. 10. The exponents obtained follow Fuoss law η/η0 ∼ cp3/2 when salt is added,2,3 as has often been reported for sodium polystyrene sulfonate (NaPSS) solutions.31,59–61 The data at low concentration for Lp = 4.29 nm have a different intercept at the y-axis from those at higher concentration, but the slope is the same, therefore the scaling law remains unchanged. This feature of the data arises because at concentrations higher than cp = 33 wt% the solvent and the PE beads form tightly bound structures; see Fig. 9(a). These structures can flow more easily, thus their viscosity is somewhat smaller than the one extrapolated from smaller concentrations.
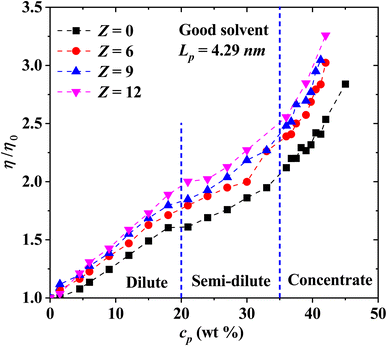
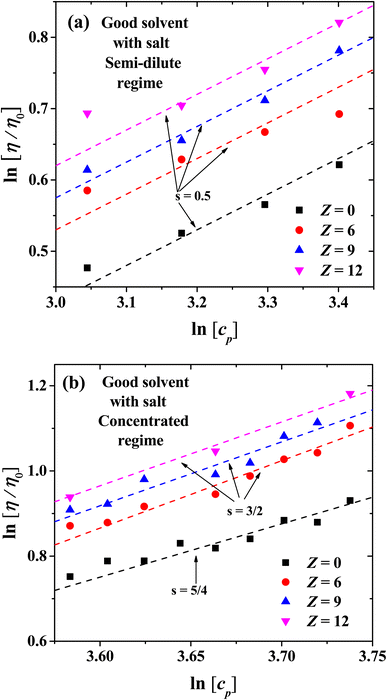
Next, we explore in Fig. 11 the effects of increasing the charge of salt ions, for solutions with flexible PEs (Lp = 4.29 nm) in the isotropic phase. To do this, the ionic concentration is kept constant while the charge of the ions is increased. A general increasing behavior in the viscosity is obtained when the charge of the ions increases, with respect to the ion-free solutions under good solvent conditions (Fig. 3). The three regimes (dilute, semi-dilute and concentrated) can be distinguished in the relative viscosity as indicated in Fig. 11. In the diluted region, the viscosity is a linear function of cp, while for the semi-diluted and concentrated regimes a power law dependence emerges. The scaling behavior is more clearly borne out in Fig. 12.
Fig. 12(a) and (b) show the scaling exponents obtained for the relative viscosity as a function of cp in the semi-diluted and concentrated regimes, under different ion's charges. In the semi-dilute regime, the classical scaling exponent s = 1/2 for the viscosity is found, once again in agreement with Fuoss law η/η0 ∼ cp1/2, with and without salt; see also Fig. 6(a). However, in the concentrated regime with increasing ion charge the viscosity has a stronger than linear concentration dependence, η/η0 ∼ cp3/2. This scaling exponent differs from the case without salt where we obtain the η/η0 ∼ cp5/4, which is the same scaling as that of the semi diluted unentangled neutral polymers in good solvent,54 as discussed in the previous section.
(d) Salt-free system under theta solvent conditions
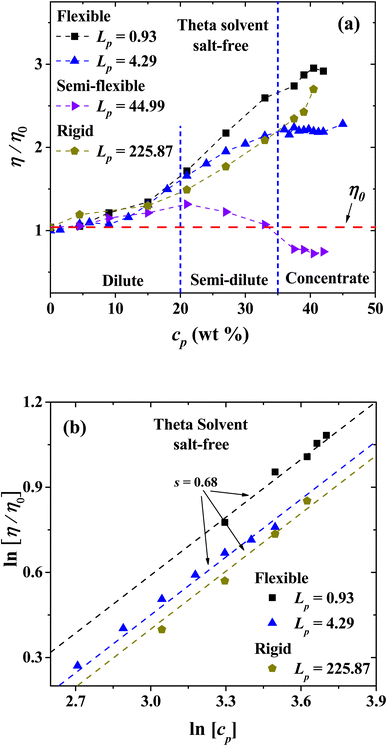
Fig. 13(a) shows the results of the viscosity at different Lp, as a function of polyelectrolyte concentration in theta solvent. The relative viscosity is found to grow as a function of the polymer concentration for flexible (Lp = 0.93 and 4.29 nm) and rigid (Lp = 225.87 nm) polyelectrolytes structures. For semi-flexible structures (44.99 nm ≤ Lp ≤ 94.74 nm), non-monotonic behavior is obtained, where the PEs tend to thicken the CO2, by increasing the relative viscosity. However, as the concentration is increased their relative viscosity decays to lower values, in particular for solutions with PEs with Lp = 44.99 nm, to lower values than the viscosity of pure CO2.Fig. 13(b) shows the logarithmic dependence of the viscosity with the polyelectrolyte concentration from the dilute to the concentrated regime in theta solvent, where scaling is expected to occur. For the flexible and rigid polyelectrolyte in the salt-free regime the expected scaling exponent is s = 0.68, similar to the one found for the very flexible polyelectrolytes in good solvent discussed in the previous section. In this case, the exponent for Fuoss law is not found, which is indicative that no entanglement between PEs take place under theta solvent conditions.
(e) Theta solvent with salt added
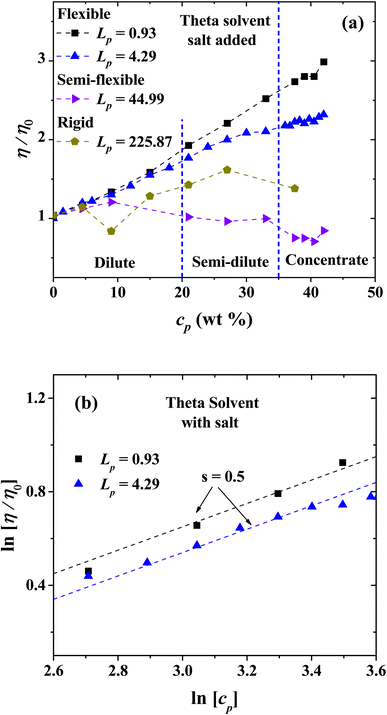
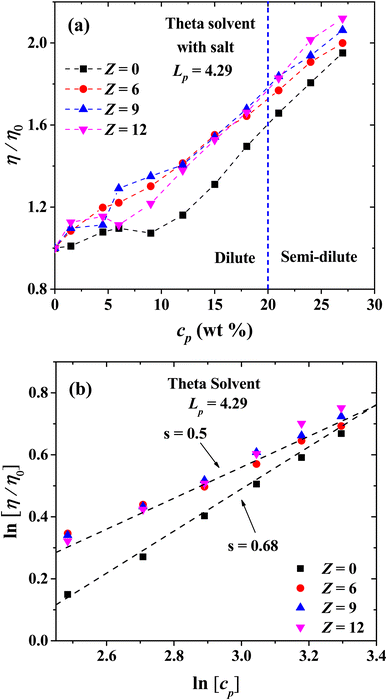
The behavior of the relative viscosity of theta solvent with PEs and salt added is presented in Fig. 14(a), when the PE's concentration is increased. It is found that the relative viscosity increases as a function of the PE concentration for flexible and rigid chains, as in the salt-free case (see Fig. 13(a)). For semi-flexible PEs, an increase in the viscosity is found in the single chain and diluted regimes but a decrease in the viscosity for semi diluted and concentrated regime is observed. Fig. 14(b) shows the scaling exponents obtained corresponding to Fuoss law.Finally, we present the results for the effect of salt ions charge for flexible PEs with Lp = 4.29 nm in the isotropic phase in theta solvent (Fig. 15). The relative viscosity increases, in comparison with the salt-free system. However, the effect of the increase in the ions charge is almost the same as in the concentrated regime when salt is added, which appears to be a general trend under theta solvent conditions. The scaling exponents of the viscosity are shown in Fig. 15(b) as a function of cp. When there is no salt in the semi-dilute regime, the scaling exponent is s = 0.68, and it change to s = 0.5 when salt is added, regardless the valence of the coarse-grained salt ions, reproducing the exponents for Fuoss law in good solvent.
V. Conclusions
An extensive study of the scaling behavior on the viscosity of confined polyelectrolyte solutions under stationary Poiseuille flow, using electrostatic dissipative particle dynamics numerical simulations is presented here. The variables studied are polyelectrolyte chain flexibility (persistence length), concentration, solvent quality and ionic strength. The dynamics of PE solutions follows the same scaling hypothesis as neutral polymers do and it effectively relies on the existence of a single length scale, the correlation length ξ. Our analysis is based on the existence of this length scale, considering that it is the persistence length, Lp, which controls the properties of the solution via the flexibility of the polymer, which is essential for the complete understanding of the structure of the systems.For salt-free polyelectrolyte chains in good solvent, our predictions agree with the scaling model of de Gennes, and with Rouse's model applied to semi-dilute solutions, following the empirical Fuoss law. The viscosity of salt-free unentangled, semi-dilute solutions is predicted to obey Fuoss law η ∼ c1/2. Above the entanglement concentration (ce) in salt-free solutions, we confirm the prediction for the viscosity of entangled solutions, η ∼ c3/2. This is in remarkable agreement with experiments performed in sulfonated polystyrene62 and poly(ZV-methyl-2-vinylpyridinium chloride)63 solutions, where the Fuoss law is confirmed by experiments. Additionally, the results for good and theta solvent conditions show that solvent quality is an essential factor influencing the chain's conformations due to the competition of electrostatic and non-electrostatic interactions between the PEs monomers and the solvent molecules.
Although there are some reports in the literature on the viscosity of PEs, very few are available on the influence of the PEs persistence length. This is essential to further the understanding of viscosity scaling in entangled polyelectrolyte solutions under different solvent conditions. This is needed to perform intelligent design of new polyelectrolytes, capable of tuning the viscosity in different complex fluids. Additionally, studying the effects of ionic strength using multivalent ions on complexation in PE solutions is of great importance because this phenomenon is present in biological systems. The strong salt effect on complexation confirms the electrostatic mechanism of viscosification in our simulations. Lastly, it is to be noted that the non-linear dynamics of polyelectrolyte solutions has been overlooked by theoretical approaches; for these reasons dynamic electrostatic coarse-grained computer simulations are promising tools to help in the design of new materials and in polymer processing.
Author contributions
E. M.: investigation, formal analysis, methodology, writing-original draft. J. D. H. V.: data curation, formal analysis, software, writing-original draft. A. G. G.: conceptualization, funding acquisition, supervision, writing-review & editing.Conflicts of interest
There are no conflicts of interest to declare.Acknowledgements
E. M. acknowledges funding from COMECYT, under the program FICDTEM-2021-013. The calculations reported here were mostly performed using the supercomputing facilities of ABACUS Laboratorio de Matemática Aplicada y Cómputo de Alto Rendimiento of CINVESTAV-IPN. The authors acknowledge also the computer resources offered by the Laboratorio de Supercómputo y Visualización en Paralelo (LSVP-Yoltla) of UAM-Iztapalapa, where part of the simulations was carried out. J. D. H. V. thanks CONACYT for a postdoctoral fellowship. A.G.G. thanks also CONACYT for support through grant 320197.References
- R. M. Fuoss, Polyelectrolytes, Discuss. Faraday Soc., 1951, 11, 125, 10.1039/df9511100125.
- A. v. Dobrynin, R. H. Colby and M. Rubinstein, Scaling Theory of Polyelectrolyte Solutions, Macromolecules, 1995, 28(6), 1859–1871, DOI:10.1021/ma00110a021.
- M. Muthukumar, Dynamics of Polyelectrolyte Solutions, J. Chem. Phys., 1997, 107(7), 2619–2635, DOI:10.1063/1.474573.
- J. Cohen, Z. Priel and Y. Rabin, Viscosity of Dilute Polyelectrolyte Solutions, J. Chem. Phys., 1988, 88(11), 7111–7116, DOI:10.1063/1.454361.
- Y. Rabin, J. Cohen and Z. Priel, Viscosity of Polyelectrolyte Solutions—the Generalized Fuoss Law, J. Polym. Sci., Polym. Lett. Ed., 1988, 26(9), 397–399, DOI:10.1002/pol.1988.140260904.
- J. Cohen and Z. Priel, Viscosity of Dilute Polyelectrolyte Solutions: Concentration Dependence on Sodium Chloride, Magnesium Sulfate and Lanthanum Nitrate, Macromolecules, 1989, 22(5), 2356–2358, DOI:10.1021/ma00195a060.
- H. Vink, Rheology of Dilute Polyelectrolyte Solutions, Polymers, 1992, 33(17), 3711–3716, DOI:10.1016/0032-3861(92)90660-O.
- I. Roure, M. Rinaudo, M. Milas and E. Frollini, Viscometric Behaviour of Polyelectrolytes in the Presence of Low Salt Concentration, Polymers, 1998, 39(22), 5441–5445, DOI:10.1016/S0032-3861(97)10274-9.
- S. Carrington, J. Odell, L. Fisher, J. Mitchell and L. Hartley, Polyelectrolyte Behaviour of Dilute Xanthan Solutions: Salt Effects on Extensional Rheology, Polymers, 1996, 37(13), 2871–2875, DOI:10.1016/0032-3861(96)87653-1.
- N. Plucktaveesak, A. J. Konop and R. H. Colby, Viscosity of Polyelectrolyte Solutions with Oppositely Charged Surfactant, J. Phys. Chem. B, 2003, 107(32), 8166–8171, DOI:10.1021/jp0275995.
- A. J. Konop and R. H. Colby, Polyelectrolyte Charge Effects on Solution Viscosity of Poly(Acrylic Acid), Macromolecules, 1999, 32(8), 2803–2805, DOI:10.1021/ma9818174.
- J. Eckelt, A. Knopf and B. A. Wolf, Polyelectrolytes: Intrinsic Viscosities in the Absence and in the Presence of Salt, Macromolecules, 2008, 41(3), 912–918, DOI:10.1021/ma702054f.
- S. Dou and R. H. Colby, Solution Rheology of a Strongly Charged Polyelectrolyte in Good Solvent, Macromolecules, 2008, 41(17), 6505–6510, DOI:10.1021/ma8001438.
- M. Rubinstein, R. H. Colby and A. v. Dobrynin, Dynamics of Semidilute Polyelectrolyte Solutions, Phys. Rev. Lett., 1994, 73(20), 2776–2779, DOI:10.1103/PhysRevLett.73.2776.
- N. B. Wyatt and M. W. Liberatore, Rheology and Viscosity Scaling of the Polyelectrolyte Xanthan Gum, J. Appl. Polym. Sci., 2009, 114(6), 4076–4084, DOI:10.1002/app.31093.
- A. Dobrynin and M. Rubinstein, Theory of Polyelectrolytes in Solutions and at Surfaces, Prog. Polym. Sci., 2005, 30(11), 1049–1118, DOI:10.1016/j.progpolymsci.2005.07.006.
- R. H. Colby, Structure and Linear Viscoelasticity of Flexible Polymer Solutions: Comparison of Polyelectrolyte and Neutral Polymer Solutions, Rheol. Acta, 2010, 49(5), 425–442, DOI:10.1007/s00397-009-0413-5.
- M. Muthukumar, 50th Anniversary Perspective: A Perspective on Polyelectrolyte Solutions, Macromolecules, 2017, 50(24), 9528–9560, DOI:10.1021/acs.macromol.7b01929.
- P. de Gennes, P. Pincus, R. Velasco, F. Brochard, P. G. de Gennes, R. M. Velasco and F. Bâtiment, Remarks on Polyelectrolyte Conformation, J. Phys., 1976, 37(12), 1461–1473, DOI:10.1051/jphys:0197600370120146100ï.
- C. G. Lopez, S. E. Rogers, R. H. Colby, P. Graham and J. T. Cabral, Structure of Sodium Carboxymethyl Cellulose Aqueous Solutions: A SANS and Rheology Study, J. Polym. Sci., Part B: Polym. Phys., 2015, 53(7), 492–501, DOI:10.1002/polb.23657.
- C. G. Lopez, R. H. Colby, P. Graham and J. T. Cabral, Viscosity and Scaling of Semiflexible Polyelectrolyte NaCMC in Aqueous Salt Solutions, Macromolecules, 2017, 50(1), 332–338, DOI:10.1021/acs.macromol.6b02261.
- C. G. Lopez, Entanglement Properties of Polyelectrolytes in Salt-Free and Excess-Salt Solutions, ACS Macro Lett., 2019, 8(8), 979–983, DOI:10.1021/acsmacrolett.9b00161.
- P. Kujawa, A. Audibert-Hayet, J. Selb and F. Candau, Effect of Ionic Strength on the Rheological Properties of Multisticker Associative Polyelectrolytes, Macromolecules, 2006, 39(1), 384–392, DOI:10.1021/ma051312v.
- S. A. Dubrovskii, A. N. Zelenetskii, S. A. Uspenskii and V. N. Khabarov, Effect of Borax Additives on the Rheological Properties of Sodium Hyaluronate Aqueous Solutions, Polym. Sci., Ser. A, 2014, 56(2), 205–210, DOI:10.1134/S0965545X14020047.
- F. del Giudice, V. Calcagno, V. Esposito Taliento, F. Greco, P. A. Netti and P. L. Maffettone, Relaxation Time of Polyelectrolyte Solutions: When μ -Rheometry Steps in Charge, J. Rheol., 2017, 61(1), 13–21, DOI:10.1122/1.4965930.
- M. Hara, Polyelectrolytes: Science and Technology, Marcel Dekker, Inc., New York, 1993 Search PubMed.
- M. Muthukumar, Theory of Viscoelastic Properties of Polyelectrolyte Solutions, Polymers, 2001, 42(13), 5921–5923, DOI:10.1016/S0032-3861(00)00907-1.
- R. Borsali, T. A. Vilgis and M. Benmouna, Viscosity of Weakly Charged Polyelectrolyte Solutions: The Mode-Mode Coupling Approach, Macromolecules, 1992, 25(20), 5313–5317, DOI:10.1021/ma00046a032.
- T. Odijk, Possible Scaling Relations for Semidilute Polyelectrolyte Solutions, Macromolecules, 1979, 12(4), 688–693, DOI:10.1021/ma60070a028.
- L. Wang and V. A. Bloomfield, Cooperative Diffusion of Semidilute Polyelectrolyte Solutions: Analysis by Renormalization Group Theory, Macromolecules, 1989, 22(6), 2742–2746, DOI:10.1021/ma00196a035.
- C. G. Lopez and W. Richtering, Viscosity of Semidilute and Concentrated Nonentangled Flexible Polyelectrolytes in Salt-Free Solution, J. Phys. Chem. B, 2019, 123(26), 5626–5634, DOI:10.1021/acs.jpcb.9b03044.
- J. Dedic, H. I. Okur and S. Roke, Polyelectrolytes Induce Water-Water Correlations That Result in Dramatic Viscosity Changes and Nuclear Quantum Effects, Sci. Adv., 2019, 5(12), eaay1443, DOI:10.1126/sciadv.aay1443.
- D. G. Mintis, M. Dompé, M. Kamperman and V. G. Mavrantzas, Effect of Polymer Concentration on the Structure and Dynamics of Short Poly(N, N-Dimethylaminoethyl Methacrylate) in Aqueous Solution: A Combined Experimental and Molecular Dynamics Study, J. Phys. Chem. B, 2020, 124(1), 240–252, DOI:10.1021/acs.jpcb.9b08966.
- E. Mayoral and A. Gama Goicochea, Modeling of Branched Thickening Polymers under Poiseuille Flow Gives Clues as to How to Increase a Solvent's Viscosity, J. Phys. Chem. B, 2021, 125(6), 1692–1704, DOI:10.1021/acs.jpcb.0c11087.
- P. J. Hoogerbrugge and J. M. V. A. Koelman, Simulating Microscopic Hydrodynamic Phenomena with Dissipative Particle Dynamics, Epl, 1992, 19(3), 155–160, DOI:10.1209/0295-5075/19/3/001.
- P. Espanol and P. Warren, Statistical Mechanics of Dissipative Particle Dynamics, Epl, 1995, 30(4), 191–196, DOI:10.1209/0295-5075/30/4/001.
- R. D. Groot and P. B. Warren, Dissipative Particle Dynamics: Bridging the Gap between Atomistic and Mesoscopic Simulation, J. Chem. Phys., 1997, 107(11), 4423–4435, DOI:10.1063/1.474784.
- C. Pastorino and A. Gama Goicochea, Dissipative Particle Dynamics: A Method to Simulate Soft Matter Systems in Equilibrium and Under Flow, in Environmental Science and Engineering, Springer Berlin Heidelberg, 2015, pp. 51–79, DOI:10.1007/978-3-319-11487-3_3.
- P. Español and P. B. Warren, Perspective: Dissipative Particle Dynamics, J. Chem. Phys., 2017, 146(15), 150901, DOI:10.1063/1.4979514.
- Z. Li, X. Bian, X. Li, M. Deng, Y.-H. Tang, B. Caswell and G. E. Karniadakis, Dissipative Particle Dynamics: Foundation, Evolution, Implementation, and Applications, in Particles in Flows, ed. Bodnár, T., Galdi, G. and Nečasová Š., Advances in Mathematical Fluid Mechanics, 2017, pp. 255–326, DOI:10.1007/978-3-319-60282-0_5.
- I. v. Pivkin and G. E. Karniadakis, A New Method to Impose No-Slip Boundary Conditions in Dissipative Particle Dynamics, J. Comput. Phys., 2005, 207(1), 114–128, DOI:10.1016/j.jcp.2005.01.006.
- J. D. Hernández Velázquez, S. Mejía-Rosales and A. Gama Goicochea, Nanorheology of Poly - and Monodispersed Polymer Brushes under Oscillatory Flow as Models of Epithelial Cancerous and Healthy Cell Brushes, Polymers, 2017, 129, 44–56, DOI:10.1016/j.polymer.2017.09.046.
- G. S. Grest and K. Kremer, Molecular Dynamics Simulation for Polymers in the Presence of a Heat Bath, Phys. Rev. A: At., Mol., Opt. Phys., 1986, 33(5), 3628–3631, DOI:10.1103/PhysRevA.33.3628.
- A. Gama Goicochea, M. Romero-Bastida and R. López-Rendón, Dependence of Thermodynamic Properties of Model Systems on Some Dissipative Particle Dynamics Parameters, Mol. Phys., 2007, 105(17–18), 2375–2381, DOI:10.1080/00268970701624679.
- J. S. Hernández-Fragoso, S. J. Alas and A. Gama Goicochea, Polymer Chains of a Large Persistence Length in a Polymer Brush Require a Lower Force to Be Compressed Than Chains with a Short Persistence Length, ACS Appl. Polym. Mater., 2020, 2(11), 5006–5013, DOI:10.1021/acsapm.0c00858.
- E. I. Barcelos, S. Khani, A. Boromand, L. F. Vieira, J. A. Lee, J. Peet, M. F. Naccache and J. Maia, Controlling Particle Penetration and Depletion at the Wall Using Dissipative Particle Dynamics, Comput. Phys. Commun., 2021, 258, 107618, DOI:10.1016/j.cpc.2020.107618.
- M. Panoukidou, C. R. Wand and P. Carbone, Comparison of equilibrium techniques for the viscosity calculation from DPD simulations, Soft Matter, 2021, 17, 8343, 10.1039/d1sm00891a.
- E. E. Keaveny, I. V. Pivkin, M. Maxey and G. E. Karniadakis, A Comparative Study Between Dissipative Particle Dynamics and Molecular Dynamics for Simple- and Complex-Geometry Flows, J. Chem. Phys., 2005, 123, 104107, DOI:10.1063/1.2018635.
- A. Chatterjee, Modification to Lees-Edwards Periodic Boundary Condition for Dissipative Particle Dynamics Simulation with High Dissipation Rates, Mol. Simul., 2007, 33(15), 1233–1236, DOI:10.1080/08927020701713894.
- T. L. Palmer, T. A. Espås and R. Skartlien, Effects of Polymer Adsorption on the Effective Viscosity in Microchannel Flows: Phenomenological Slip Layer Model from Molecular Simulations, J. Dispersion Sci. Technol., 2019, 40(2), 264–275, DOI:10.1080/01932691.2018.1467776.
- A. Gama Goicochea and A. Firoozabadi, CO2 Viscosification by Functional Molecules from Mesoscale Simulations, J. Phys. Chem. C, 2019, 123(48), 29461–29467, DOI:10.1021/acs.jpcc.9b08589.
- M. P. Allen and D. J. Tildesley, Computer Simulations of Liquids, Oxford University Press, New York, 1987 Search PubMed.
- F. Alarcón, G. Pérez-Hernández, E. Pérez and A. Gama Goicochea, Coarse-Grained Simulations of the Salt Dependence of the Radius of Gyration of Polyelectrolytes as Models for Biomolecules in Aqueous Solution, Eur. Biophys. J., 2013, 42(9), 661–672, DOI:10.1007/s00249-013-0915-z.
- M. González-Melchor, E. Mayoral, M. E. Velázquez and J. Alejandre, Electrostatic Interactions in Dissipative Particle Dynamics Using the Ewald Sums, J. Chem. Phys., 2006, 125(22), 224107, DOI:10.1063/1.2400223.
- C. Ibergay, P. Malfreyt and D. J. Tildesley, Electrostatic Interactions in Dissipative Particle Dynamics: Toward a Mesoscale Modeling of the Polyelectrolyte Brushes, J. Chem. Theory Comput., 2009, 5(12), 3245–3259, DOI:10.1021/ct900296s.
- K. Procházka, Z. Limpouchová, M. Štěpánek, K. Šindelka and M. Lísal, DPD Modelling of the Self- and Co-Assembly of Polymers and Polyelectrolytes in Aqueous Media: Impact on Polymer Science, Polymers, 2022, 14(3), 404, DOI:10.3390/polym14030404.
- F. Alarcón, E. Pérez and A. Gama Goicochea, Dissipative Particle Dynamics Simulations of Weak Polyelectrolyte Adsorption on Charged and Neutral Surfaces as a Function of the Degree of Ionization, Soft Matter, 2013, 9(14), 3777–3788, 10.1039/c2sm27332b.
- R. M. Füchslin, H. Fellermann, A. Eriksson and H.-J. Hans-Joachim Ziock, Coarse graining and scaling in dissipative particle dynamics, J. Chem. Phys., 2009, 130, 214102, DOI:10.1063/1.3143976.
- W. E. Krause, J. S. Tan and R. H. Colby, Semidilute Solution Rheology of Polyelectrolytes with No Added Salt, J. Polym. Sci., Part B: Polym. Phys., 1999, 37(24), 3429–3437, DOI:10.1002/(SICI)1099-0488(19991215)37:24<3429::AID-POLB5>3.0.CO;2-E.
- D. C. Boris and R. H. Colby, Rheology of Sulfonated Polystyrene Solutions, Macromolecules, 1998, 31(17), 5746–5755, DOI:10.1021/ma971884i.
- S. Dou and R. H. Colby, Charge Density Effects in Salt-Free Polyelectrolyte Solution Rheology, J. Polym. Sci., Part B: Polym. Phys., 2006, 44(14), 2001–2013, DOI:10.1002/polb.20853.
- R. F. Prini and A. E. Lagos, Tracer Diffusion, Electrical Conductivity, and Viscosity of Aqueous Solutions of Polystyrenesulfonates, J. Polym. Sci., Part A: Polym. Chem., 1964, 2(6), 2917–2928, DOI:10.1002/pol.1964.100020640.
- M. Yamaguchi, M. Wakutsu, Y. Takahashi and I. Noda, Viscoelastic Properties of Polyelectrolyte Solutions. 2. Steady-State Compliance, Macromolecules, 1992, 25(1), 475–478, DOI:10.1021/ma00027a074.
| This journal is © The Royal Society of Chemistry 2022 |

