 Open Access Article
Improving the steric hindrance effect of linear sulfonated acetone–formaldehyde dispersant and its performance in coal–water slurry†
Wenlin Shuaiabc,
Shiwei Wang *be,
Taotao Sunb,
Hongfeng Yin
 b,
Yu Zub,
Gang Yaod,
Zhonghua Lid,
Zhaokun Qid and
Mei Zhong*ac
aState Key Laboratory of Chemistry and Utilization of Carbon-Based Energy Resources Jointly Built by Xinjiang Uyghur Autonomous Region and Ministry of Science and Technology, Xinjiang University, Urumqi 830046, Xinjiang, P. R. China. E-mail: zhongmei0504@126.com
bNingbo Institute of Materials Technology and Engineering, Chinese Academy of Sciences, Ningbo 315201, Zhejiang, P. R. China. E-mail: wangshiwei@nimte.ac.cn
cXinjiang Key Laboratory of Coal Clean Conversion & Chemical Engineering Process, School of Chemical Engineering and Technology, Xinjiang University, Urumqi 830046, Xinjiang, P. R. China
dYankuang Xinjiang Coal Chemical Co., Ltd, Urumqi 831408, Xinjiang, P. R. China
eZhejiang Institute of Tianjin University, Ningbo, Zhejiang 300192, P. R. China
First published on 12th December 2022
Abstract
Dispersants can have a substantial impact on the rheological characteristics of coal–water slurry (CWS). Due to their advantages in cost and synthesis, linear dispersants are currently most often employed in the commercial manufacturing of CWS. However, this kind of dispersant gives limited performance because of its weak adsorption and steric hindrance effect on the coal–water interface. This work describes a new linear dispersant (PSAF) with a significant steric hindrance effect that was created by incorporating phenolic groups into its molecular architecture, which gives higher maximum coal content (63.79 wt%) than that (63.11 wt%) from sulfonated acetone–formaldehyde (SAF). The synthesis mechanism was investigated using GPC, FT-IR and NMR. Various technologies were used to explore the rheological characteristics and dispersion mechanism for CWS prepared with PSAF. PSAF as well as SAF showed monolayer adsorption on the surface of coal and displayed a higher adsorption layer thickness (3.5 nm). PSAF dispersant presents stand-up adsorption rather than lie-down adsorption of SAF because of its strong π–π action, resulting in a stronger steric hindrance effect and improved rheological performance. This work can provide guidelines for the development of a high-performance dispersant as well as an understanding of the dispersal process for CWS.
Introduction
Coal is a vital source of carbon-rich fossil energy for China, but its direct combustion poses a serious threat to the environment and human health.1,2 Coal–water slurry (CWS, which contains around 60–75 wt% coal, 25–40 wt% water, and about 1 wt% dispersant) has been widely used in gasification3 and is regarded as an attractive alternative to oil as a fuel due to its cleanliness and low cost.4,5 Highly efficient gasification and combustion necessitate CWS with (i) a high coal content to maximise the heating value and (ii) a low apparent viscosity for pipeline transportation.6 However, whenever the coal concentration in CWS increases, the particles agglomerate, causing the suspension to settle and lose fluidity and stability. The resulting high viscosity is detrimental to CWS pumping and transportation.7,8 As a result, the present focus of research is on developing methods for preparing concentrated CWS with increased flowability and stability.9,10It is widely known that a dispersant, in addition to coal particle size distribution and natural coal characteristics (including mineral composition, coal porosity, and surface properties), is an important factor in improving the rheological properties and stability of CWS.11,12 Many studies have discovered that dispersants can enhance CWS concentration via a lowering of coal–water interfacial tension, hydrophilic adjustment of the coal surface, electrostatic force and/or a steric hindrance effect.13–15 A dispersant has a great influence on the stability of coal–water slurry. The dispersant adsorbed on the surface of coal particles will change the charge density on the surface of coal particles and enhance the electrostatic repulsion among the particles.7 In addition, the dispersant adsorbed on the particle surface will create steric repulsion and prevent particle adhesion. Electrostatic repulsion and/or steric repulsion are beneficial to improving slurry stability.16 In general, there is little relationship between electrostatic repulsion and the spatial steric repulsive force of the CWS dispersion system. But in some unique situations, the adsorption behavior of the dispersant will alter due to a change in the double layer structure,17 which will subsequently lead to a change in the steric repulsive force.
Many dispersants with various structures have been synthesized and evaluated over the last several decades, including one-dimensional (1D) linear (e.g., sulfonated acetone–formaldehyde resin, SAF), two-dimensional (2D) planar (e.g., poly-carboxylic acid, PC), and three-dimensional (3D) spatial dispersants (e.g., tannic acid and acrylic acid copolymer, TTA).18–20 Although there are many reports on the application of 3D spatial dispersants in coal–water slurry and other slurries, complex processing and high cost hinder their practical industrial application.21–23 Linear (also known as ribbon) dispersants played an important role in the preparation of CWS, mainly thanks to their low cost and easy synthesis.24 However, this type of dispersant has poor coal particle adsorption, resulting in performance limitations due to weak interaction between dispersant and coal surface.25 In addition, the effect of a linear dispersant on improvement in slurry concentration has mainly relied on hydrophilic modification and electrostatic force instead of the steric hindrance effect and reduction in interfacial tension.19,26,27 In contrast, 2D and 3D dispersants give better dispersion performance due to a superior steric hindrance effect.27,28 Therefore, improving the coal–water interaction and steric hindrance impact of a linear dispersant by structural design and synthesis is critical.
Recently, Li et al. demonstrated that benzene rings in the dispersant could facilitate and strengthen its absorption on the coal surface based on the π–π stacking effect.29 Based on a similar concept, Zhang et al. synthesized an effective dispersant using humic acid as raw material.30 However, as far as we know, an improvement in the steric hindrance effect for a linear dispersant has not been recorded. A new linear dispersant (PSAF) with a strong steric hindrance effect was synthesized in this study by introducing phenol into its molecular architecture, and the synthesis mechanism was explored. Furthermore, PSAF dispersants were used to prepare highly-concentrated CWS, whose rheological properties were investigated. Finally, the mechanism of coal particle dispersal and stabilization by PSAF dispersant in CWS was investigated, and an adsorption model was proposed. This dispersant is also more environmentally friendly and cost-effective, as phenol can be easily supplied by coal tar creosote from the coal chemical industry.31 This work can provide guidelines for the development of a high-performance dispersant and an understanding of the dispersal mechanism for CWS.
Experimental
Materials
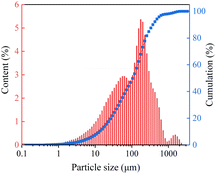
Formaldehyde solution (37%), acetone, and sodium sulfite were provided by Sinopharm Chemical Reagent Co., Ltd. HOCH2SO3Na (97%) and phenol were provided by Maclin Co., Ltd. o-Cresol was provided by Aladdin Co., Ltd. 3,5-Dimethylphenol was provided by Tokyo Chemical Industry Co., Ltd. Mixed phenol was prepared by compounding with a mass ratio of 34.76% phenol, 40.82% o-cresol, and 24.42% 3,5-dimethylphenol (based on the composition of coal tar creosote). Coal tar creosote was supplied by Juye Runjia Chemical Co., Ltd. Yulin coal samples were kindly donated by Shandong Hualu-Hengsheng Chemical Co., Ltd. Proximate and ultimate analysis data of raw coal samples are shown in Table 1, and their size distribution is shown in Fig. 1.| Proximate analysis (wt%) | Ultimate analysisa (wt%) | |||||||
|---|---|---|---|---|---|---|---|---|
| Madb | Adc | Vdc | FCdc | Cdaf | Hdaf | Odaf | Ndaf | St,daf |
| a Ultimate analysis is on dry ash free basis.b Mad refers to the moisture content on air dried basis.c Ad, Vd, and FCd refer to the content of ash, volatile, and fixed carbon on dried basis. | ||||||||
| 6.25 | 7.10 | 34.45 | 58.44 | 79.91 | 5.01 | 13.66 | 0.99 | 0.42 |
Synthesis of dispersants
PSAF dispersants were synthesized through reactions among sodium sulfite, acetone, phenol, and formaldehyde aqueous solution (37 wt%). The reaction was carried out in a round-bottomed flask equipped with a temperature-controlled electric heating device, a magnetic stirrer, a thermometer, a peristaltic pump, and a reflux condenser. Typically, 8.14 g of sodium sulfite was mixed with 50.00 g of deionized water in a flask by continuous stirring for 10 min, followed by the dropwise addition of 11.40 g of aqueous formaldehyde. After continuous stirring for 5 min, 7.13 g of phenol was added into the above mixture followed by heating at 50 °C for 30 min. Then, a mixture of 12.50 g of acetone and 15.20 g of formaldehyde solution was added dropwise by a peristaltic pump in 20 min. During this process, the reaction solution was heated synchronously to 90 °C. After that, 11.40 g of formaldehyde solution was added into the flask by a peristaltic pump in 10 min followed by continuous stirring for 4–8 h at 90 °C. As a result, a series of PSAF with different molecular weights were obtained, denoted PSAF-t according to the reaction time of the final step.The procedure for synthesizing SAF dispersants was the same as that for PSAF except for the introduction of phenol. Similarly, the SAF dispersant samples were denoted SAF-t according to the reaction time of the final step.
The procedure for synthesizing x-PSAF-6 dispersants was the same as that for PSAF-6. The difference is that phenol in the raw materials was replaced by o-cresol, 3,5-dimethylphenol, mixed phenol, and coal tar creosote. The x-PSAF-6 dispersant samples were denoted o-PSAF-6, d-PSAF-6, m-PSAF-6, and c-PSAF-6, respectively.
Characterization and measurement
| Ws = mw/mc × 100% | (1) |
Results and discussion
Characterization of dispersants
A series of PSAF-t and SAF-t dispersants were synthesized by the steps described in Synthesis of dispersants. The molecular weight distribution of these synthetic dispersants was analyzed by gel permeation chromatography (GPC) and the results are shown in Fig. 2a and Table S1.† As shown in Fig. 2a, the dispersants contain some unreacted monomers or prepolymers. In general, the molecular weight of the SAF-t and PSAF-t dispersants gradually increased with an extension of reaction time. As shown in Table S1,† the molecular weights of SAF-t dispersants (ca. 50![[thin space (1/6-em)]](https://www.rsc.org/images/entities/char_2009.gif) 000–65
000–65![[thin space (1/6-em)]](https://www.rsc.org/images/entities/char_2009.gif) 000 Da) are obviously higher than those of PSAF-t dispersants (ca. 6500–12
000 Da) are obviously higher than those of PSAF-t dispersants (ca. 6500–12![[thin space (1/6-em)]](https://www.rsc.org/images/entities/char_2009.gif) 000 Da). The polydispersity indexes of PSAF-t (ca. 1–2) are lower than those of SAF-t (ca. 3–5), indicating that their molecular weight distribution is narrower. The typical PSAF-6 and SAF-4 samples were selected for further structural characterization analysis. To avoid the effect of unreacted precursors in the product on structural analysis, the samples need to be purified. The specific treatment process was as follows: the as-synthesized PSAF-6 and SAF-4 samples were dialyzed (molecular weight cutoff for 3500 Da) for 5 and 3 days, respectively. Subsequently, the purified samples were freeze-dried to obtain powdered products for further characterization and analysis. GPC was used to detect the molecular weight distributions of PSAF-6 and SAF-4 and to evaluate the degree of purification (Fig. S2†). Infrared spectra of PSAF-6 and SAF-4 dispersants are shown in Fig. S3† (full spectra) and Fig. 2b (partial spectra). PSAF-6 and SAF-4 dispersants contained O–H (3449 cm−1), C–H (2928 and 2869 cm−1), C
000 Da). The polydispersity indexes of PSAF-t (ca. 1–2) are lower than those of SAF-t (ca. 3–5), indicating that their molecular weight distribution is narrower. The typical PSAF-6 and SAF-4 samples were selected for further structural characterization analysis. To avoid the effect of unreacted precursors in the product on structural analysis, the samples need to be purified. The specific treatment process was as follows: the as-synthesized PSAF-6 and SAF-4 samples were dialyzed (molecular weight cutoff for 3500 Da) for 5 and 3 days, respectively. Subsequently, the purified samples were freeze-dried to obtain powdered products for further characterization and analysis. GPC was used to detect the molecular weight distributions of PSAF-6 and SAF-4 and to evaluate the degree of purification (Fig. S2†). Infrared spectra of PSAF-6 and SAF-4 dispersants are shown in Fig. S3† (full spectra) and Fig. 2b (partial spectra). PSAF-6 and SAF-4 dispersants contained O–H (3449 cm−1), C–H (2928 and 2869 cm−1), C![[double bond, length as m-dash]](https://www.rsc.org/images/entities/char_e001.gif) O (1703 cm−1), C
O (1703 cm−1), C![[double bond, length as m-dash]](https://www.rsc.org/images/entities/char_e001.gif) C (1645 cm−1), S
C (1645 cm−1), S![[double bond, length as m-dash]](https://www.rsc.org/images/entities/char_e001.gif) O (1188 cm−1) and S–O (1041 cm−1), and C–S (768 and 610 cm−1). Unlike SAF-4, the PSAF-6 dispersant has benzene ring skeleton vibration absorption peaks (1512 and 1476 cm−1), indicating the effective introduction of phenol structural units into the aliphatic molecular chain.36,37 Fig. 2a and d show 1H NMR and 13C CP/MAS NMR spectra of PSAF-6 and SAF-4. According to 1H NMR spectra, proton peaks of –CH2–C– (δ = 1.00–2.68 ppm), –CH2–S– (δ= 2.70–3.02 ppm), –CH2–O– (δ= 3.02–4.40 ppm), –OH (δ = 4.60–6.01 ppm) and CH2
O (1188 cm−1) and S–O (1041 cm−1), and C–S (768 and 610 cm−1). Unlike SAF-4, the PSAF-6 dispersant has benzene ring skeleton vibration absorption peaks (1512 and 1476 cm−1), indicating the effective introduction of phenol structural units into the aliphatic molecular chain.36,37 Fig. 2a and d show 1H NMR and 13C CP/MAS NMR spectra of PSAF-6 and SAF-4. According to 1H NMR spectra, proton peaks of –CH2–C– (δ = 1.00–2.68 ppm), –CH2–S– (δ= 2.70–3.02 ppm), –CH2–O– (δ= 3.02–4.40 ppm), –OH (δ = 4.60–6.01 ppm) and CH2![[double bond, length as m-dash]](https://www.rsc.org/images/entities/char_e001.gif) C– (δ = 4.60–6.01 ppm) are found in both PSAF-6 and SAF-4. Differently, PSAF-6 dispersant contains proton peaks of benzene ring (δ = 6.4–8 ppm). According to 13C CP/MAS NMR spectra, the dispersants of PSAF-6 and SAF-4 contain or –CH2– (δ = 0–61.16 ppm), –CH2–O– (δ = 63.56–84.19 ppm), –C
C– (δ = 4.60–6.01 ppm) are found in both PSAF-6 and SAF-4. Differently, PSAF-6 dispersant contains proton peaks of benzene ring (δ = 6.4–8 ppm). According to 13C CP/MAS NMR spectra, the dispersants of PSAF-6 and SAF-4 contain or –CH2– (δ = 0–61.16 ppm), –CH2–O– (δ = 63.56–84.19 ppm), –C![[double bond, length as m-dash]](https://www.rsc.org/images/entities/char_e001.gif) C– (δ = 110.01–147.05 ppm) and –C
C– (δ = 110.01–147.05 ppm) and –C![[double bond, length as m-dash]](https://www.rsc.org/images/entities/char_e001.gif) O (δ= 191.12–223.36 ppm). Differently, chemical shifts of aromatic ring carbon (δ = 108.81–155.83 ppm) were observed in PSAF-6, indicating that the phenol structural units have been successfully introduced into the aliphatic molecular chain. This is consistent with the results of infrared spectroscopy. However, it is difficult to reveal reaction mechanism and chemical structure of PSAF dispersant based on FT-IR and NMR spectra.
O (δ= 191.12–223.36 ppm). Differently, chemical shifts of aromatic ring carbon (δ = 108.81–155.83 ppm) were observed in PSAF-6, indicating that the phenol structural units have been successfully introduced into the aliphatic molecular chain. This is consistent with the results of infrared spectroscopy. However, it is difficult to reveal reaction mechanism and chemical structure of PSAF dispersant based on FT-IR and NMR spectra.
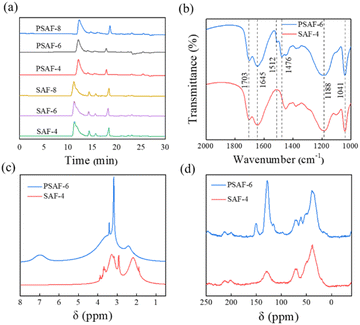 | ||
| Fig. 2 (a) GPC analysis for PSAF-t and SAF-t. (b) FT-IR spectra of PSAF-6 and SAF-4. (c) 1H NMR (D2O) and (d) 13C CP/MAS NMR spectra of PSAF-6 and SAF-4. | ||
Investigation on synthesis mechanism
The mechanism and chemical structure of this aliphatic dispersant have been studied extensively, but it is still difficult to understand them clearly because of its complexity.38 The hydrolysis of sodium sulfite to generate sodium bisulfite, which reacts with formaldehyde to generate HOCH2SO3Na, were widely considered to be the initial reactions of the aliphatic dispersant.39–41 To understand the substitution position of HOCH2SO3Na on the molecular chain of PSAF, the reaction (Fig. 3a) of HOCH2SO3Na with acetone was performed and the product was analyzed by NMR. As shown in Fig. 3b, peaks at 3.76 ppm could be ascribed to the chemical shift of the protons in –C–CH2–SO3Na, while the peak at 2.14 ppm could be assigned to the chemical shift of the protons in CH3–C![[double bond, length as m-dash]](https://www.rsc.org/images/entities/char_e001.gif) O and –C–CH2–C
O and –C–CH2–C![[double bond, length as m-dash]](https://www.rsc.org/images/entities/char_e001.gif) O. These results indicated that the carbon atom of HOCH2SO3Na is easily linked to the α-C atom of acetone under catalysis by OH−. In addition, the peak at 4.36 ppm is caused by the proton of the unreacted HOCH2SO3Na (Fig. S4†). Fig. 3c represents 13C NMR spectra for the reaction product of HOCH2SO3Na and acetone. Peaks between 43.60 and 63.67 ppm could be ascribed to chemical shifts of carbon atoms in –CH2−, while those at 214.72 and 30.18 ppm could be attributed to chemical shifts of carbon atoms in –C
O. These results indicated that the carbon atom of HOCH2SO3Na is easily linked to the α-C atom of acetone under catalysis by OH−. In addition, the peak at 4.36 ppm is caused by the proton of the unreacted HOCH2SO3Na (Fig. S4†). Fig. 3c represents 13C NMR spectra for the reaction product of HOCH2SO3Na and acetone. Peaks between 43.60 and 63.67 ppm could be ascribed to chemical shifts of carbon atoms in –CH2−, while those at 214.72 and 30.18 ppm could be attributed to chemical shifts of carbon atoms in –C![[double bond, length as m-dash]](https://www.rsc.org/images/entities/char_e001.gif) O and –CH3, respectively. These results further support the conclusions from 1H NMR spectroscopy. In addition, the peak at 74.53 ppm is designated as the carbon atom of unreacted HOCH2SO3Na.
O and –CH3, respectively. These results further support the conclusions from 1H NMR spectroscopy. In addition, the peak at 74.53 ppm is designated as the carbon atom of unreacted HOCH2SO3Na.
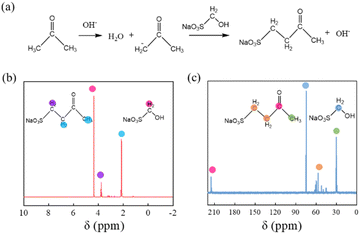 | ||
| Fig. 3 (a) Dehydration reaction of HOCH2SO3Na and acetone in alkaline aqueous solution. (b) 1H NMR and (c) 13C NMR spectra for the product of HOCH2SO3Na and acetone (D2O). | ||
The polymerization of formaldehyde and acetone was performed and the products were analyzed by GPC, FT-IR, and NMR to understand the formation of major molecular chains in detail (Fig. 4a). As shown in Fig. S5,† the reaction product has an MW of 2723 Da, which indicates that formaldehyde and acetone could be polymerized under catalysis by OH−. Fig. S6† presents infrared characteristic peaks of the polymerization product. The peaks at 2930 cm−1 and 2868 cm−1 result from the stretching vibration of C–H, whose bending vibrations appear at 1452 cm−1 and 1379 cm−1. The characteristic peak of O–H appears at 3435 cm−1, while the peaks at 1702 cm−1 and 1095 cm−1 can be assigned to the stretching vibrations of C![[double bond, length as m-dash]](https://www.rsc.org/images/entities/char_e001.gif) O and C–O, respectively. Significantly, the characteristic peak of C
O and C–O, respectively. Significantly, the characteristic peak of C![[double bond, length as m-dash]](https://www.rsc.org/images/entities/char_e001.gif) C appears at 1661 cm−1, indicating that this polymer contains C
C appears at 1661 cm−1, indicating that this polymer contains C![[double bond, length as m-dash]](https://www.rsc.org/images/entities/char_e001.gif) C groups. 1H and 13C NMR analysis were further carried out to verify the chemical structure of this product. As shown in Fig. 4b, peaks from 3.12 to 4.43 ppm could be assigned to proton chemical shifts of –C–CH2–O–. It is worth noting that peaks from 1.58 to 2.94 ppm and from 6.07 to 6.22 ppm are attributed to proton chemical shifts of –C–CH2–C
C groups. 1H and 13C NMR analysis were further carried out to verify the chemical structure of this product. As shown in Fig. 4b, peaks from 3.12 to 4.43 ppm could be assigned to proton chemical shifts of –C–CH2–O–. It is worth noting that peaks from 1.58 to 2.94 ppm and from 6.07 to 6.22 ppm are attributed to proton chemical shifts of –C–CH2–C![[double bond, length as m-dash]](https://www.rsc.org/images/entities/char_e001.gif) O and CH2
O and CH2![[double bond, length as m-dash]](https://www.rsc.org/images/entities/char_e001.gif) C–, respectively. The peaks from 1 to 1.58 ppm could be ascribed to proton chemical shifts of –C–CH2–C–. As shown in the 13C NMR spectrum (Fig. 4c), characteristic carbon peaks of DMF-d7 solvent were observed (162.57, 35.03, and 29.88 ppm). The peak at 199.38 ppm is caused by the carbon atom in –C
C–, respectively. The peaks from 1 to 1.58 ppm could be ascribed to proton chemical shifts of –C–CH2–C–. As shown in the 13C NMR spectrum (Fig. 4c), characteristic carbon peaks of DMF-d7 solvent were observed (162.57, 35.03, and 29.88 ppm). The peak at 199.38 ppm is caused by the carbon atom in –C![[double bond, length as m-dash]](https://www.rsc.org/images/entities/char_e001.gif) O, while those at 148.59 and 124.03 ppm correspond to carbons atom in –C
O, while those at 148.59 and 124.03 ppm correspond to carbons atom in –C![[double bond, length as m-dash]](https://www.rsc.org/images/entities/char_e001.gif) C–. The peaks from 40.03 to 65.01 ppm are ascribed to carbon atoms in –CH2–O–, –CH–C–, and –CH2–C– (linked to the carbonyl group), and the peaks at 25.89 ppm are ascribed to carbon atoms in –CH2–C–. These results correspond perfectly with the 1H NMR analysis.
C–. The peaks from 40.03 to 65.01 ppm are ascribed to carbon atoms in –CH2–O–, –CH–C–, and –CH2–C– (linked to the carbonyl group), and the peaks at 25.89 ppm are ascribed to carbon atoms in –CH2–C–. These results correspond perfectly with the 1H NMR analysis.
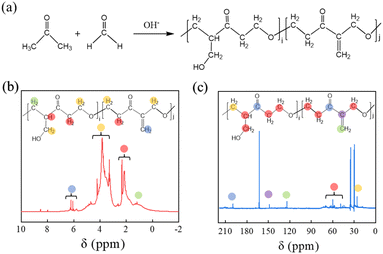 | ||
| Fig. 4 (a) Reaction of formaldehyde and acetone in alkaline aqueous solution. (b) 1H NMR and (c) 13C NMR spectra for the product of formaldehyde and acetone (DMF-d7). | ||
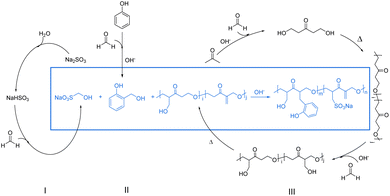
Based on the above analysis, a possible synthesis mechanism of the PSAF dispersant is proposed (Fig. 5). As described in Synthesis of dispersants, the synthesis of PSAF dispersant includes three main stages. Two reactions occur in the first stage: the addition of formaldehyde to sodium bisulfite derived from sodium sulfite to generate HOCH2SO3Na (i) and the addition reaction of formaldehyde with phenol (ii).42 In the second stage, formaldehyde and acetone begin to polymerize based on aldol condensation and a Michael addition reaction mechanism (iii).43,44 In the final stage, the addition product of phenol and sodium bisulfite reacts with the α-C in a prepolymer of formaldehyde and acetone42 to generate a new C–C bond. At the same time, this prepolymer will further polymerize with formaldehyde and acetone to form the final dispersant.
Rheological behavior of CWS
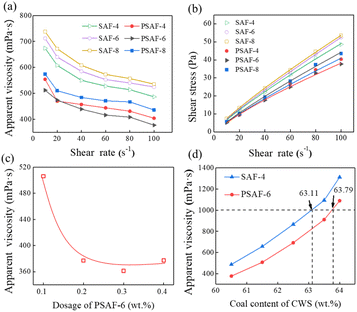
The viscosity-reducing capacities of PSAF-t dispersants compared to those of conventional SAF-t dispersants were evaluated. The relationship between the apparent viscosity and shear rate of CWS with 60.5 wt% solid content and 0.2 wt% dispersants of coal is shown in Fig. 6a. The CWS behaves as a non-Newtonian fluid with shear thinning. Apparently, PSAF-t dispersants have a better viscosity reduction effect than SAF-t dispersants and the apparent viscosity increases in the order PSAF-6 < PSAF-4 < PSAF-8 < SAF-4 < SAF-6 < SAF-8 at a shear rate of 100 s−1. The rheological data for CWS were fitted by the Herschel–Bulkley model (τ = τy + K × rn), in which τ, τy, K, r, and n represent the shear stress (Pa), yield stress (Pa), consistency coefficient (Pa sn), shear rate (s−1), and rheological index, respectively.As shown in Fig. 6b, the shear stress increased linearly with increasing shear rate for all the slurries, and the rheological index, n, was less than 1, indicating again the non-Newtonian pseudoplastic behaviors of CWS (Table S2†). Moreover, the τy of CWS with PSAF-6 (−1.62 Pa) was lower than all the others.45,46 The smaller yield stress indicated higher redispersion ability.28 Fig. 6c gives the effect of dosage for the best PSAF-6 dispersant on the apparent viscosity of CWS which was investigated with 60.5 wt% solid content at a shear rate of 100 s−1. The apparent viscosity of CWS decreases from 506 mPa s (0.1 wt%) to 377 mPa s (0.2 wt%); then, it is stable with an increase in dosage of dispersant. At low dosage, the dispersant on the surface of coal particles does not reach adsorption saturation, so it shows a limited viscosity reduction effect.47 The adsorption on the coal surface reached saturation when the dosage was raised to 0.2 wt%; then, the viscosity reduction effect underwent almost no enhancement with a further increase in the dosage. Fig. 6d shows the effect of slurry concentration on the apparent viscosity of CWS with PSAF-6 and SAF-4 dispersants with 0.2 wt% dispersants of coal at a shear rate of 100 s−1. The apparent viscosity of CWS increases as the coal concentration increases and the corresponding coal concentrations reached 63.79 wt% (PSAF-6) and 63.11 wt% (SAF-4) under an apparent viscosity of 1000 mPa s, respectively.
Adsorption investigation of dispersants on the coal surface
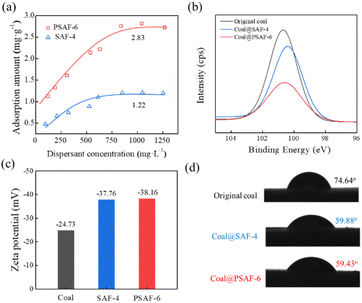
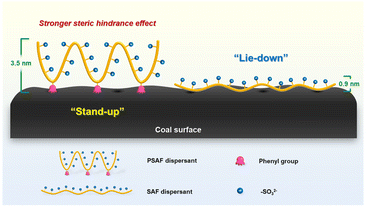
To understand the mechanism of better dispersion performance of PSAF compared with SAF dispersants, their adsorption behavior, electrostatic repulsion and wettability on the coal surface were investigated. Fig. 7a depicts the adsorption capacity of dispersants on the coal surface vs. equilibrium dispersant concentration at 20 °C. This phenomenon showed that the adsorption quantity increased considerably with the increase in dispersant concentration at the beginning and then attained a plateau. The adsorption curves were fitted by the Langmuir adsorption and Freundlich adsorption models, and the fitting results are shown in Table S3.† The correlation coefficients (R2) of the Langmuir equation (0.981) for the dispersants were both larger than those of the Freundlich equation (0.967 or 0.978). This shows that the Langmuir adsorption model can properly describe the adsorption of dispersant on the surface of coal particles and shows the characteristics of monolayer adsorption. The saturated adsorption capacity of SAF-4 on the coal surface is 1.47 mg g−1, lower than that of PSAF-6 on the coal surface of 3.50 mg g−1. X-ray photoelectron spectroscopy (XPS) was used to evaluate the adsorption layer thickness of dispersants on the coal surface. Si was selected as the characteristic element because of its existence in coal but not in the dispersants. The XPS spectra and Si2p spectra of coal particles with and without dispersants are shown in Fig. S7 and 7b,† respectively. The adsorption layer thickness can be appraised through the attenuation value of an Si2p photoelectron passing through the dispersant adsorption layer. The result in Table S4† indicated larger adsorption layer thickness for PSAF-6 (3.5 nm) than SAF-4 (0.9 nm), which is consistent with the results of the adsorption capacity, indicating that the steric effect of PSAF-6 adsorbed on the surface of coal particles is stronger.According to the DLVO theory, electrostatic repulsion is significant in the dispersion and stabilization of CWS.48 As shown in Fig. 7c, zeta potentials of coal particles in CWS without a dispersant was approximately −24.73 mV. This indicated that the surface coal particles were negatively charged due to the existence of oxygenic groups, which would be ionized in aqueous environments.49,50 As expected, the zeta potentials of coal particles shifted to more negative values in the presence of PSAF-6 and SAF-4 (−38.16 and −37.76 mV) because of the dispersant absorption on coal particles.28 However, although the adsorption capacities of PSAF-6 and SAF-4 on the surface of coal particles are different, they give comparable zeta potential and electrostatic repulsion. Previous studies have shown that the wettability of a dispersant on the surface of coal particles is a key factor affecting the concentration of coal–water slurry.51 The contact angles of water on coal or coal-adsorbed dispersant surfaces were measured to indicate the changes in surface hydrophobicity or hydrophilicity. As shown in Fig. 7d, the contact angles of coal, coal@SAF-4, and coal@PSAF-6 were 74.64°, 59.88°, and 59.43°, respectively. This result indicates that SAF-4 and PSAF-6 present comparable wettability of the coal surface. This phenomenon can be explained by their similar chemical functional groups and hydrophilicity.
Dispersive mechanism
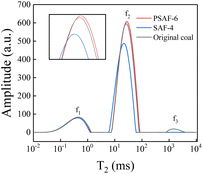
Low-field nuclear magnetic resonance technology was used to analyze the water status in CWS, which helps to explain the rheological properties according to a microscopic mechanism. T2 reflects the chemical environment of the proton in the sample, which is related to the binding force of the proton and its degree of freedom. Thus, T2 becomes shorter with an increase in the binding degree of the proton or a decrease in the degrees of freedom.52,53 As shown in Fig. 8, there are three water states in CWS: T2 = 0.01–2 ms representing adsorbed water, T2 = 5–100 ms representing interstitial water, and T2 = 500–5000 ms representing free water. The areas of the peaks are a measure of the amount of water in different states and results are shown in Table S5.† The free water content of CWS prepared with dispersants is obviously lower than that of CWS prepared without a dispersant. From this phenomenon it is revealed that the dispersant improves the hydrophilicity of the coal surface, and the free water is adsorbed by the composite particles (coal particle adsorbed dispersant), which is transformed into adsorbed or interstitial water.54 Compared with CWS prepared with SAF-4 dispersant, the adsorbed water content of CWS prepared with PSAF-6 is lower and the interstitial water is higher. This phenomenon may be caused by the stronger adsorption of PSAF-6 on the coal surface, which blocks the channel from interstitial water to adsorbed water.54,55Given the structural characteristics and the above experimental results for PSAF dispersants during CWS preparation, the possible interactions between coal particles, dispersants, and water can be inferred. Fig. 9 shows a schematic of the internal structure for CWS prepared with PSAF dispersants, which is significantly different from that of SAF dispersants. PSAF dispersants displayed similar wettability and electronegativity to SAF, which was verified by research on contact angle and zeta potential experiments. The difference is that the adsorption capacity and thickness of PSAF on the coal surface are significantly greater than that of SAF, leading to a stronger steric hindrance effect. From a microscopic perspective, aromatic rings and aliphatic groups in the molecular chain of the PSAF dispersant compete for adsorption, interacting with the aromatic hydrophobic regions and hydrophilic sites (carboxyl, hydroxyl, amino, etc.) of the coal surface. The PSAF dispersant undergoes stand-up adsorption rather than the horizontal adsorption of SAF due to strong π–π action. This stand-up adsorption behavior leads to a change in water status and a steric hindrance effect, seriously affecting the CWS performance.
Synthesis of x-PSAF-6 dispersants and their dispersive performance
Given that coal tar creosote is a cost-effective phenol source, o-cresol, 3,5-dimethylphenol, mixed phenol, and coal tar creosote were used to replace phenol to synthesize a series of x-PSAF-6 dispersants. As shown in Table S6 and Fig. S8,† x-PSAF-6 dispersants show similar molecular weight (ca. 12![[thin space (1/6-em)]](https://www.rsc.org/images/entities/char_2009.gif) 000–17
000–17![[thin space (1/6-em)]](https://www.rsc.org/images/entities/char_2009.gif) 000 Da) to PSAF-6 but lower than that of SAF-4. Fig. 10a shows the apparent viscosity vs. shear rate of CWS with 0.2 wt% dispersant (based on coal weight) and 60.5 wt% coal particles. The apparent viscosity of CWS with x-PSAF-6 and SAF-4 dispersants decreased dramatically and then gently with an increase in shear rate (shear thinning behavior), which indicated that CWS prepared by these dispersants were pseudoplastic fluids. Notably, the x-PSAF-6 dispersants give a better viscosity reduction effect than that of the SAF-4 dispersant at a shear rate of 100 s−1. Fig. 10b gives the relationship between the apparent viscosity of CWS and the solid concentration. The maximum slurry concentration was the concentration at which the apparent viscosity of the CWS reached 1000 mPa s. The maximum slurry concentration of CWS prepared with c-PSAF-6 (63.84 wt%) was, as expected, higher than that of SAF-4 dispersant (63.57 wt%). These results show that the cost of PSAF dispersants can be reduced by using cheaper coal tar creosote instead of phenol. Additionally, a comparison of CWS water separating ratio prepared from x-PSAF-6 and SAF-4 dispersants within 24 h is shown in Fig. S9.† In general, the CWS prepared from x-PSAF-6 dispersants show lower water separating ratio than that from SAF-4 for Yulin coal.
000 Da) to PSAF-6 but lower than that of SAF-4. Fig. 10a shows the apparent viscosity vs. shear rate of CWS with 0.2 wt% dispersant (based on coal weight) and 60.5 wt% coal particles. The apparent viscosity of CWS with x-PSAF-6 and SAF-4 dispersants decreased dramatically and then gently with an increase in shear rate (shear thinning behavior), which indicated that CWS prepared by these dispersants were pseudoplastic fluids. Notably, the x-PSAF-6 dispersants give a better viscosity reduction effect than that of the SAF-4 dispersant at a shear rate of 100 s−1. Fig. 10b gives the relationship between the apparent viscosity of CWS and the solid concentration. The maximum slurry concentration was the concentration at which the apparent viscosity of the CWS reached 1000 mPa s. The maximum slurry concentration of CWS prepared with c-PSAF-6 (63.84 wt%) was, as expected, higher than that of SAF-4 dispersant (63.57 wt%). These results show that the cost of PSAF dispersants can be reduced by using cheaper coal tar creosote instead of phenol. Additionally, a comparison of CWS water separating ratio prepared from x-PSAF-6 and SAF-4 dispersants within 24 h is shown in Fig. S9.† In general, the CWS prepared from x-PSAF-6 dispersants show lower water separating ratio than that from SAF-4 for Yulin coal.
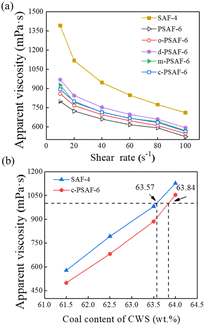 | ||
| Fig. 10 (a) Effect of shear rate on the apparent viscosity of CWS. (b) The effect of coal content on the apparent viscosity of CWS. | ||
Conclusions
Dispersants can greatly enhance the rheological characteristics and stability of CWS. Typically, linear dispersants play an important role in the preparation of CWS due to their low cost and easy synthesis. However, due to the lack of steric hindrance action, this type of dispersant performs insufficiently well. In this study, phenolic groups were added to the aliphatic main chain to create a novel linear dispersant (PSAF) with a high steric hindrance effect. The structure, synthesis mechanism, rheological behaviors, and dispersing mechanism of PSAF dispersants for CWS were investigated using various technologies. The PSAF dispersant undergoes stand-up adsorption instead of lie-down adsorption, which leads to a stronger steric hindrance effect and better rheological performance. This dispersant can also be prepared using coal tar creosote as the phenol, giving it good industrial application prospects. This work can provide guidelines for a high-performance dispersant for CWS.Author contributions
Wenlin Shuai: investigation, methodology, data curation, writing-review & editing; Shiwei Wang: investigation, methodology, writing-original draft, writing-review & editing, supervision; Taotao Sun: data curation, software; Hongfeng Yin: supervision, project administration; Yu Zu: conceptualization, project administration, funding acquisition; Gang Yao: resources, validation; Zhonghua Li: resources, validation; Zhaokun Qi: resources, validation; Mei Zhong: supervision, writing-review & editing, funding acquisition.Conflicts of interest
There are no conflicts to declare.Acknowledgements
This work is partly supported by the National Science Foundation of China (Grant No. 22072171 and 21902169), Outstanding Youth Fund of Xinjiang Uygur Autonomous Region (Grant No. 2020Q001), and the Postdoctoral Science Preferential Funding of Zhejiang Province, China (Grant No. ZJ2020005).References
- Q. Yi, W. Li, J. Feng and K. Xie, Chem. Soc. Rev., 2015, 44, 5409 RSC.
- Y. Shen, X. Liu, T. Sun and J. Jia, RSC Adv., 2012, 2, 8867 RSC.
- S. Hu, L. Liu, X. Yang, J. Li, B. Zhou, C. Wu, L. Weng and K. Liu, RSC Adv., 2019, 9, 32911 RSC.
- E. Xu, S. Chen, Y. Dong, Z. Miao, X. Jiang, L. Cui, X. Meng and G. Wu, Fuel, 2021, 292, 120394 CrossRef.
- Z. Meng, Z. Yang, Z. Yin, Y. Li, X. Song, J. Zhao and W. Wu, Powder Technol., 2020, 359, 261 CrossRef.
- D. Yao, H. Zhao, Z. Chen and H. Liu, Fuel, 2022, 317, 123461 CrossRef.
- Y. Zhang, S. Hu, X. Yang, F. Jiang, C. Wu, J. Li and K. Liu, Colloids Surf., A, 2021, 630, 127544 CrossRef.
- S. K. Mishra, P. K. Senapati and D. Panda, Energy Sources, 2010, 24, 159 CrossRef.
- D. Yang, X. Qiu, M. Zhou and H. Lou, Energy Convers. Manage., 2007, 48, 2433 CrossRef CAS.
- X. Qiu, M. Zhou, D. Yang, H. Lou, X. Ouyang and Y. Pang, Fuel, 2007, 86, 1439 CrossRef CAS.
- F. Boylu, H. Dinçer and G. Ateşok, Fuel Process. Technol., 2004, 85, 241 CrossRef CAS.
- W. Yuchi, B. Li, W. Li and H. Chen, Coal Prep., 2005, 25, 239 CrossRef.
- G. Zhang, J. Li, J. Zhu, Q. Qu and W. Xiong, Powder Technol., 2014, 254, 572 CrossRef CAS.
- J.-H. Park, Y.-J. Lee, M.-H. Jin, S.-J. Park, D.-W. Lee, J.-S. Bae, J.-G. Kim, K. H. Song and Y.-C. Choi, Fuel, 2017, 203, 607 CrossRef CAS.
- P. Liu, M. Zhu, Z. Zhang, Y.-K. Leong, Y. Zhang and D. Zhang, Fuel Process. Technol., 2017, 156, 27 CrossRef CAS.
- D. Das, S. K. Das, P. K. Parhi, A. K. Dan, S. Mishra and P. K. Misra, Energy Nexus, 2021, 4, 100025 CrossRef.
- U. Behera, S. K. Das, D. P. Mishra, P. K. Parhi and D. Das, ACS Omega, 2021, 6, 22820–22830 CrossRef CAS PubMed.
- R. Xu, W. Zhuang, Q. He, J. Cai, B. Hu and J. Shen, AIChE J., 2009, 55, 2461 CrossRef.
- M. Zhou, X. Qiu, D. Yang and X. Ouyang, J. Dispersion Sci. Technol., 2009, 30, 353 CrossRef.
- K. Zhang, X. Zhang, L. e. Jin, Q. Cao and P. Li, Fuel, 2017, 200, 458 CrossRef.
- A. Kumar Dan, B. Biswal, M. Das, S. Parida, P. Kumar Parhi and D. Das, J. Mol. Liq., 2022, 360, 119547 CrossRef.
- S. K. Das, A. K. Dan, U. Behera, A. K. Tripathi, M. Behari, D. Das and P. K. Parhi, Case Stud. Chem. Environ. Eng., 2021, 4, 100156 CrossRef.
- M. Behari, A. M. Mohanty and D. Das, Powder Technol., 2022, 407, 117620 CrossRef CAS.
- S. Hu, F. Jiang, J. Li, C. Wu, K. Liu and Y. Chen, Colloids Surf., A, 2021, 628, 127245 CrossRef CAS.
- L. Li, L. Zhao, Y. Wang, J. Wu, G. Meng, Z. Liu, J. Zhang, B. Hu, Q. He and X. Guo, Energy Fuels, 2018, 32, 8310 CrossRef CAS.
- S. Hu, Y. Chen, C. Wu, J. Li and K. Liu, Colloids Surf., A, 2020, 606, 125450 CrossRef CAS.
- X. Meng, T. Zhang, G. Wu, R. Chu, L. Fan, X. Jiang, Y. Li, W. Zhang, Y. Wan, W. Li and X. Li, Colloids Surf., A, 2022, 643, 128812 CrossRef CAS.
- K. Zhang, J. Ma, B. Lyu, G. Shi, B. Zhou and Y. Tian, Fuel, 2020, 274, 117860 CrossRef CAS.
- L. Li, C. Ma, S. Hu, M. He, H. Yu, Q. Wang, X. Cao and X. You, Int. J. Min. Sci. Technol., 2021, 31, 515 CrossRef CAS.
- W. Zhang, J. Luo, Y. Huang, C. Zhang, L. Du, J. Guo, J. Wu, X. Zhang, J. Zhu and G. Zhang, Fuel, 2020, 262, 116576 CrossRef CAS.
- T. Zhu, J. Dong, L. Niu, G. Chen, L. Ricardez-Sandoval, X. Wen and G. Bai, Appl. Clay Sci., 2021, 203, 106003 CrossRef.
- C. Chen, D. Jin, X. Ouyang, L. Zhao, X. Qiu and F. Wang, Fuel, 2018, 223, 366 CrossRef.
- J. Zhu, P. Wang, Y. Li, J. Li and G. Zhang, Fuel, 2017, 190, 221 CrossRef.
- H. Bouhamed, A. Magnin and S. Boufi, J. Colloid Interface Sci., 2006, 298, 238 CrossRef PubMed.
- R. Li, D. Yang, H. Lou, M. Zhou and X. Qiu, Energy Convers. Manage., 2012, 64, 139 CrossRef.
- Z. Pu, X. Fan, J. Su, M. Zhu and Z. Jiang, Colloid Polym. Sci., 2022, 300, 167 CrossRef CAS.
- N. Hong, Y. Li, W. Zeng, M. Zhang, X. Peng and X. Qiu, RSC Adv., 2015, 5, 21588 RSC.
- H. D. Yan, Y. F. Wang and Z. L. Quan, Adv. Mater. Res., 2012, 554–556, 878 CAS.
- L. M. Carvalho and G. Schwedt, J. Chromatogr. A, 2005, 1099, 185 CrossRef PubMed.
- V. Ramdugwar, H. Fernandes and P. Gadekar, Int. J. Adhes. Adhes., 2022, 115, 103122 CrossRef CAS.
- N. A. Costa, J. Pereira, J. Ferra, P. Cruz, J. Martins, F. D. Magalhães, A. Mendes and L. H. Carvalho, Wood Sci. Technol., 2013, 47, 1261 CrossRef CAS.
- C. Liu, H. Cao, S. Jin, Y. Bao, Q. Cheng and Z. Rao, Sol. Energy Mater. Sol. Cells, 2022, 243, 111789 CrossRef CAS.
- A. Axelsson, E. Hammarvid, M. Rahm and H. Sundén, Eur. J. Org. Chem., 2020, 5436 CrossRef CAS.
- M. Ai, J. Catal., 1987, 106, 273 CrossRef CAS.
- C. Qian, L. Zhao, X. Ge and X. Chen, Chin. J. Chem. Eng., 2020, 28, 566 CrossRef CAS.
- J. Huang, J. Xu, D. Wang, L. Li and X. Guo, Ind. Eng. Chem. Res., 2013, 52, 8427 CrossRef CAS.
- L. Du, G. Zhang, D. Yang, J. Luo, Y. Liu, W. Zhang, C. Zhang, J. Li and J. Zhu, R. Soc. Open Sci., 2021, 8, 201480 CrossRef CAS.
- K. Zhang, Y. Hou, Z. Ye, T. Wang, X. Zhang and C. Wang, Fuel, 2022, 318, 123608 CrossRef CAS.
- M. K. R. Konduri and P. Fatehi, Fuel Process. Technol., 2018, 176, 267 CrossRef.
- Y. Qin, D. Yang, W. Guo and X. Qiu, J. Ind. Eng. Chem., 2015, 27, 192 CrossRef.
- X. Jiang, S. Chen, L. Cui, E. Xu, H. Chen, X. Meng and G. Wu, J. Cleaner Prod., 2022, 330, 129881 CrossRef.
- C. Wang, H. Zhao, Z. Dai, W. Li and H. Liu, Fuel, 2019, 235, 639 CrossRef.
- J. Zhang, H. Zhao, C. Wang, W. Li, J. Xu and H. Liu, Fuel, 2016, 177, 19 CrossRef.
- J. Liu, R. Wang, Y. Hu, J. Zhou and K. Cen, Energy Fuels, 2013, 27, 2883 CrossRef CAS.
- S. Hu, F. Jiang, B. Zhao, Y. Chen, C. Wu, J. Li and K. Liu, Energy Fuels, 2021, 35, 2006 CrossRef CAS.
Footnote |
| † Electronic supplementary information (ESI) available. See DOI: https://doi.org/10.1039/d2ra05802b |
| This journal is © The Royal Society of Chemistry 2022 |

