 Open Access Article
Effect of DMSO on the catalytical production of 2,5-bis(hydoxymethyl)furan from 5-hydroxymethylfurfural over Ni/SiO2 catalysts†
Houman
Ojagh
a,
Abdenour
Achour
a,
Phuoc Hoang
Ho
a,
Diana
Bernin
 a,
Derek
Creaser
a,
Oleg
Pajalic
a,
Derek
Creaser
a,
Oleg
Pajalic
 b,
Johan
Holmberg
b and
Louise
Olsson
 *a
*a
aCompetence Center for Catalysis, Chemical Engineering, Chalmers University of Technology, SE 412 96, Gothenburg, Sweden. E-mail: louise.olsson@chalmers.se
bPerstorp AB, Industriparken, 284 80 Perstorp, Sweden
First published on 13th October 2021
Abstract
Hydroconversion of 5-hydroxymethylfurfural (HMF) to 2,5-bis(hydoxymethyl)furan (BHMF) was studied over mono- and bimetallic supported catalysts. It was found that monometallic Ni/SiO2 catalysts exhibited superior performance with a total yield of BHMF of up to 99 wt%. This excellent performance may be attributed to higher Ni dispersion and low acidity of the support. Dimethyl sulfoxide (DMSO) is often present in HMF, due to the route used for its synthesis. DMSO adsorption caused a clear reduction of Ni/SiO2 performance for the HMF hydrodeoxygenation reaction. Characterization of the spent catalysts was performed using HAADF-STEM-EDX, Raman, ICP, and XPS spectroscopies, and showed the presence of sulfur and graphitic carbon, which could explain the deactivation.
Introduction
The utilization of renewable resources and development of effective processes for their conversion are critical future developments for the chemical industry.1,2 5-Hydroxymethylfurfural (HMF), produced from dehydration of cellulose and hexoses,3–6 is a renewable platform candidate for achieving significant production of high value-added intermediates such as 2,5-bis(hydroxymethyl)furan (BHMF), 2,5-dimethylfuran (DMF), 5-methyl-2-furanmethanol (MFM),7–9 1,6-hexanediol (HDO), tetrahydrofuran-2,5-dimethanol (THFDM),10,11 and caprolactone.12,13 Despite its potentially versatile application, HMF production has some economic challenges, such as raw materials availability and cost.14Besides the effectiveness of the catalyst for achieving higher yield and selectivity, this process also requires separation and purification of the HMF from high boiling solvents such as DMSO, by-products, and unreacted fructose.15–17 However, efficient separation is costly. If there are residues of the solvent DMSO after separation, it may affect the activity and stability of the metal catalysts used for the downstream processing of HMF.18,19
Among these promising intermediates, the BHMF molecule can be formed by selective hydrogenation of the C![[double bond, length as m-dash]](https://www.rsc.org/images/entities/char_e001.gif) O bond in HMF. Consequently, BHMF may also contribute to the development of hydrodeoxygenation processes to produce other platform chemicals.19,20 Different by-products can be obtained due to over hydrogenation which is considered as the key challenge to control the selectivity of this process. To address this issue, heterogeneous catalysts have received considerable attention. In this light, the efficiency of several noble metals (including Pt, Pd, Ru and Rh) for the catalytical production of BHMF has been demonstrated.21,22 Recently, HMF was hydrogenated to BHMF with complete conversion and 98.9% selectivity using a Pt/MCM-41 catalyst in an aqueous medium.21 It was also reported that HMF was converted to BHMF in water over Au sub-nano clusters supported on γ-Al2O3 with 96% yield being achieved at 120 °C in 2 h under an initial H2 pressure of 65 bar.23 A higher selectivity of 99% of BHMF was obtained using an Ir–ReOx catalyst in water.24
O bond in HMF. Consequently, BHMF may also contribute to the development of hydrodeoxygenation processes to produce other platform chemicals.19,20 Different by-products can be obtained due to over hydrogenation which is considered as the key challenge to control the selectivity of this process. To address this issue, heterogeneous catalysts have received considerable attention. In this light, the efficiency of several noble metals (including Pt, Pd, Ru and Rh) for the catalytical production of BHMF has been demonstrated.21,22 Recently, HMF was hydrogenated to BHMF with complete conversion and 98.9% selectivity using a Pt/MCM-41 catalyst in an aqueous medium.21 It was also reported that HMF was converted to BHMF in water over Au sub-nano clusters supported on γ-Al2O3 with 96% yield being achieved at 120 °C in 2 h under an initial H2 pressure of 65 bar.23 A higher selectivity of 99% of BHMF was obtained using an Ir–ReOx catalyst in water.24
Previous studies indicate that the metal species strongly affects the selectivity of the products, while the nature of the support influenced significantly the activity of the catalysts.22 The metal species effect and control of the products distribution on various supports were investigated by Cai et al.22 The results showed that the Pd/γ-Al2O3 and Pd/SiO2 did not enhance the catalytic activity of BHMF compared to Pd/TiO2 and Pd/C. However, the yield of THFDM was higher for Pd/γ-Al2O3 and Pd/SiO2 than those of Pd/C and Pd/TiO2, indicating that the product selectivity is sensitive to the choice of support. By selecting the proper metal species and support, BHMF selectivity was further enhanced to 95.4% over Ir/TiO2 catalyst, indicating that the metal catalyst exhibits the potential for selectively hydrogenating the carbonyl group while leaving the C![[double bond, length as m-dash]](https://www.rsc.org/images/entities/char_e001.gif) C bond unchanged to form BHMF.22
C bond unchanged to form BHMF.22
Non-noble metal catalysts have been examined and constitute an attractive solution in terms of their abundance, good stability and high cost-effectiveness. Efficient hydrogenation of HMF into BHMF was performed using a Cu/SiO2 catalyst, obtaining as high as 97% BHMF yield.25 It was also reported that 94.8% of BHMF selectivity and 97.5% conversion were obtained over a CuO–Fe3O4/AC bimetallic nanocatalyst supported on activated carbon at 150 °C for 5 h.26 Zhang et al. showed that Ni catalysts were effective for the hydrogenation of HMF. A high yield of BHMF was obtained at 160 °C for 24 h, with a selectivity of 94% with HMF conversion of 93.6% using 10% Ni/hydrothermal carbon.27 More recently, Yu et al. disclosed that Ni–Fe/CNTs bimetallic catalysts in carbon nanotubes were active and totally converted HMF, with a selectivity to BHMF of 96.4% at 120 °C for 3 h.28
Recently, Luo et al.29,30 highlighted the importance of using a flow reactor to show the initial hydrogenation of HMF using 1-propanol. By varying the space time in the reactor, HMF reacted first to furfuryl ethers and other partially hydrogenated products, which then formed DMF with different selectivity depending on the metal catalyst.29,30 It is important to note that these reactions are applicable to specific solvents. Various alcohol solvent effects were studied and it was shown that BHMF can be etherified to 2,5-bis(alkoxymethyl)furans (BAMFS) through simple addition of a proton donor.25,31–33
We start this study by comparing different noble and non-noble metal catalysts. We found Ni/SiO2 to be the most selective catalyst and in addition at lower costs than the noble metal catalysts. We therefore continued the studies using this catalyst, examining the effect of metal content. Moreover, HMF contains some residuals of DMSO solvent, which due to its sulfur content can result in catalyst deactivation.17,18 However, to the best of our knowledge, there are no available studies where the effect of DMSO has been disclosed for the catalytic activity of HMF hydrogenation. In this work we therefore examine the effect of DMSO on the selective hydrogenation of HMF to BHMF over Ni/SiO2 using both high pressure reactor experiments as well as catalyst characterization in order to study the poisoning effect.
Experimental
Materials
HMF (≥99% purity), DMF (≥98% purity), DMSO (≥99.5% purity), THFDM (98% purity), n-butanol (99% purity) were purchased from Sigma Aldrich. BHFDM (≥98% purity) was procured from BIOSYNTH Carbosynth. γ-Al2O3 (Puralox SCCa 150/200, Sasol), SiO2 (>99.0%, catalyst support, Alfa Aesar), Amorphous SiO2–Al2O3 (Sigma Aldrich, grade 135), Ni(NO3)2·6H2O (99.99%, Sigma Aldrich), Co(NO3)2·6H2O (99.99%, Sigma Aldrich), Ru(NO)(NO3)3 (1.8% Ru solution, Strem Chemicals), and Pd(NO3)2 (quality level 100, Sigma Aldrich) were used to prepare the catalysts for HMF hydrogenation. A commercial catalyst Pd/C (5 wt% Pd loading, Sigma Aldrich) was compared to catalysts prepared. Further analysis of HMF as received from the supplier, using ICP analysis (ALS Scandinavia AB, Luleå, Sweden) revealed that it contained 0.5 wt% DMSO.Catalyst synthesis
Metal-loaded catalysts were synthesized by an incipient wetness impregnation route. Firstly, γ-Al2O3, SiO2, alumina–silica (Al–Si) supports were calcined in air at 550 °C for 4 h. The SiO2 pellets were ground and sieved to a particle size ≤250 μm. Then, the calcined supports were impregnated with aqueous solutions of Ni(NO3)2·6H2O, Co(NO3)2·6H2O, Ru(NO)(NO3)3, Pd(NO3)2 and Pt(NO3)2. The impregnated catalysts were dried at 110 °C overnight. The Pd/C catalyst was purchased from Sigma Aldrich. The amounts of active metals, and supports are summarized in Table 1.| Catalysts | Metal loading, wt% | Support, wt% | Notation | ||||||
|---|---|---|---|---|---|---|---|---|---|
| Ni | Pd | Co | Ru | Al2O3 | SiO2 | Al–Si | C | ||
| Ni/SiO2 | 5 | — | — | — | — | 95 | — | — | 5Ni/SiO2 |
| 10 | 90 | 10Ni/SiO2 | |||||||
| 15 | 85 | 15Ni/SiO2 | |||||||
| Ni/Al2O3 | 20 | — | — | — | 80 | — | — | — | 20Ni/Al2O3 |
| Ni–Pd/SiO2 | 8 | 2 | — | — | — | 90 | — | — | 8Ni–2Pd/SiO2 |
| Ni–Pd/Al2O3 | 15 | 2 | — | — | — | 83 | — | — | 15Ni–2Pd/Al2O3 |
| Ni–Pd/Al–Si | 15 | 2 | — | — | — | — | 83 | — | 15Ni–2Pd/Al–Si |
| Ni–Co/Al2O3 | 5 | — | 5 | — | 90 | — | — | — | 5Ni–5Co/Al2O3 |
| Ru/Al2O3 | — | — | — | 2 | 98 | — | — | — | 2Ru/Al2O3 |
| Pd/C | — | 5 | — | — | — | — | — | 95 | 5Pd/C |
Hydrogenation reactions
Hydrogenation of HMF was carried out in a 450 mL autoclave supplied by Parr Instruments Co. USA. Prior to hydrogenation reactions, 1 g of each catalyst was reduced with 25 bar H2 at 450 °C for 6 h. Then, the reduced catalyst was passivated under 2% O2/Ar at a flowrate of 25 ml min−1 for 1 h at room temperature. In a typical experiment, a mixture of 1 g reduced catalyst, and 5 g HMF dissolved in 80 g of n-butanol were loaded into the reactor. After sealing the reactor, it was subsequently flushed 3–5 times with nitrogen to expel the air and then purged with hydrogen three times. After leak testing, the reactor was pressurized and heated up to a designated temperature. The time zero and stirring at 700 rpm were set once the desired reaction temperature and pressure were reached.The prepared monometallic and bimetallic catalysts (Table 1) were screened by experiments at 130 °C and 40 bar H2 for 6 h. Subsequently, the most selective of these catalysts was further investigated with different metal loadings at 180 °C and 75 bar for 6 h. Under similar conditions, the effect of DMSO was examined for HMF hydrogenation over the 15Ni/SiO2 catalyst using a series of DMSO concentrations (0.08 g, 0.16 g and 0.4 g DMSO). Note that the first point (0.025 g) is the HMF as received, since it contains 0.5 wt% of DMSO. Samples were collected every 1 h during reaction, and the final sample was taken directly just before cooling the reactor to room temperature. Afterward, the catalysts were separated from the reaction mixture using a PTFE membrane filter, then washed and stored under ethanol.
Catalyst characterization
The textural properties of silica supported Ni catalysts such as specific surface area, pore volume, and pore size were measured by N2-physisorption using a TriStar 3000 gas adsorption analyzer. Prior to N2-physisorption, 300 mg of samples were degassed under vacuum at 250 °C for 4 h. After drying, the N2-physisorption isotherms were collected at −195 °C under a reduced pressure. The specific surface area was calculated by the Brunauer–Emmett–Teller equation (BET) and the pore size was calculated by the Barrett–Joyner–Halenda equation (BJH) from the desorption isotherm. The crystallinity of the catalysts was characterized by powder X-ray diffraction (XRD), which was measured with a diffractometer (Bruker D8 Advance) operating at 40 kV and 40 mA using Cu Kα radiation (λ = 1542 Å) with the 2θ range of 15–70° and the scan speed of 1° min−1.The size and dispersion of Ni particles on the silica support were determined by CO chemisorption using an ASAP2020 Plus instrument (Micromeritics). The measurements were performed on the as-prepared materials. Approximately 100 mg of the sample was degassed in He, evacuated in vacuum at 110 °C and reduced in H2 at 450 °C for 4 h.
The sample was then flushed and cooled to 35 °C in He. After that, sample was evacuated to vacuum before conducting the first total isotherm in the pressure range from 100 to 600 mmHg (intervals of 25 mmHg). When the first isotherm was completed, the sample was evacuated to remove physically adsorbed CO before the second isotherm was repeated in the same way as the first measurement. The difference between the two isotherms provides the chemisorbed CO. The intercept of a linear regression curve fit from the isotherm of chemisorbed CO was assigned to the amount of adsorbed CO on a monolayer of the metal surface. The dispersion was determined using eqn (1):
 | (1) |
 | (2) |
X-ray photoelectron spectroscopy (XPS) measurements were done to investigate the chemical state of the Ni phase of the catalysts using a PHI 5000 Versa Probe III-Scanning XPS Microprobe™ system. Samples were placed on carbon rubber pads situated on a sample holder. The XPS spectra were collected using a monochromatic Al Kα source with a binding energy of 1486.6 eV. Sample charge neutralization was done on all samples. The C 1s contamination line with a binding energy of 284.6 eV was taken as a reference for all obtained spectra. The Ni 2p core level spectrum includes Ni 2p1/2, Ni 2p3/2, and shakeup satellites were deconvoluted by fitting a Gaussian–Lorentzian function with a Shirley background. The peak positions and areas were optimized until the standard deviation (χ2) stabilized to a minimum at 0.3.
The graphitization degree of the deposited carbon on spent catalysts were measured using a WITec Raman spectrometer (Alpha 300R) equipped with cooled back-illuminated EMCCD detector.
Products analysis
All products detected in the liquid were analyzed using a gas chromatograph (Agilent 7890B) equipped with a flame ionization detector (FID) and mass spectrometer (MSD, Agilent 5977A) and configured with a DB-5 column (30 m × 250 μm × 0.25 μm). Prior to GC/MS analysis, samples were first centrifuged (WIFUG Lab centrifuges, 500 E) at 3000 rpm for 5 min, and then filtered through a 0.22 μm PES (Polyether Sulfone) filter to remove catalyst particles. The yield, conversion, selectivity and carbon recovery calculations are presented in the ESI.†Results and discussion
Catalyst screening for HMF to BHMF reaction
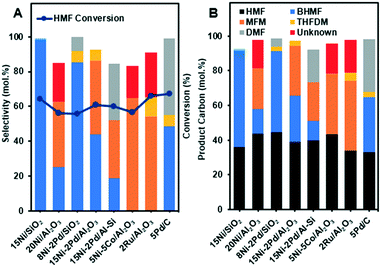
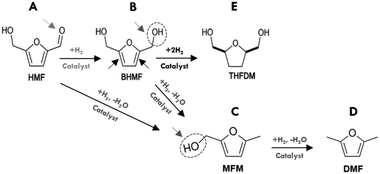
In our initial experiments, the reduction of HMF was performed in the presence of various bimetallic and monometallic catalysts (Table 1). The hydrogenation reactions were performed at 130 °C, under 40 bar of H2 for 6 h. The results of hydrogenation of HMF are summarized in Fig. 1 and the overall reaction network can be seen in Scheme 1. The products are summed together in Fig. 1B and the reactions can be viewed as a sequential series depending on the used catalyst. The 15Ni/SiO2, 2Ru/Al2O3 and 5Pd/C catalysts showed the highest HMF conversion of nearly 65 mol% of HMF to other products such as BHMF, THFDM, MFM and DMF (Fig. 1A). Interestingly, 15Ni/SiO2 exhibited close to 100% selectivity to BHMF. These results suggest that the aldehyde group C![[double bond, length as m-dash]](https://www.rsc.org/images/entities/char_e001.gif) O of HMF (A in Scheme 1) is first partially hydrogenated to BHMF (B in Scheme 1). Note that gas formation was likely minor as the total carbon recovery reached 91.6–98.5% (Fig. 1B), which is similar as in other HMF conversion studies.21,26
O of HMF (A in Scheme 1) is first partially hydrogenated to BHMF (B in Scheme 1). Note that gas formation was likely minor as the total carbon recovery reached 91.6–98.5% (Fig. 1B), which is similar as in other HMF conversion studies.21,26
In sharp contrast, the 2Ru/Al2O3 and 5Ni–5Co/Al2O3 catalysts did not produce BHMF, instead, they were more selective towards hydrogenolysis of the C![[double bond, length as m-dash]](https://www.rsc.org/images/entities/char_e001.gif) O bond of the aldehyde group of HMF to produce MFM (C in Scheme 1). MFM could also possibly be produced sequentially, where the BHFM is dehydrated to form MFM (dehydration of alcohols, B in Scheme 1). Some THFDM (E in Scheme 1) was also observed for noble metal and alumina supports, such as 2Ru/Al2O3, which could be explained by hydrogenation of the BHMF. It is important to mention that higher selective BHMF catalysts Ni–Pd/SiO2, Ni/SiO2 and 5Pd/C did not form MFM product.
O bond of the aldehyde group of HMF to produce MFM (C in Scheme 1). MFM could also possibly be produced sequentially, where the BHFM is dehydrated to form MFM (dehydration of alcohols, B in Scheme 1). Some THFDM (E in Scheme 1) was also observed for noble metal and alumina supports, such as 2Ru/Al2O3, which could be explained by hydrogenation of the BHMF. It is important to mention that higher selective BHMF catalysts Ni–Pd/SiO2, Ni/SiO2 and 5Pd/C did not form MFM product.
Moreover, comparing Ni–Pd/Al2O3 with Ni–Pd/Al–Si, which contain the same amount of Ni and Pd, it is clear that the more acidic Ni–Pd/Al2O3 produces more MFM and no DMF (D in Scheme 1). However, DMF was further produced over Ni–Pd/Al–Si and Pd/C that may be due to conversion of MFM on acid sites associated with the carbon and Al/Si supports and Pd. These findings indicated that the type of supports correlated with metal had a synergistic effect on the catalytic activity and selectivity. In fact, the results in Fig. 1A reveal that all alumina supported catalysts displayed higher selectivity towards the production of MFM. This implies that the reactions catalyzed by alumina are typical acid catalyzed such as the dehydration of alcohols and cyclohexene.36–38 Therefore, the acid sites may convert partially or totally the intermediate BHMF formed to the MFM product via a deoxygenation of the C–OH bond of the alcohol group of BHMF. Conversely, the weak acidic nature of silica supported catalysts, 15Ni/SiO2 and 8Ni–2Pd/SiO2, showed the highest selectivity towards hydrogenation of the aldehyde group of HMF to produce BHMF, with close to 100% selectivity for Ni/SiO2. It is noteworthy to mention under the performed conditions using 1-butanol as the solvent, that neither ether compounds nor ring-opened products were formed. Hence, the development of efficient catalyst systems, based on different Ni loadings over SiO2, are promising for selective hydrogenation of HMF to BHMF.
Effect of Ni loadings for Ni/SiO2
Table 2 presents the nickel content and textural properties of silica supported Ni catalysts. The ICP analysis showed that the measured Ni contents of the catalysts were close to the intended Ni content values. The N2 physisorption results show that an increase in the nickel content resulted in a slightly decreased specific surface area, and pore volume of the Ni/SiO2 catalysts. This could be explained by some pore blockage due to the addition of Ni.| Samples | 5Ni/SiO2 | 10Ni/SiO2 | 15Ni/SiO2 |
|---|---|---|---|
| a Inductively coupled plasma and sector field mass spectroscopy (ICP-SFMS). b Hemisphere shape. | |||
| BET surface area (m2 g−1) | 100.1 | 96.4 | 93.3 |
| Average pore size (Å) | 121.3 | 114.5 | 109.3 |
| Pore volume (cm3 g−1) | 0.37 | 0.33 | 0.31 |
| Ni (wt%)a | 5.1 | 10.2 | 15.9 |
| Ni dispersion (%) | 87.1 | 58.6 | 8.6 |
| Metallic surface area (m2 g−1metal) | 579.5 | 390.2 | 57.0 |
| Metallic surface area (m2 g−1cat) | 29.5 | 39.8 | 9.1 |
| Ni crystallite diameter (nm)b | 1.2 | 1.7 | 11.8 |
The average crystallite size and dispersion of Ni particles on the as-prepared Ni/SiO2 catalysts were measured by using CO chemisorption (Table 2). Note that the as-prepared materials were simultaneously calcined and reduced by the pretreatment step before the measurements. A trend of decreasing dispersion with an increase of the Ni loading was observed, although the dispersion of Ni remained relatively high, i.e. 87.1 and 58.6% for 5 and 10 wt% Ni, respectively. However, a further increase in Ni loading to 15 wt% caused a substantial decrease in the dispersion to 8.6%. Notably, the relationship between the loading and the dispersion of Ni fits well with a linear regression (Fig. 2A).
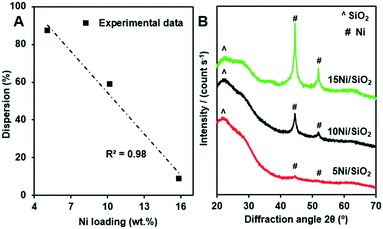 | ||
| Fig. 2 Relationship between the loading and the dispersion of Ni on the Ni/SiO2 catalysts (A), the XRD patterns of the Ni/SiO2 materials after CO chemisorption measurements (B). | ||
It is also important to consider a trade-off between the metal loading and the dispersion of the particle. In this regard, the sample 10Ni/SiO2 had the greatest surface area of metallic Ni per gram of catalyst, 39.8 m2 g−1 (Table 2), which was approximately four-fold higher than that of the 15Ni/SiO2 catalyst. Such high dispersion of Ni in the 5Ni/SiO2 and 10Ni/SiO2 catalysts resulted in small average Ni particle sizes of 1.2 and 1.7 nm, respectively. Thus, the 10Ni/SiO2 that had both a high dispersion and a high Ni loading had the highest exposed metal surface. However, the 15Ni/SiO2 with a high loading of Ni had significantly larger crystallite size (11.8 nm), which caused a very low exposure of surface Ni sites, even though the total Ni weight was the largest. We suggest that the direct reduction of the impregnated Ni/SiO2 materials plays an important role in the high dispersion of Ni in the resulting catalysts as reported in the literature.39
After CO chemisorption measurements, the catalysts were characterized with XRD and the results are shown in Fig. 2B. Apart from a broad peak around 2θ = 22.5° for the amorphous silica support,40 metallic Ni reflections were observed on the samples with a significant difference in the intensity. The Ni reflections on the 5Ni/SiO2 sample almost vanished, indicating highly dispersed Ni particles. Note that XRD measurement is usually not effective to detect crystallites smaller than 3 nm.41 By contrast, the Ni reflections were the most intense for the 15Ni/SiO2 sample. The crystallite size calculated by the Scherrer equation for the main reflection at 2θ = 44.5° was approximately 12.6 nm. These results agree well with the data obtained from the CO chemisorption measurements, where a particle diameter of 11.8 nm was found (see Table 2).
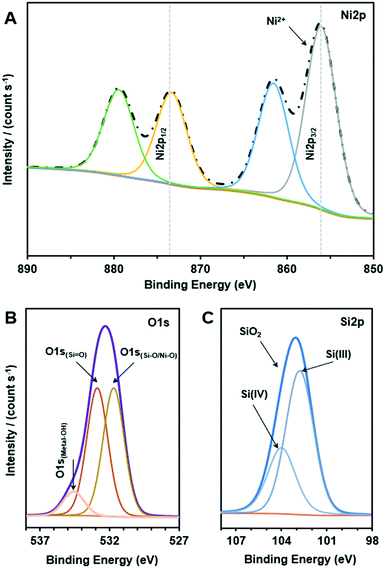
XPS analysis was performed to investigate the electronic interactions between nickel and silica. XPS spectra of the reduced 15Ni/SiO2 in Ni 2p, O 1s and Si 2p regions were measured, and the results are given in Fig. 3. As shown, doublet of Ni 2p1/2 and Ni 2p3/2 transitions in the 855–895 eV regions are illustrated. The main peak of binding energy at 856.3 eV and its satellite at 861.7 eV are indexed to Ni 2p3/2, attributed to the presence of Ni2+ as shown in Fig. 3A. The other peak of binding energy at 873.7 eV accompanied by its satellite peak at 879.9 eV was attributed to Ni 2p1/2.
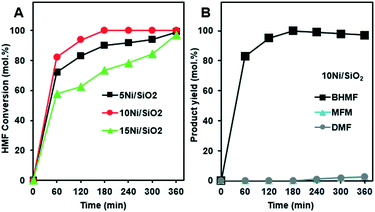
Fig. 4A presents the HMF conversion and product yields during the hydrogenation reactions over the silica supported Ni catalysts. The experiments were performed at 180 °C, under 75 bar of H2 for 6 h. A complete HMF conversion was achieved after 3 h reaction over the 10Ni/SiO2 catalyst. The reaction with 5Ni/SiO2 and 15Ni/SiO2 catalysts reached full conversion within 6 h (Fig. 4A). It was observed that HMF conversion and selectivity to BHMF increased as the Ni loading increased from 5Ni/SiO2 to 10Ni/SiO2. While a further increase in metal loading (>10%) led to slower hydrogenation kinetics with lower conversion rates. This may be due to lower Ni dispersion (see Fig. 2A). Since, the 10Ni/SiO2 catalyst showed the highest activity with complete conversion of HMF, the selectivity to BHMF was also examined to assess the reaction pathways (Fig. 4B).
Initially, from 1 to 3 h reaction, HMF conversion was achieved with 100% selectivity to BHMF. This suggests that BHMF, as the main product, was produced via hydrogenation of the aldehyde group of HMF, suppressing the formation of other byproducts. Despite that the total HMF conversion was maintained beyond 4 h, a minor decrease in BHMF selectivity along with formation of small amounts of DMF and MFM was observed. In comparison to the moderate reaction temperature at 130 °C (Fig. 1A), higher reaction temperature 180 °C along with increased residence time may be the reason that generation of small amounts of byproducts was observed. Our results are consistent with previous report,19 where higher temperature suppress BHMF production. However, for our case the DMF production was only minor.
The excellent performance of the 10Ni/SiO2 catalysts for HMF hydrogenation might be due to a combined outcome of excellent dispersion of Ni nanoparticles (<2 nm) on the surface (Table 2) and the low acidic silica support, which makes it extremely effective as well as selective for HMF hydrogenation towards BHMF. The main reason for the activity of the Ni nanoparticles can be considered an association between the surface of Ni and the furanic ring of HMF in which C![[double bond, length as m-dash]](https://www.rsc.org/images/entities/char_e001.gif) O functional group of the furan ring is bonded to the Ni surface via both its C and O atoms which leads to the highly selective formation of BHMF.42
O functional group of the furan ring is bonded to the Ni surface via both its C and O atoms which leads to the highly selective formation of BHMF.42
Effect of DMSO on HMF hydrogenation to BHMF
During HMF production, DMSO is often used as a solvent. Indeed, our purchased HMF contained 0.5 wt% DMSO. Since DMSO contains sulfur, and sulfur is known to be a catalyst poison it is important to study the effect of the DMSO present in the HMF. We have therefore doped the feed for the reaction, with additional DMSO. The most optimum catalyst, i.e. 10Ni/SiO2, exhibited over 80% conversion in the first data point and over 90% in the second point (Fig. 4A), which makes it difficult to properly study the deactivation over time due to the very high activity. In order to study the effect of DMSO, we therefore chose 15Ni/SiO2 so that the effect of DMSO during the whole experiment of 6 h could be examined.Fig. 5 presents the effect of DMSO doping on the conversion of HMF using 15Ni/SiO2. The results clearly show a poisoning effect when the concentration of DMSO increased from 0.5 wt% to 8.5 wt%. Moreover, after 6 h reaction, the experiment with the lowest amount of DMSO (0.5 wt%) showed the highest HMF conversion (98%), whereas the lowest HMF conversion of only 56% was observed at the highest amount of DMSO (8.5 wt%). Similar trends of HMF conversion were observed for all experiments during the reaction time. This trend is consistent and having the same functional dependence on DMSO concentration which potentially affects the activities of the catalysts, particularly at the initial period of the reactions.
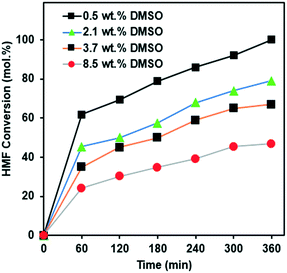 | ||
| Fig. 5 HMF conversion of the hydrogenation reaction with different concentration of DMSO over 15Ni/SiO2 catalyst. Operating conditions: 180 °C, 75 bar H2, for 6 h. | ||
It has previously been reported that DMSO can be decomposed to produce hydrogen sulfide over solid catalysts and in the presence of hydrogen.43 Then, the produced hydrogen sulfide can act as a sulfur poison for most metal catalysts. To evaluate such a hypothesis, the sulfur contents of the spent catalysts were measured by ICP-SFMS, XPS and STEM-EDX analysis. The ICP analysis showed the presence of sulfur in the spent catalysts. The sulfur content increased from 0.13 wt% to 0.5 wt% when the DMSO concentration increased from 0.5 wt% to 8.5 wt%. The XPS analysis of the spent catalysts did not show any sulfur contamination since the sulfur content of the spent catalysts, previously measured by ICP-SFMS, was lower than the XPS instrument detection limit of 1%. The Ni loading of the catalysts was 15 wt%, therefore, a low sulfur contamination of less than 1 wt% may not be the only reason for the observed drastic inhibition of the hydrogenation.
The results in Table 2 showed a Ni dispersion of 8.6% and a particle size of 11.8 nm for 15Ni/SiO2. An estimate of the S/Ni surface atom ratio (sulfur from ICP of spent catalyst, and Ni surface atoms based on ICP and dispersion) was made assuming that all sulfur was bound to Ni (see next paragraph for STEM-EDX that supports this assumption). This resulted in a ratio of 0.095, 0.10, 0.11 and 0.37, respectively. Thus it is clear that not all Ni surface atoms were blocked by sulfur species, but that part of the deactivation is likely originating from sulfur inhibition. These results are consistent with observations that an organosulfur agent can react with hydrogen over a catalyst to generate hydrogen sulfide and thereby act to sulfide the catalyst.43 These results are also in agreement with the S–Ni diagram presented by Wang and Liu44 and confirmed by Lakhapatri and Abraham45,46 suggesting that the sulfur compounds decompose to hydrogen sulfide, which adsorbs dissociatively on the metal surface, thereby forming a sulfur layer. The Ni-surface layer inhibits chemisorption of small molecules leading to catalyst deactivation.
Fig. S1† presents a HAADF-STEM micrograph and the corresponding EDX spectra of the 15Ni/SiO2 catalyst that was spent from the HMF hydrogenation reaction using 8.5 wt% DMSO. The EDX spectra identified Ni particles supported on the silica support (Fig. S1b†). After reaction with 8.5 wt% of DMSO in the feed, presence of sulfur in the vicinity of Ni particles was confirmed. Furthermore, no sulfur on silica support was observed as can be seen in the EDX analysis at positions 2 and 4.
The existence of carbon deposits on the catalyst surface was confirmed by Raman spectroscopy. Fig. 6 represents the Raman spectra of carbon deposition on the spent 15Ni/SiO2 catalysts exposed to 8.5 and 0.5 wt% DMSO. The G band which appears at 1565 cm−1 corresponds to planar vibrations of carbon atoms present in graphite-like materials, whereas the D band which appears at 1350 cm−1 is due to structural defects in graphite-like carbons.47 The relative intensity of D and G-bands (ID/IG) indicates higher crystallinity due to a higher contribution of formed carbonaceous species (graphitization).48,49 When comparing the ID/IG for the spent catalyst using 8.5 and 0.5 wt% DMSO, it is clear that the sample exposed to the highest DMSO concentration has significantly higher ID/IG, thus undergoing more graphitization. These results are consistent with a previous report where steam reforming of sulfur-containing dodecane were studied over Rh–Pt catalysts.50 Zheng et al. found that the degree of carbon deposition due to graphitization on the spent catalyst, during the course of the reaction, increased with increasing sulfur concentration, which is mostly responsible for deactivation, as it acts like a shell covering the active sites.50
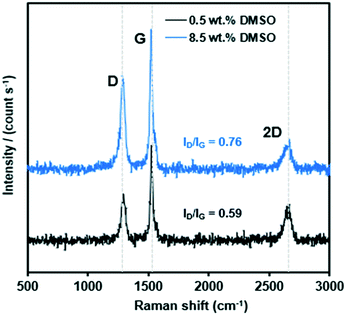 | ||
| Fig. 6 Raman spectra of spent 15Ni/SiO2 catalyst doped with 8.5 wt% (blue) and 0.5 wt% (black) DMSO. | ||
The high concentration of Ni for the metal particle, associated with the silica support, is evident. Sulfur deposition for the spent catalysts was clear with a S/surface Ni molar ratio of 0.1–0.4. This formed sulfur may be due to the decomposition of DMSO to producing hydrogen sulfide over Ni under the reduced conditions. Based on the analysis performed for the reduced and spent Ni/SiO2 catalysts, we suggest that the presence of sulfur at the nickel catalyst surface not only results in catalyst poisoning but also in carbon deposition. The Raman study on the spent catalyst revealed that graphitic carbon was dominant after increasing the concentration of DMSO. In addition, XPS spectra of the spent catalyst, reveal small shifts (≈1–2 eV) in the binding energies of the Ni 2p3/2 and Ni 2p1/2 main peaks (Fig. 7). These results indicate that the reaction with HMF in the presence of DMSO partially changes the nickel species and this is accompanied with a decrease of dehydration in the deoxygenation of HMF.
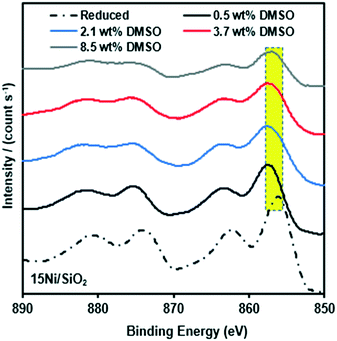 | ||
| Fig. 7 Comparison of surface structure of Ni 2p XPS spectra of reduced 15Ni/SiO2 catalyst and spent 15Ni/SiO2 catalysts for different concentrations of DMSO. | ||
Conclusions
In summary, several metal supported catalysts were prepared and evaluated for HMF hydrogenolysis and hydrogenation to BHMF. Among the prepared catalysts, the 10Ni/SiO2 catalyst exhibited excellent performance in terms of complete conversion of HMF along with the highest selectivity of 99% to BHMF. This is mainly due to a combined outcome of well dispersed Ni nanoparticles on silica and weak acidity of the catalyst support. In addition, the effect of DMSO on HMF hydrogenation activity was also investigated. The overall conversion rate of HMF was decreased by nearly 57% when the concentration of DMSO increased to 8.5%. Various characterization results shown in this study clearly demonstrate that DMSO can profoundly affect the carbon deposition. The sulfur and carbon deposition covered the Ni catalysts and inhibited HMF hydroconversion, which is believed to be the major reason causing its drastic inhibition by the presence of DMSO.Conflicts of interest
There are no conflicts to declare.Acknowledgements
This work is a collaboration between Chemical Engineering Chalmers, Perstorp AB and Sekab E-Technology AB. We gratefully acknowledge the financial support from BioInnovation (2017-02702), Perstorp AB and Sekab E-Technology AB. The strategic innovation programme BioInnovation is a joint effort by Vinnova, Formas and the Swedish Energy Agency. We would also like to acknowledge the use of Chalmers Material Characterization Lab (CMAL) and the help with Raman, STEM and XPS from Katrina Logg, Stefan Gustavsson and Eric Tam.References
- Z. Şen, in Advances in Science, Technology and Innovation, Springer, Istanbul, Turkey, 2019, pp. 217–242 Search PubMed.
- G. Knothe, Prog. Energy Combust. Sci., 2010, 36, 364–373 CrossRef CAS.
- B. Kamm, Angew. Chem., Int. Ed., 2007, 46, 5056–5058 CrossRef CAS PubMed.
- A. A. Rosatella, S. P. Simeonov, R. F. M. Frade and C. A. M. Afonso, Green Chem., 2011, 13, 754 RSC.
- R. L. de Souza, H. Yu, F. Rataboul and N. Essayem, Challenges, 2012, 3, 212–232 CrossRef.
- A. H. Motagamwala, W. Won, C. Sener, D. M. Alonso, C. T. Maravelias and J. A. Dumesic, Sci. Adv., 2018, 4, eaap9722 CrossRef PubMed.
- X. Tong, Y. Ma and Y. Li, Appl. Catal., A, 2010, 385(1–2), 1–13 CrossRef CAS.
- M. Djokic, H. H. Carstensen, K. M. Van Geem and G. B. Marin, Proc. Combust. Inst., 2013, 34, 251–258 CrossRef CAS.
- J. Jae, W. Zheng, A. M. Karim, W. Guo, R. F. Lobo and D. G. Vlachos, ChemCatChem, 2014, 6, 848–856 CrossRef CAS.
- J. Tuteja, H. Choudhary, S. Nishimura and K. Ebitani, ChemSusChem, 2014, 7, 96–100 CrossRef CAS PubMed.
- J. He, S. P. Burt, M. Ball, D. Zhao, I. Hermans, J. A. Dumesic and G. W. Huber, ACS Catal., 2018, 8, 1427–1439 CrossRef CAS.
- T. Buntara, S. Noel, P. H. Phua, I. Melián-Cabrera, J. G. De Vries and H. J. Heeres, Angew. Chem., Int. Ed., 2011, 50, 7083–7087 CrossRef CAS PubMed.
- Y. Nakagawa and K. Tomishige, Catal. Commun., 2010, 12, 154–156 CrossRef CAS.
- C. Thoma, J. Konnerth, W. Sailer-Kronlachner, P. Solt, T. Rosenau and H. W. G. van Herwijnen, ChemSusChem, 2020, 13, 3544–3564 CrossRef CAS PubMed.
- D. W. Brown, A. J. Floyd, R. G. Kinsman and Y. Roshan-Ali, J. Chem. Technol. Biotechnol., 1982, 32, 920–924 CrossRef CAS.
- Y. Román-Leshkov, J. N. Chheda and J. A. Dumesic, Science, 2006, 312, 1933–1937 CrossRef PubMed.
- W. Fan, C. Verrier, Y. Queneau and F. Popowycz, Curr. Org. Synth., 2019, 16, 583–614 CrossRef CAS PubMed.
- B. F. M. Kuster, Starke, 1990, 42, 314–321 CrossRef CAS.
- B. S. Solanki and C. V. Rode, J. Saudi Chem. Soc., 2019, 23, 439–451 CrossRef CAS.
- A. Gelmini, S. Albonetti, F. Cavani, C. Cesari, A. Lolli, V. Zanotti and R. Mazzoni, Appl. Catal., B, 2016, 180, 38–43 CrossRef CAS.
- M. Chatterjee, T. Ishizaka and H. Kawanami, Green Chem., 2014, 16, 4734–4739 RSC.
- H. Cai, C. Li, A. Wang and T. Zhang, Catal. Today, 2014, 234, 59–65 CrossRef CAS.
- J. Ohyama, A. Esaki, Y. Yamamoto, S. Arai and A. Satsuma, RSC Adv., 2013, 3, 1033–1036 RSC.
- M. Tamura, K. Tokonami, Y. Nakagawa and K. Tomishige, Chem. Commun., 2013, 49, 7034–7036 RSC.
- Q. Cao, W. Liang, J. Guan, L. Wang, Q. Qu, X. Zhang, X. Wang and X. Mu, Appl. Catal., A, 2014, 481, 49–53 CrossRef CAS.
- I. Elsayed, M. A. Jackson and E. Barbary Hassan, ACS Sustainable Chem. Eng., 2020, 8, 1774–1785 CrossRef CAS.
- Z. Zhang, C. Liu, D. Liu, Y. Shang, X. Yin, P. Zhang, B. B. Mamba, A. T. Kuvarega and J. Gui, J. Mater. Sci., 2020, 55, 14179–14196 CrossRef CAS.
- L. Yu, L. He, J. Chen, J. Zheng, L. Ye, H. Lin and Y. Yuan, ChemCatChem, 2015, 7, 1701–1707 CrossRef CAS.
- J. Luo, L. Arroyo-Ramírez, J. Wei, H. Yun, C. B. Murray and R. J. Gorte, Appl. Catal., A, 2015, 508, 86–93 CrossRef CAS.
- J. Luo, L. Arroyo-Ramírez, R. J. Gorte, D. Tzoulaki and D. G. Vlachos, AIChE J., 2015, 61, 590–597 CrossRef CAS.
- M. Balakrishnan, E. R. Sacia and A. T. Bell, Green Chem., 2012, 14, 1626–1634 RSC.
- J. Han, Y.-H. Kim, H.-S. Jang, S.-Y. Hwang, J. Jegal, J. W. Kim and Y.-S. Lee, RSC Adv., 2016, 6, 93394–93397 RSC.
- J. Luo, J. Yu, R. J. Gorte, E. Mahmoud, D. G. Vlachos and M. A. Smith, Catal. Sci. Technol., 2014, 4, 3074–3081 RSC.
- G. Haarlemmer, C. Guizani, S. Anouti, M. Déniel, A. Roubaud and S. Valin, Fuel, 2016, 174, 180–188 CrossRef CAS.
- G. Bergeret and P. Gallezot, in Handbook of Heterogeneous Catalysis, American Cancer Society, 2008, pp. 738–765 Search PubMed.
- H. Pines and W. O. Haag, J. Am. Chem. Soc., 1960, 82, 2471–2483 CrossRef CAS.
- R. Alamillo, M. Tucker, M. Chia, Y. Pagán-Torres and J. Dumesic, Green Chem., 2012, 14, 1413–1419 RSC.
- E. Soszka, M. Jędrzejczyk, I. Kocemba, N. Keller and A. M. Ruppert, Catalysts, 2020, 10, 1026 CrossRef CAS.
- C. Louis, Z. X. Cheng and M. Che, J. Phys. Chem., 1993, 97, 5703–5712 CrossRef CAS.
- C. Wang, Z. Jia, B. Zhen and M. Han, Molecules, 2018, 23, 92 CrossRef PubMed.
- S. Mourdikoudis, R. M. Pallares and N. T. K. Thanh, Nanoscale, 2018, 10, 12871–12934 RSC.
- H. Jeong, C. Kim, S. Yang and H. Lee, J. Catal., 2016, 344, 609–615 CrossRef CAS.
- K. A. Johnson, J. B. Powell and J. A. Smegal, US Patent Application Publication, US 2012/0322653 A1, 2012.
- J. H. Wang and M. Liu, Electrochem. Commun., 2007, 9, 2212–2217 CrossRef CAS.
- S. L. Lakhapatri and M. A. Abraham, Appl. Catal., A, 2011, 405, 149–159 CrossRef CAS.
- S. L. Lakhapatri and M. A. Abraham, Catal. Sci. Technol., 2013, 3, 2755–2760 RSC.
- A. Merlen, J. G. Buijnsters and C. Pardanaud, Coatings, 2017, 7, 153 CrossRef.
- L. F. Bobadilla, A. Álvarez, M. I. Domínguez, F. Romero-Sarria, M. A. Centeno, M. Montes and J. A. Odriozola, Appl. Catal., B, 2012, 123–124, 379–390 CrossRef CAS.
- A. Carrero, J. A. Calles and A. J. Vizcaíno, Chem. Eng. J., 2010, 163, 395–402 CrossRef CAS.
- Q. Zheng, C. Janke and R. Farrauto, Appl. Catal., B, 2014, 160–161, 525–533 CrossRef CAS.
Footnote |
| † Electronic supplementary information (ESI) available. See DOI: 10.1039/d1re00255d |
| This journal is © The Royal Society of Chemistry 2022 |

