 Open Access Article
An “OFF–ON–OFF” fluorescence protein-labeling probe for real-time visualization of the degradation of short-lived proteins in cellular systems†
Shahi Imam
Reja
 a,
Yuichiro
Hori
 *ab,
Takuya
Kamikawa
a,
Kohei
Yamasaki
a,
Miyako
Nishiura
a,
Steven D.
Bull
 c and
Kazuya
Kikuchi
 *ab
*ab
aDivision of Applied Chemistry, Graduate School of Engineering, Osaka University, Suita, Osaka 565-0871, Japan. E-mail: kkikuchi@mls.eng.osaka-u.ac.jp; horiy@mls.eng.osaka-u.ac.jp
bImmunology Frontier Research Center, Osaka University, Suita, Osaka 565-0871, Japan
cDepartment of Chemistry, University of Bath, Claverton Down, Bath, BA2 7AY, UK
First published on 11th January 2022
Abstract
The ability to monitor proteolytic pathways that remove unwanted and damaged proteins from cells is essential for understanding the multiple processes used to maintain cellular homeostasis. In this study, we have developed a new protein-labeling probe that employs an ‘OFF–ON–OFF’ fluorescence switch to enable real-time imaging of the expression (fluorescence ON) and degradation (fluorescence OFF) of PYP-tagged protein constructs in living cells. Fluorescence switching is modulated by intramolecular contact quenching interactions in the unbound probe (fluorescence OFF) being disrupted upon binding to the PYP-tag protein, which turns fluorescence ON. Quenching is then restored when the PYP-tag–probe complex undergoes proteolytic degradation, which results in fluorescence being turned OFF. Optimization of probe structures and PYP-tag mutants has enabled this fast reacting ‘OFF–ON–OFF’ probe to be used to fluorescently image the expression and degradation of short-lived proteins.
Introduction
Protein degradation plays an essential role in maintaining cellular homeostasis,1–3 with protein misfolding and uncontrolled protein aggregation responsible for a range of neurodegenerative diseases, including Huntington's disease, Alzheimer's disease and amyotrophic lateral sclerosis (ALS).4–6 Damaged or misfolded proteins in cells7,8 are normally removed by the ubiquitin-proteasome9 and/or lysosomal proteolytic pathways,10 which hydrolyse them into small peptides and amino acids.11 These protein recycling pathways are key to maintaining optimal protein activity levels in cellular pathways, so the development of imaging techniques to visualize protein expression/degradation in cellular systems in real time has great potential for informing biological studies and facilitating drug discovery.A range of small molecule tagging agents have been developed to induce degradation of Proteins Of Interest (POI), including PROteolysis TArgeting Chimeras (PROTACs),12,13 LYsosome-TArgeting Chimeras (LYTACs)14 and Specific and Non-genetic IAP-dependent Protein ERasers (SNIPERs).15 These protein degrading systems generate protein conjugates that undergo rapid proteasomal/lysosomal degradation, thus providing powerful technologies to selectively degrade ‘undruggable’ proteins as potential treatments for different diseases.16–18 A number of analytical techniques are available to detect protein degradation in cells in real time, including pulse-chase assays that use radiolabeled amino acids, cycloheximide (CHX)-chase based assays and promoter reference techniques (PRT).19 However, pulse-chase protein degradation assays use laborious radiolabeling protocols, CHX assays inhibit protein synthesis which can perturb normal cellular function, whilst PRT assays are not applicable to mammalian cell-lines. This means that these techniques are not applicable for real-time monitoring of protein degradation in living cells. Fluorescent Proteins (FPs) can be used for real-time imaging of protein degradation,20,21 however, these assays also depend on CHX based assays to prevent FP expression producing background cell fluorescence.22,23 Photoactivatable fluorescent proteins (PAFPs) have been used to enable CHX-free imaging of protein degradation,24 however, relatively slow fluorescence response times limit their utility, particularly for monitoring degradation of short-lived proteins (SLPs).25 The ability to use a probe to fluorescently detect the production/degradation of SLPs in real time would be particularly useful, because many of the key roles they play in cell regulatory processes are not fully understood, with >500 SLPs known to be expressed in cells.26
Several covalent self-labeling fluorescent tags for imaging protein constructs in cell systems have been developed, including SNAP-tag,27 CLIP-tag,28 Halo-tag,29 BL-tag30 and PYP-tag31 based labeling systems. These CHX-free pulse-chase protein labeling approaches rely on addition of fluorescent probes to cells expressing proteins that contain a probe-binding tag which generates fluorescent protein–probe conjugates that are then imaged. However, these labeling systems are not well-suited to imaging cellular protein degradation, because the fluorophore remains fluorescent after the protein–probe conjugate has been degraded. This means that cellular fluorescence intensity levels are only decreased after the fluorophore diffuses out of the cell, so it is not possible to monitor protein degradation in real time. In order to address these issues, we have recently developed a fluorescent PYP-tag probe, CG2, that can be used for ‘no-wash’ monitoring of protein expression/degradation in living cells in real time (Fig. 1a).32 Unfortunately, the relatively poor fluorescence intensity of the coumarin fluorophore of the CG2 probe prevents it from being used for high-resolution cell imaging studies (Fig. S1 and Table S1†). This means that CG2 is also not suitable for imaging short-lived proteins and/or monitoring the degradation of proteins with low expression levels (Fig. S1 & S2†). It is difficult to improve the fluorescence properties of the CG2 probe by modifying its coumarin fluorophore, since this fragment also acts as the binding ligand for the PYP-tag protein.
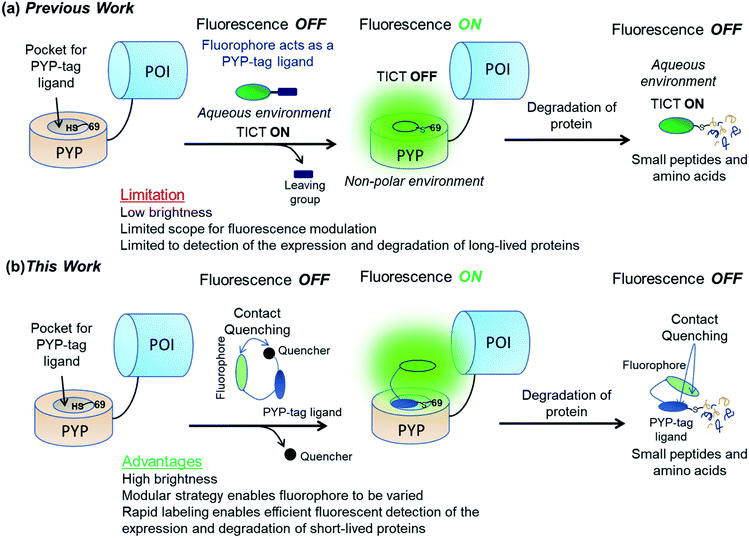 | ||
| Fig. 1 Use of “OFF–ON–OFF” fluorescent probes for real-time imaging of protein degradation. (a) Previous work32 showing use of a dimethylaminocoumarin based probe CG2 whose fluorophore also acts as a PYP-tag ligand. (b) Use of a new trifunctional probe for imaging protein degradation that contains a xanthene-based fluorophore, a quenching unit, and a PYP-tag ligand binding unit. POI = protein of interest. | ||
We now report that these labeling/fluorescence issues can be addressed through use of new trifunctional PYP-tag labeling ‘OFF–ON–OFF’ probes that contain distinct xanthene fluorophore, coumarin ligand binding and dinitroaryl quenching units. Xanthene-based fluorophore fluoresce in the green to near-infrared (NIR) region with high quantum yields and good molar absorptions that are well suited for cellular imaging studies.33,34 The fluorophore of the unbound probe is turned ‘OFF’ via intramolecular association between the xanthene fluorophore and the dinitroaryl quenching unit. Covalent binding of the probe's coumarin ligand to the hydrophobic pocket of a PYP-tag protein results in a trans-thioesterification reaction with the thiol unit of Cys69, which cleaves the probe's quenching unit to produce a PYP-tag–probe conjugate whose fluorescence is turned ‘ON’. Subsequent proteolytic degradation of the fluorescent PYP-tag–probe conjugate then generates probe-labeled fragments whose fluorescence are turned ‘OFF’ through intramolecular quenching interactions between the probe's xanthene fluorophore and its coumarin ligand unit (Fig. 1b).35,36 These new ‘contact-quenching’ probes have been used for real-time ‘OFF–ON’ fluorescent visualization of the cellular expression of PYP-tagged Epidermal Growth Factor Receptor (EGFR) in the of cytoplasm membrane, Lyn11-PYPwt located at the inner surface of the cytoplasm membrane and PYP-tag Nuclear Localization Signal (NLS) in the nuclei of cells. The new probe system has also been successfully used for OFF–ON fluorescent detection of the production of short-lived PYP-tag-Mouse Ornithine DeCarboxylase (MODC) constructs in cell nuclei and ON–OFF fluorescence monitoring of their proteolytic degradation in real time.
Results and discussion
Reactive “OFF–ON–OFF” probes for in vitro fluorescent labeling of PYP-tag proteins
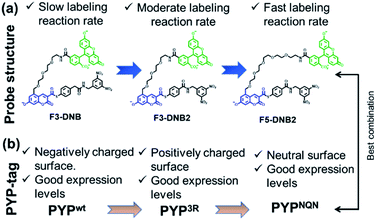
Guided by our previous PYP-tag probe-labeling studies,32 we designed a new trifunctional ‘contact quenching’ “OFF–ON–OFF” fluorescence probe (F3-DNB) for the rapid labeling of PYP-tag proteins (Fig. 2). This probe contains a PYP-tag binding 7-hydroxycoumarin ligand connected to a fluorescein fluorophore through a PEG linker (see Schemes ESI 1.1–ESI 1.5† for details of syntheses of all probes). The central coumarin ligand unit is attached to a pendant dinitrobenzene (DNB) quenching unit through a labile thiophenol ester bond that can undergo a trans-thioesterification reaction with the thiol group of the Cys69 residue of a PYP-tag protein, which cleaves the quenching unit to produce a fluorescent PYP-tag-bound probe. A DNB quencher moiety was included in the probe design to avoid steric interactions between the fluorophore and the coumarin ligand that were known to result in slow PYP-tag protein labeling kinetics (see ESI Text†).37–39 A structurally related F3-DNB2 probe was also prepared containing a more activated thiophenol leaving group that we reasoned would label PYP-tag proteins more effectively (Fig. 3). Finally, a third F5-DNB2 probe containing a longer PEG5 linker was synthesized, because previous studies had shown that close interaction between the probe's fluorophore and ligand units could produce steric congestion that decreased the rate of labeling of PYP-tag.39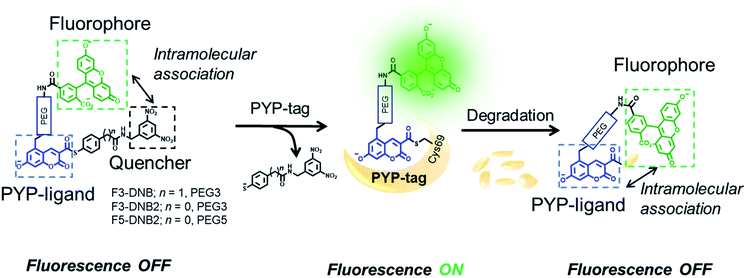 | ||
| Fig. 2 Structures and mechanism of action of the modular PYP-tag ligands (F3-DNB, F3-DNB2 and F5-DNB2) used as “OFF–ON–OFF” probes for the fluorescent detection of protein degradation. | ||
The surface of the wild-type PYP-tag proteins (PYPwt) is negatively charged at physiological pH, meaning its conjugation reactions with a negatively charged ‘OFF–ON–OFF’ probe are likely to be disfavored by electrostatic repulsion effects.40 Consequently, we prepared a PYP-tag mutant (PYP3R) in which three key negatively surface acidic residues (Asp71, Glu74, and Asp97) close to the binding pocket were replaced by three positively charged arginine residues that were more likely to bind a negatively charged probe. We also prepared a second PYPNQN mutant, by replacing the same three acidic residues with the neutral amino acids, Asn, Gln and Asn, since this mutant had been shown to react more rapidly with anionic PYP-tag probes, as well as display better cellular expression levels.41
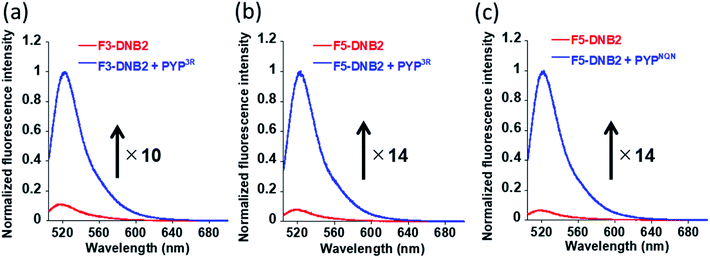
Fluorescence analyses confirmed that the fluorescence response of all three probes were quenched in their free state (Fig. 4 & S3†), with each probe producing absorption maxima between 500–505 nm that were red shifted in comparison to fluorescein (absorption maxima of 491 nm) (Fig. S4†). This indicated that the fluorophores of the free DNB2 probes were present in aggregated states, with their fluorescence emissions suppressed through a contact quenching mechanism. The absorption band of the coumarin ligand of the probe displayed a bathochromic shift of ∼4 nm relative to CATP (a fluorescein free coumarin PYP-tag probe) (Fig. S4†),36 indicating that both the coumarin and DNB quenching units can undergo intramolecular association with the fluorophore of the free probe to quench its fluorescence.
PYP-tag protein labeling studies were carried out by reacting the three DNB-probes (F3-DNB, F3DNB2 and F5-DNB2) with PYPwt and the PYP-mutants (PYP3R and PYPNQN) in HEPES buffer (pH 7.4) at 37 °C, followed by heating at 95 °C to denature the proteins. SDS-PAGE gel analyses revealed fluorescent bands corresponding to probe-labeled PYPwt or PYP-mutant proteins (PYP3R and PYPNQN) (Fig. S5 & S6†), with F3-DNB labeled PYPwt- and PYP3R-proteins exhibiting 18- and 15-fold enhancements in their fluorescence intensities, respectively (Fig. S3†). F3-DNB2 displayed a lower 10-fold increase in fluorescence intensity on binding to PYP3R (Fig. 4a), whilst reaction of F5-DNB2 with PYP3R and PYPNQN resulted in a 14-fold enhancement in fluorescence (Fig. 4b and c). Therefore, these in vitro labeling studies clearly demonstrated that covalent binding of the DNB-probes to the hydrophobic pocket of the PYP-tag protein results in an ‘OFF–ON’ switch in fluorescence.
Investigation of the labeling rate of negatively charged PYPwt with negatively charged F3-DNB revealed a relatively slow half-life (t1/2) of 353 min and a second-order rate constant (k2) of 2.4 M−1 s−1 (Fig. S7†). As predicted, covalent labeling of F3-DNB with positively charged PYP3R occurred more quickly, producing a t1/2 of 88 min and a k2 of 14 M−1 s−1 (Fig. S8†). Reaction of F3-DNB2 (better-leaving group) with PYP3R occurred even more rapidly, resulting in a t1/2 of 23 min and k2 of 190 M−1 s−1 (Fig. S9†). Reaction of F5-DNB2 (longer PEG chain) with PYP3R containing positively charged mutations was most rapid, affording a probe-labeled PYP-tag protein with a t1/2 value of 5.5 min and k2 of 420 M−1 s−1, respectively (Fig. S10†). Finally, reaction of F5-DNB2 with PYPNQN (containing neutral mutations near the binding site) proceeded with a similar t1/2 value of 7.14 min and k2 of 330 M−1 s−1 (Fig. S11 & Table S2†).
The presence of bathochromic shifts in the absorption maxima of both the fluorophore and ligand fragments of the DNB-probes suggest that both units participate in intramolecular interactions with their fluorophore fragments (Fig. S4†). Previous studies had shown that intramolecular interactions between the probe's fluorophore and coumarin ligand units produced a significant decrease in the overall rate of PYP-tag protein labeling,36 with labeling rates dependent on the length of the linker length connecting the fluorophore and ligand.39 This provides a potential explanation for the better protein labeling kinetics observed for F5-DNB2 over F3-DNB2 (same thiophenol leaving group), with the longer less sterically hindered PEG5 linker of F5-DNB2 affording a more reactive thioester group that undergoes faster PYP-tag protein labeling. As evidence for this hypothesis, MacroModel simulation studies on free F3-DNB2 generated 421 possible low-energy conformations, with 84% of these structures containing intramolecular associations between the fluorophore and ligand units, with only 9% of the structures displaying fluorophore-quencher interactions (Fig. S12a & Table S3†). In contrast, MacroModel simulation studies (Fig. S12b†) on F5-DNB2 (containing a longer PEG5 linker) generated 312 possible low-energy conformations with >80% of its structures displaying intramolecular fluorophore-quencher interactions, with <1% of the structures displaying interactions between the fluorophore and the ligand (Fig. S12c & Table S3†). Therefore, the increased reactivity of the F5-DNB2 probe towards PYP-tag is likely to be caused by reduced steric hindrance in the vicinity of its ligand fragment caused by its longer PEG linker allowing stronger intramolecular interactions between the fluorophore and quenching units (also see ESI Text†).
Incubation of F5-DNB2 and PYP3R for 120 min, followed by addition of 10 mM glutathione for 180 min only resulted in a small reduction in fluorescence intensity. This indicates that the thiol group of GSH does not react significantly with the thioester bond of the PYP-tag bound F5-DNB2 construct to produce a glutathione bound probe. This is important, because any trans-thioesterification reaction between a PYP-tag bound F5-DNB2 construct and GSH would likely result in a loss in fluorescence, which would interfere with the ability of this PYP-tag sensing system to monitor SLP degradation in real time (Fig. S13†).
In vitro “ON–OFF” fluorescence detection of the proteolytic degradation of PYP-tag proteins
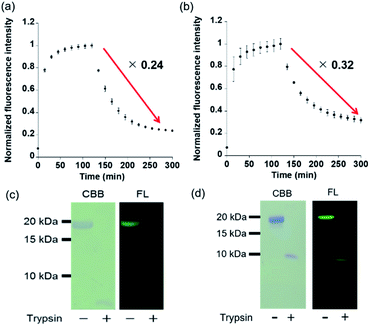
In vitro treatment of PYP3R or PYPNQN with F5-DNB2 (most reactive probe) resulted in rapid formation of fluorescent PYP-tag–probe conjugates that gave maximal fluorescence intensities after 60 min. These fluorescent conjugates were then treated with trypsin to induce proteolytic digestion, with the fluorescence intensities of both PYP-tag–probe conjugates decreasing gradually over time, reaching stable fluorescence minima after 130 min (Fig. 5a and b). SDS-PAGE analyses of the protease cleavage products revealed no gel bands present for intact probe-labeled PYP3R or PYPNQN proteins, thus confirming that both had undergone proteolytic digestion (Fig. 5c and d). These results demonstrate that proteolysis of the fluorescent PYP-tag–probe conjugates produces the desired ‘ON–OFF’ switch in fluorescence in probe cleavage products (Fig. 5a, b & Table S4†).The modularity of this new OFF–ON–OFF PYP-tag probe design was then demonstrated by preparing a new PYP-tag probe containing a tetramethylrhodamine (TAMRA) fluorophore (T5-DNB2). Incubation of T5-DNB2 with the PYPwt-tag protein resulted in a 41-fold enhancement in fluorescence intensity of the resultant protein–probe conjugate (Fig. S14b†). Proteolytic cleavage of the fluorescent T5-DNB2-PYP-tag protein with trypsin resulted in a decreased in fluorescence intensity to 6% of its original value after 180 min (Fig. S14b†), with SDS-PAGE analyses revealing that all the probe-labeled PYP-tag protein had been digested (Fig. S14c†). The “ON–OFF” quenching efficiency is stronger in the case of T2-DNB2 than F5-DNB2, which is probably due to better intramolecular association between the fluorophore and peptide-bound coumarin ligand after protein digestion. Therefore, a rhodamine based T5-DNB2 can also be used as an OFF–ON–OFF probe to detect protein labeling and degradation, thus demonstrating the potential of incorporating different fluorophores into this modular probe system as required.
In vivo OFF–ON fluorescence imaging of a PYP-tagged protein in the plasma membranes and nuclei of living cells
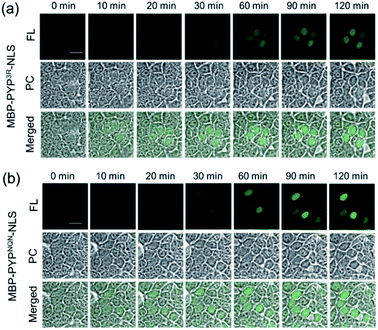
The ability of F5-DNB2 to function as an ‘OFF–ON’ fluorescent probe for imaging PYP-tag proteins in cellular systems was then evaluated. A gene construct encoding EGFR fused to PYPNQN (PYPNQN-EGFR) was expressed in HEK293T cells, which is a trans-membrane receptor produced in the plasma membrane of cells. Transfected HEK293T cells were then incubated with F5-DNB2 for 60 min. With fluorescence imaging studies revealing the presence of green fluorescent signals in their plasma membranes, with very little fluorescence present in the culture media (or in the membranes of non-transfected HEK293T cells) (Fig. S15†). This demonstrated that the cell-surface PYPNQN-EGFR proteins could be effectively labeled and fluorescently visualized using the F5-DNB2 probe under ‘no-wash’ conditions. A gene encoding PYP3R-fused EGFR was also created, however its expression levels in HEK293T cells were too low (as anticipated) to produce useful fluorescent images (Fig. S16†).41We then attempted to use the OFF–ON fluorescence properties of a DNB probe to image intracellular reservoirs of PYP-tag proteins present in the nuclei of cells. HEK293T cells transfected with genes encoding PYP3R or PYPNQN fused with maltose-binding protein (MBP) and nuclear localization signal (NLS) were first expressed for 24 h. Initial attempts to use F5-DNB2 to visualize MBP-PYP3R-NLS and MBP-PYPNQN-NLS proteins in the nuclei of the transfected cells proved unsuccessful, because the F5-DNB2 probe was impermeable to the plasma membrane. However, a diacetylated version of the probe (non-fluorescent pro-probe Ac2F5-DNB2) was capable of gaining cellular entry, with cellular esterases then catalyzing hydrolysis of the pro-probes acyl groups to produce free F5-DNB2 within the cell.42,43 Direct imaging of transfected cells treated with Ac2F5-DNB2 was conducted in the presence of the drug efflux pump inhibitor Verapamil44 (Fig. S17†), revealing the presence of strong fluorescence signals from their nuclei. Time-lapse imaging revealed that fluorescence signals in the nuclei began to appear around 5 min after addition of the Ac2F5-DNB2 pro-probe, reaching a maximum fluorescence intensity after 60 min (Fig. S18†). Close examination of the cell images revealed the presence of low fluorescence levels at the plasma membrane, however these unwanted emissions could be suppressed when Ac2F5-DNB2 pro-probe was used in combination with Verapamil and the lipophilic plasma membrane stain CellMask™ Deep Red (see Fig. 6 and S19–S21†). Treatment of HEK293T cells encoding genes for both HA-PYPNQN-NLS and HA-Halo-NLS with Ac2F5-DNB2 and SiR-Halo45 resulted in fluorescence signals for both probes being co-located in the nuclei, thus confirming the high specificity of F5-DNB2 as a probe for labeling PYP-proteins in the nuclei of these transfected cells (Fig. S22†).
Use of Ac2F5-DNB2 in combination with Verapamil and CellMask™ also enabled the versatility of this new labeling system to be demonstrated for labeling PYP-tag proteins present at the inner surface of the plasma membrane. Therefore, treatment of transfected HEK293T cells expressing PYP-tag constructs of the inner leaflet protein Lyn11-PYPwt with Ac2F5-DNB2, Verapamil and CellMask™ resulted in the construct being clearly imaged at the inner surface of the plasma membrane (Fig. S23†). Therefore, these combined PYP-tag probe labeling results clearly demonstrate that the “OFF–ON” fluorescent switch of the F5-DNB2 probe can be used to fluorescently image PYP-tagged protein constructs in the plasma membranes and nuclei of transfected cells. Statistical analyses revealed that PYPNQN-NLS transfected cells emitted higher intensity fluorescence signals than PYP3R-NLS transfected cells (Fig. 6, S18 & S24†), which is likely due to greater cell expression levels for the PYPNQN-NLS constructs.41
In vivo ON–OFF fluorescent imaging of the proteolytic degradation of a short-lived PYP-tag labeled protein in living cells
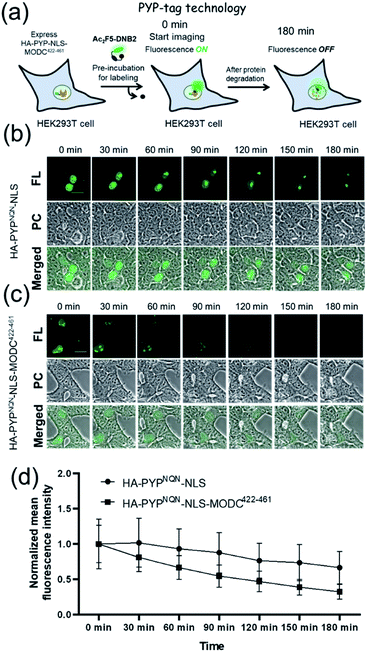
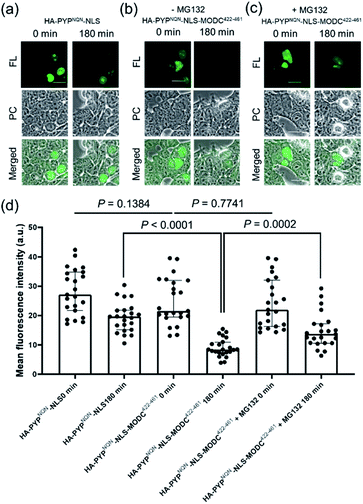
Real-time imaging of the proteolytic degradation of SLPs in cellular systems using an OFF–ON–OFF fluorescence switch is a challenging goal, because the probe needs to rapidly label the SLP before significant SLP degradation occurs. Furthermore, proteolytic hydrolysis of a fluorescent probe–protein conjugate must produce a corresponding rapid turn ‘OFF’ of cellular fluorescence. Mouse ornithine decarboxylase (MODC) was chosen as a potential SLP to explore degradation studies because its C-terminal domain is rich in Pro, Glu, Ser and Thr (PEST sequence) residues that are known to induce rapid proteasomal degradation.46 Efficient proteasomal degradation of the expressed HA-PYPNQN-NLS-MODC422-461 construct in was confirmed by incubating transfected HEK293T cells with 100 μg ml−1 of CHX for 3 h, with western blot analyses of cellular extracts revealing that intact HA-PYPNQN-NLS-MODC422-461 was no longer present (Fig. S25†).47Transfected HEK293T cells expressing HA-PYPNQN-NLS-MODC422-461 were then incubated with Ac2F5-DNB2 for 60 min period before cellular images were acquired. These images revealed the appearance of strong fluorescence signals in the nuclei of cells expressing HA-PYPNQN-NLS-MODC422-461 after 60 min incubation time. Mock-transfected cells (no PYP-tag unit) exhibited no fluorescence when treated with Ac2F5-DNB2 under otherwise identical conditions (Fig. S26†). Excess probe was removed through cell washing prior to imaging to prevent excess probe from labeling any newly synthesized proteins that would potentially interfere with the assay. Time-lapse imaging of the transfected cells using confocal microscopy revealed that the green fluorescence intensity of the cell nuclei decreased steadily over time (Fig. 7). In order to confirm that the observed reduction in fluorescence intensity was due to the MODC422-461 fragment inducing rapid degradation of the PYP-tag construct, we treated cells transfected with HA-PYPNQN-NLS (no MODC422-461) with Ac2F5-DNB2, which only produced a small decrease in fluorescence intensity (Fig. 7). Statistical analysis (Fig. 8d) revealed no significant differences in the mean fluorescence intensities of the fluorescence data of cells expressing HA-PYPNQN-NLS and HA-PYPNQN-NLS-MODC422-461 that had been pre-incubated with Ac2F5-DNB2 for 60 min (corresponding to 0 min time point in Fig. 8). However, a significant difference in the mean fluorescence intensities of the Ac2F5-DNB2 treated cells was observed after 180 min (Fig. 8), with proteolytic degradation of the HA-PYPNQN-NLS-MODC422-461 construct producing significant losses in cell fluorescence intensity levels when compared to the HA-PYPNQN-NLS control cells. To further confirm that the decrease in fluorescence intensity of the HA-PYPNQN-NLS-MODC422-461 transfected cells over time was caused by protein degradation, we then performed live-cell imaging of HA-PYPNQN-NLS-MODC422-461 cells in the presence of 10 μM of the proteasome inhibitor MG132,23,48 which resulted in cell fluorescence intensity losses being suppressed (Fig. 8). Western blot analyses also revealed that HA-PYPNQN-NLS-MODC422-461 underwent protein degradation in the presence of CHX, with protein expression recovered in the presence of MG132 (Fig. S27†). Furthermore, washing cells that had been incubated for 180 min to allow protein degradation to occur did not result in a significant reduction in cell fluorescence. This indicates that reductions in fluorescence are not caused through washing of probe fragments out of the cells but are instead a result of the ON–OFF quenching switch of the Ac2F5-DNB2 probe (Fig. S28†). Analysis of the fluorescence decay curve of probe treated cells enabled the half-life (t1/2) of the HA-PYPNQN-NLS-MODC422-461 fusion protein to be estimated at around 107 min (Fig. S29†), which is comparable to the previously reported t1/2 value for EGFP-MODC422-461 of ∼120 min.46 Therefore, all of the combined fluorescence and western blotting studies indicate that the Ac2F5-DNB2 can function as an efficient pro-probe for imaging real-time PYP-tag–protein degradation in cells.
The advantage of using our new “OFF–ON–OFF” based PYP-tag protein imaging system to visualize protein degradation in real time was then demonstrated by carrying out comparative SLP degradation studies on HEK293T cell lines expressing Halo- and SNAP-tag-fused MODC proteins, respectively. Time-lapse fluorescence imaging of transfected cells expressing HA-Halo-NLS-MODC422-461 and HA-SNAP-NLS-MODC422-461 in the presence of their corresponding SiR-Halo and SiR-SNAP probes,45 revealed that the fluorescence intensities of their cell nuclei remained essentially unchanged after 180 min (Fig. S30†). Western blot studies on cell extracts confirmed that the HA-Halo-NLS-MODC422-461 and HA-SNAP-NLS-MODC422-461 protein constructs had been degraded (Fig. S31†),48 whilst multiple cell washings did not reduce the fluorescence intensities of their cell nuclei (Fig. S32†). Moreover, time-lapse imaging of transfected cells expressing HA-SNAP-NLS-MODC422-461 using SiR-SNAP in presence of 100 μg ml−1 of CHX revealed that considerable fluorescent signals were still observed in the nuclei after 180 min, indicating that the persistent signals are not caused by additional labeling reactions of newly synthesized the SNAP-tagged proteins but by undiffused SiR bound to the decomposed protein fragments (Fig. S33†). Furthermore, time-lapse imaging of cells co-expressing HA-SNAP-NLS-MODC422-461 and HA-PYPNQN-NLS-MODC422-461 in the presence of both SiR-SNAP and Ac2F5-DNB2 probes revealed a steady decrease in the green fluorescence signal for Ac2F5-DNB2, with no change observed in the far-red fluorescence intensity levels from SiR-SNAP (Fig. S34†).
These results indicate that the new OFF–ON–OFF fluorescence PYP-tag imaging system described in this study offers a convenient tool for pulse-chase fluorescence imaging of protein degradation that can be performed without complicated procedures and/or protein synthesis attenuation. Potential uses of the HA-PYPNQN-NLS-MODC422-461 constructs and the Ac2F5-DNB2 pro-probe include its use as an assay system to enable screening of proteasome inhibitors using live-cell fluorescence imaging. This new imaging technology may also be useful for the development of new PROTAC systems that require effective high-throughput assays to determine the effect of drug candidates on target-protein degradation rates in living cells. Finally, it could also potentially be used to study the effects of mutations on protein stability levels in living cells, thus providing crucial information of the effect of mutant proteins on cell pathways whose disruption can lead to disease.
Conclusions
This study describes a new “OFF–ON–OFF” fluorescent probe that can be used to label PYP-tag protein conjugates to enable visualization of protein expression and degradation in living cells in real time. Non-fluorescent trifunctional probes containing a coumarin PYP-tag ligand binding unit connected to a fluorescein fluorophore and a dinitroaryl quenching unit have been used to effectively label PYP-tag–proteins in cells. The fluorescence response of the unbound probe is turned OFF by intramolecular quenching effects that are disrupted when the probe covalently binds to the hydrophobic binding pocket of a PYP-tag–protein. This enables an optimal F5-DNB2 probe to be used for the rapid ‘no wash’ fluorescent labeling of mutant PYP-tag-EGFR constructs in the plasma membranes of cells. A plasma membrane permeable pro-probe variant (Ac2F5-DNB2), that is hydrolyzed to F5-DNB2 by esterases in the cell has also been used to visualize a PYP-tag protein present in the inner leaflet of the cytoplasm membrane. The OFF–ON–OFF fluorescence switch of the F5-DNB2 probe has also been used to visualize the expression (fluorescence ‘ON’) and proteolytic degradation (fluorescence ‘OFF’) of a PYP-tag conjugate of a short-lived protein (mouse ornithine decarboxylase) in cell nuclei in real time. The rapid protein labeling kinetics, high fluorescent intensities and modular nature of this new probe system means it should find widespread use for real-time fluorescence visualization of the expression/degradation of a wide range of short-lived PYP-tag proteins, thus enabling it to be used as a diagnostic tool to inform numerous biological studies and drug discovery programs.The future perspective of this current study is to develop a more efficient biosensor for imaging and quantification of protein degradation in living system by modulating probe structure applicable to ratiometric imaging, which gives more quantitative information.
Data availability
All data needed to evaluate the conclusions in the paper are present in the paper and/or ESI.†Author contributions
S. I. R., T. K., K. Y., and M. N. performed experiments. S. I. R., T. K., K. Y., Y. H., K. K., and S. D. B. analyzed the data. S. I. R. and Y. H. co-wrote the initial draft. S. I. R., S. D. B., Y. H., and K. K. revised the final manuscript. The project was supervised by Y. H., and K. K.Conflicts of interest
There are no conflicts to declare.Acknowledgements
This research was supported by the JSPS KAKENHI (Grant Numbers: JP17H06409 “Frontier Research on Chemical Communications”, JP18H03935 and 19K22255 to K. K.; and JP17H02210, JP18K19402, and JP20H02879 to Y. H.), JSPS A3 Foresight Program, JSPS Asian CORE Program, “Asian Chemical Biology Initiative”, Japan (JSPS)–UK (RSC) Research Cooperative Program (JPJSBP120195705 to K. K.), AMED-CREST, and Toray Science Foundation (19-6008). S. I. R. would like to thank JSPS (P18116) and TBRF (TBRF-RF-123) for postdoctoral fellowship. S. D. B. would like to thank the Royal Society for an International Exchange Grant (IEC\R3\183068).Notes and references
- A. L. Goldberg, Nature, 2003, 426, 895–899 CrossRef CAS PubMed.
- A. Ciechanover, Cell Death Differ., 2005, 12, 1178–1190 CrossRef CAS PubMed.
- A. Bachmair, D. Finley and A. Varshavsky, Science, 1986, 234, 179–186 CrossRef CAS PubMed.
- A. von Mikecz, Nucleus, 2014, 5, 311–317 CrossRef PubMed.
- A. Aguzzi and T. O'Connor, Nat. Rev. Drug Discovery, 2010, 9, 237–248 CrossRef CAS PubMed.
- K.-H. Lee, P. Zhang, H. J. Kim, D. M. Mitrea, M. Sarkar, B. D. Freibaum, J. Cika, M. Coughlin, J. Messing, A. Molliex, B. A. Maxwell, N. C. Kim, J. Temirov, J. Moore, R.-M. Kolaitis, T. I. Shaw, B. Bai, J. Peng, R. W. Kriwacki and J. P. Taylor, Cell, 2016, 167, 774–788 CrossRef CAS PubMed.
- W. E. Balch, R. I. Morimoto, A. Dillin and J. W. Kelly, Science, 2008, 319, 916–919 CrossRef CAS PubMed.
- T. Gidalevitz, E. A. Kikis and R. I. Morimoto, Curr. Opin. Struct. Biol., 2010, 20, 23–32 CrossRef CAS PubMed.
- A. Varshavsky, J. Biol. Chem., 2008, 283, 34469–34489 CrossRef CAS PubMed.
- A. Ciechanover, Nat. Rev. Mol. Cell Biol., 2005, 6, 79–87 CrossRef CAS PubMed.
- E. K. Schrader, K. G. Harstad and A. Matouschek, Nat. Chem. Biol., 2009, 5, 815–822 CrossRef CAS PubMed.
- M. Toure and C. M. Crews, Angew. Chem., Int. Ed. Engl., 2016, 55, 1966–1973 CrossRef CAS PubMed.
- Y. Naro, K. Darrah and A. Deiters, J. Am. Chem. Soc., 2020, 142, 2193–2197 CrossRef CAS PubMed.
- S. M. Banik, K. Pedram, S. Wisnovsky, G. Ahn, N. M. Riley and C. R. Bertozzi, Nature, 2020, 584, 291–297 CrossRef CAS PubMed.
- N. Ohoka, K. Okuhira, M. Ito, K. Nagai, N. Shibata, T. Hattori, O. Ujikawa, K. Shimokawa, O. Sano, R. Koyama, H. Fujita, M. Teratani, H. Matsumoto, Y. Imaeda, H. Nara, N. Cho and M. Naito, J. Biol. Chem., 2017, 292, 4556–4570 CrossRef CAS PubMed.
- P. P. Chamberlain and L. G. Hamann, Nat. Chem. Biol., 2019, 15, 937–944 CrossRef CAS PubMed.
- G. M. Burslem and C. M. Crews, Cell, 2020, 181, 102–114 CrossRef CAS PubMed.
- T. Wu, H. Yoon, Y. Xiong, S. E. Dixon-Clarke, R. P. Nowak and E. S. Fischer, Nat. Struct. Mol. Biol., 2020, 27, 605–614 CrossRef CAS PubMed.
- M. A. Eldeeb, R. S. Piragasam, M. A. Ragheb, M. Esmaili, M. Salla and R. P. Fahlman, J. Neurochem., 2019, 151, 520–533 CrossRef CAS PubMed.
- E. Zavodszky and R. S. Hegde, Elife, 2019, 8, e46740 CrossRef PubMed.
- X. Li, Y. Fang, X. Zhao, X. Jiang, T. Duong and S. R. Kain, J. Biol. Chem., 1999, 274, 21244–21250 CrossRef CAS PubMed.
- M. Halter, A. Tona, K. Bhadriraju, A. L. Plant and J. T. Elliott, Cytometry, Part A, 2007, 71, 827–834 CrossRef PubMed.
- F. Frottin, F. Schueder, S. Tiwary, R. Gupta, R. Körner, T. Schlichthaerle, J. Cox, R. Jungmann, F. U. Hartl and M. S. Hipp, Science, 2019, 365, 342–347 CrossRef CAS PubMed.
- L. Zhang, N. G. Gurskaya, E. M. Merzlyak, D. B. Staroverov, N. N. Mudrik, O. N. Samarkina, L. M. Vinokurov, S. Lukyanov and K. A. Lukyanov, Biotechniques, 2007, 42, 446–450 CrossRef CAS PubMed.
- X. Jiang, P. Coffino and X. Li, Genome Biol., 2004, 5, R81 CrossRef PubMed.
- X. Song, T. Zhou, H. Jia, X. Guo, X. Zhang, P. Han and J. Sha, PLoS One, 2011, 6, e27836 CrossRef CAS PubMed.
- A. Keppler, S. Gendreizig, T. Gronemeyer, H. Pick, H. Vogel and K. Johnsson, Nat. Biotechnol., 2003, 21, 86–89 CrossRef CAS PubMed.
- A. Gautier, A. Juillerat, C. Heinis, I. R. Corrêa, M. Kindermann, F. Beaufils and K. Johnsson, Chem. Biol., 2008, 15, 128–136 CrossRef CAS PubMed.
- G. V. Los, L. P. Encell, M. G. McDougall, D. D. Hartzell, N. Karassina, C. Zimprich, M. G. Wood, R. Learish, R. F. Ohana, M. Urh, D. Simpson, J. Mendez, K. Zimmerman, P. Otto, G. Vidugiris, J. Zhu, A. Darzins, D. H. Klaubert, R. F. Bulleit and K. V. Wood, ACS Chem. Biol., 2008, 6, 373–382 CrossRef PubMed.
- S. Mizukami, S. Watanabe, Y. Hori and K. Kikuchi, J. Am. Chem. Soc., 2009, 131, 5016–5017 CrossRef CAS PubMed.
- Y. Hori and K. Kikuchi, Curr. Opin. Chem. Biol., 2013, 17, 644–650 CrossRef CAS PubMed.
- J. Gao, Y. Hori, O. Takeuchi and K. Kikuchi, Bioconjugate Chem., 2020, 31, 577–583 CrossRef CAS PubMed.
- L. D. Lavis, Annu. Rev. Biochem., 2017, 86, 825–843 CrossRef CAS PubMed.
- L. Wang, W. Du, Z. Hu, K. Uvdal, L. Li and W. Huang, Angew. Chem., Int. Ed., 2019, 58, 14026–14043 CrossRef CAS PubMed.
- H. Takakusa, K. Kikuchi, Y. Urano, T. Higuchi and T. Nagano, Anal. Chem., 2001, 73, 939–942 CrossRef CAS PubMed.
- Y. Hori, H. Ueno, S. Mizukami and K. Kikuchi, J. Am. Chem. Soc., 2009, 131, 16610–16611 CrossRef CAS PubMed.
- Y. Hori, K. Nakaki, M. Sato, S. Mizukami and K. Kikuchi, Angew. Chem., Int. Ed., 2012, 51, 5611–5614 CrossRef CAS PubMed.
- S. Hirayama, Y. Hori, Z. Benedek, T. Suzuki and K. Kikuchi, Nat. Chem. Biol., 2016, 12, 853–859 CrossRef CAS PubMed.
- Y. Hori, S. Hirayama and K. Kikuchi, Philos. Trans. R. Soc., A, 2017, 375, 20170018 CrossRef PubMed.
- Y. Hori, S. Hirayama, M. Sato and K. Kikuchi, Angew. Chem., Int. Ed., 2015, 54, 14368–14371 CrossRef CAS PubMed.
- J. Gao, Y. Hori, M. Nishiura, M. Bordy, J. Hasserodt and K. Kikuchi, Chem. Lett., 2020, 49, 232–235 CrossRef CAS.
- B. Rotman and B. W. Papermaster, Proc. Natl. Acad. Sci. U. S. A., 1966, 55, 134–141 CrossRef CAS PubMed.
- Y. Kamikawa, Y. Hori, K. Yamashita, L. Jin, S. Hirayama, D. M. Standley and K. Kikuchi, Chem. Sci., 2016, 7, 308–314 RSC.
- G. Lukinaviĉius, C. Blaukopf, E. Pershagen, A. Schena, L. Reymond, E. Derivery, M. Gonzalez-Gaitan, E. D'Este, S. W. Hell, D. W. Gerlich and K. Johnsson, Nat. Commun., 2015, 6, 8497 CrossRef PubMed.
- G. Lukinavičius, K. Umezawa, N. Olivier, A. Honigmann, G. Yang, T. Plass, V. Mueller, L. Reymond, I. R. Corrêa Jr, Z.-G. Luo, C. Schultz, E. A. Lemke, P. Heppenstall, C. Eggeling, S. Manley and K. Johnsson, Nat. Chem., 2013, 5, 132–139 CrossRef PubMed.
- X. Li, X. Zhao, Y. Fang, X. Jiang, T. Duong, C. Fan, C.-C. Huang and S. R. Kain, J. Biol. Chem., 1998, 273, 34970–34975 CrossRef CAS PubMed.
- M. A. Hoyt, M. Zhang and P. Coffino, J. Biol. Chem., 2003, 278, 12135–12143 CrossRef CAS PubMed.
- D. H. Lee and A. L. Goldberg, Trends Cell Biol., 1998, 8, 397–403 CrossRef CAS PubMed.
Footnote |
| † Electronic supplementary information (ESI) available. See DOI: 10.1039/d1sc06274c |
| This journal is © The Royal Society of Chemistry 2022 |

