 Open Access Article
Oxime formation coordination-directed detection of genome-wide thymine oxides with nanogram-scale sample input†
Feng
Xiao‡
a,
Qi
Wang‡
a,
Kaiyuan
Zhang
a,
Chaoxing
Liu
 b,
Guangrong
Zou
*a and
Xiang
Zhou
 *a
*a
aCollege of Chemistry and Molecular Sciences, Key Laboratory of Biomedical Polymers-Ministry of Education, Wuhan University, Wuhan, Hubei 430072, P. R. China. E-mail: xzhou@whu.edu.cn
bUniversity of California, Riverside Department of Chemistry, USA
First published on 19th July 2022
Abstract
Natural chemical modifications of nucleic acids play a vital role in life processes. Compared to other epigenetic modifications, there are multiple ways to quantify the methylated derivatives of cytosine. However, simple and convenient methods for detecting and quantifying thymine derivatives are scarce because they are found in tiny quantities in biological systems. Additionally, exploring easy ways to detect these derivatives can also throw light on their biological significance. This manuscript reports a novel strategy to quantify 5-formyluracil (5fU) and 5-hydroxymethyluracil (5hmU). Differences between modified and unmodified bases are accumulated and amplified by arranging phi29 DNA polymerase to repeat through a circular template labeled thymidine. In combination with real-time quantitative rolling circle amplification (RCA), low-abundance thymine oxides can be quantified precisely. The global levels of 5fU and 5hmU were analyzed in different biological samples, using only 40 ng of sample input on a laboratory real-time PCR instrument. The reported strategy was executed hassle-free and, in principle, can be extended to design methods for detecting other epigenetic modifications in nucleotides that are rare in biological systems.
Introduction
In addition to oxidized cytosine derivatives, cells also harbor natural thymidine (T)-modified nucleosides 5-hydroxymethyl-uracil (5hmU) and 5-formyluracil (5fU).1–3 Generated by enzyme-mediated or non-enzymatic pathways, they are present in the genomic DNA of various organisms ranging from bacteriophages to mammals.4,5 As the modified nucleobase counterpart of 5-formylcytosine (5fC),6–10 5fU has garnered significant interest from researchers. The fact that some tumors have been reported to have higher levels of 5fU than adjacent normal tissue has increased the importance of these derivatives.11 5fU is mainly obtained from thymine oxidation by UV light, reactive oxygen species, hydrogen peroxide, and other oxidants.12–15 It can cause gene mismatch, miscoding, alteration of DNA structures, and interference with DNA–protein interactions.16,17 Different forms of 5fU and 5hmU are synthesized by two different pathways in biological organisms, i.e., by deamination of 5hmC by AID/APOBEC enzymes,18,19 and by oxidization of thymine by ten-eleven translocation enzymes.5 All of this suggests that 5hmU and 5fU have specific functions other than triggering DNA repair. Because of their extremely low abundance in genomes and the subtle differences in their structures, there are very few methods for detecting and quantifying them effectively and accurately.20,21 Additionally, most assays/methods cannot ensure high sensitivity as well as cost efficiency with nanogram-scale sample input.PCR based quantitative detection methods mainly rely on the inability of modified bases and their derivatives to the polymerase-mediated amplification,22–24 but are usually performed under cyclic temperature-controlled conditions and require a long amplification time (1–2 h). Quantitative detection methods based on Liquid Chromatography with Mass Spectrometry (LC-MS) are widely accepted and highly reliable. Generally, after oligonucleotides are degraded into nucleotides, they are separated by chromatography and are then quantified by MS. Various chemical derivatization and enrichment methods have been developed to improve the sensitivity of detection.11,12,25,26 However, expensive instrumentation, high sample input (1–10 μg), and lengthy analysis time (>24 h) limit its widespread application. Compared with LC-MS-based quantitative methods, fluorescence-based quantitative methods have the advantage of being more economical and convenient.27–35 The chemical structure of 5fU contains an aldehyde group on the pyrimidine ring that can be modified with amine, hydrazine, aminoxyl, and indantrione derivatives.36–38 Besides, 5hmU can also be easily oxidized to 5fU by KRuO4.39 However, 5fC and an abasic site (AP site) contain an aldehyde group in their structure, similar to 5fU. Thus, it is challenging to find an appropriate chemical reagent to selectively label and detect 5fU and 5hmU throughout the genome without any interference from 5fC and AP. In addition, traditional probes are usually in excess and have strong background fluorescence affecting the detection limit. Therefore, we aimed to selectively label 5fU to avoid the fluorescent background and then use rolling circle amplification (RCA) to generate a detectable signal.
RCA is a convenient and efficient isothermal enzymatic process for generating long strands of DNA and RNA.40,41 In this process, a linked circular DNA is used as a template by phi29 DNA polymerase that produces a long single strand containing many concatenated copies, complementary to the template.42 These strands can be up to tens of thousands of nucleotides (nt) in length.42 As the RCA involves mild isothermal reactions and amplification of the target signal during point-of-care detection, plenty of methods have been developed for detecting DNA, RNA, and proteins.43–50 Herein, we have proposed a strategy called OFCRCA (Oxime Formation Coordinated Rolling Circle Amplification) to detect thymine oxides (mainly 5hmU and 5fU) in genomic DNA with nanogram-scale sample input. Firstly, endogenous 5fU was labeled specifically by 2-(aminooxy)-N-(quinolin-8-yl)acetamide (AQA) under neutral reaction conditions. On the other hand, 5hmU was first oxidized to 5fU and then reacted with AQA for selective labeling. Then, DNA containing 5fU–AQA was ligated with hairpin adaptors to form a circular template for RCA reaction to accumulate the different extension rates of phi29 DNA polymerase on labeled and unlabeled bases. 5hmU and 5fU could then be qualitatively and quantitatively assessed by determining the difference in the slope of the fluorescence signal growth curve between samples with and without AQA labeling (Fig. 1).
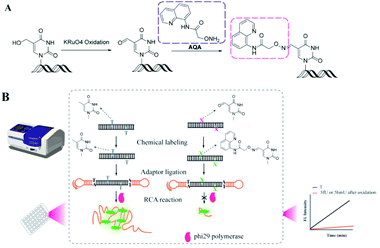 | ||
| Fig. 1 The OFCRCA strategy for detecting genome-wide thymine oxides. (A) Oxidation of 5hmU and AQA labeling of 5fU. (B) Rationale for signal generation by the OFCRCA strategy. | ||
Results and discussion
We started by examining the selectivity and efficiency of reactions of AQA to a series of DNAs (15 nt-5fU, 15 nt-5fC, 15 nt-AP, and 15 nt-T in Table S1†). After the ethanol precipitation step, the final DNA products were analyzed by 20% denatured PAGE. Under the natural reaction conditions, only the single band in the lane of 5fU migrated slowly compared to other lanes due to an increase in molecular weight due to AQA labeling (Fig. S1†). The PAGE results show that 5fU could be labeled by AQA specifically, unlike other bases.4 Further, Matrix-Assisted Laser Desorption Ionization Time of Flight Mass Spectrometry (MALDI-TOF-MS) data also indicated the formation of the desired 5fU–AQA nucleotide product (Fig. S2†). Two DNA strands (15 nt-EA and 28 nt-EB) containing 5fU sites were designed, and phi29 DNA polymerase was used for chain extension experiments to verify if selective labeling of 5fU by AQA has a blocking effect on the polymerase reaction (Fig. S3†). As expected, primers could hardly be extended to full length with the template of DNA modified with AQA (lane 2). However, significant extension efficiency was observed in the group of DNA templates that were not labeled with AQA.We prepared a model to verify the OFCRCA strategy further. Two 80 bp DNA strands, one containing two 5fU sites in the duplex and the other with thymines at the same positions, were generated by PCR amplification. Post AQA labeling and purifying by Spin Column Wash Tubes, the 80 bp DNA products were ligated with a predesigned hairpin adaptor (SL). The ratio between DNA and adaptors was first optimized to guarantee high ligation efficiency. It was observed that a ratio of 1![[thin space (1/6-em)]](https://www.rsc.org/images/entities/char_2009.gif) :
:![[thin space (1/6-em)]](https://www.rsc.org/images/entities/char_2009.gif) 4 (DNA
4 (DNA![[thin space (1/6-em)]](https://www.rsc.org/images/entities/char_2009.gif) :
:![[thin space (1/6-em)]](https://www.rsc.org/images/entities/char_2009.gif) adaptor) results in a relatively good connection efficiency (Fig. S4†). Next, the conditions for amplification reactions were also optimized, including the ratio of template DNA and primer and the concentration of phi29 DNA polymerase (Fig. S5†). To ensure the correct RCA reaction, we cut the RCA product with a restriction enzyme Eam1104, which has a restriction site in the SL adaptor, after adding the second primer (SPSL). The digested products were then subjected to PAGE analysis. The main products obtained were 130 bp and 260 bp in length, corresponding to the chain with two ligated adaptors (Fig. S6†). The appearance of the 260 bp band was attributed to insufficient degradation. Under optimal conditions, the fluorescence intensity from RCA increased linearly with similar slopes with increasing reaction time. This result confirmed no significant polymerization efficiencies for DNA–T, DNA–5fU, DNA–5hmU, and DNA–5fU from DNA–5hmU oxidation (Fig. 2A). DNA templates without adaptor ligation showed almost no fluorescent signal (Fig. S7†). The slopes and R2 values from all possible fits were arranged. In the fluorescence curve of a typical RCA reaction, a high correlation coefficient can be obtained by collecting data in 10 min (Fig. 2B–D, and Table S2,†R2 > 0.9995).
adaptor) results in a relatively good connection efficiency (Fig. S4†). Next, the conditions for amplification reactions were also optimized, including the ratio of template DNA and primer and the concentration of phi29 DNA polymerase (Fig. S5†). To ensure the correct RCA reaction, we cut the RCA product with a restriction enzyme Eam1104, which has a restriction site in the SL adaptor, after adding the second primer (SPSL). The digested products were then subjected to PAGE analysis. The main products obtained were 130 bp and 260 bp in length, corresponding to the chain with two ligated adaptors (Fig. S6†). The appearance of the 260 bp band was attributed to insufficient degradation. Under optimal conditions, the fluorescence intensity from RCA increased linearly with similar slopes with increasing reaction time. This result confirmed no significant polymerization efficiencies for DNA–T, DNA–5fU, DNA–5hmU, and DNA–5fU from DNA–5hmU oxidation (Fig. 2A). DNA templates without adaptor ligation showed almost no fluorescent signal (Fig. S7†). The slopes and R2 values from all possible fits were arranged. In the fluorescence curve of a typical RCA reaction, a high correlation coefficient can be obtained by collecting data in 10 min (Fig. 2B–D, and Table S2,†R2 > 0.9995).
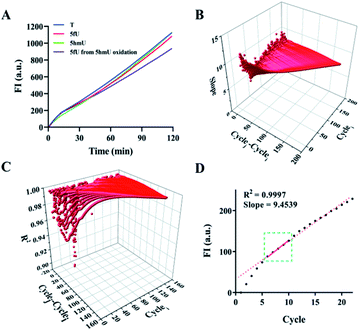 | ||
| Fig. 2 Effect of DNA modification on the polymerization efficiency of polymerase. (A) Time-dependent fluorescence spectra of the RCA reactions with DNA–T, DNA–5fU, DNA–5hmU, and DNA–5fU from 5hmU oxidation. (B) Data processing for calculating all the slopes from the plot of the RCA reaction with DNA–T; cyclei represents the initial screening cycle site; cyclej represents the final screening cycle site; cyclej–cyclei represents the selected computation interval (see the ESI for details†). (C) Data processing for screening R2. (D) The screened confidence interval in the plot of the RCA reaction with DNA–T. | ||
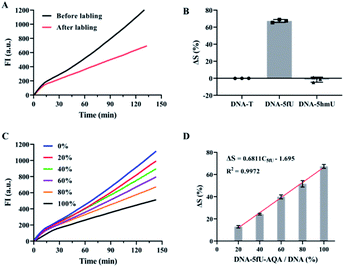
Compared with DNA–5fU templates without chemical labeling, the slope of the DNA–5fU template modified with AQA was reduced by about 67% (Fig. 3A). However, the slope of DNA–T and DNA–5hmU showed no significant differences post-reaction with AQA under the same conditions (Fig. 3B). We then attempted to get a linear correlation between 5fU content and the efficiency difference of polymerization reaction (ΔS) for quantitative estimation of 5fU. The correlation indicated that with the increase in DNA–5fU–AQA content (C5fU, mixed samples with different proportions of DNA–5fU–AQA and DNA–T), the polymerization efficiency of phi29 DNA polymerase was considerably reduced. This trend was consistent with the results of previous chain extension experiments (Fig. 3C). Correspondingly, ΔS increased linearly from 12.9 to 67.3%, with an increase in C5fU from 20 to 100%. The linear equation can represent the perfect fit of the regression line, ΔS = 0.6811C5fU − 1.695 (R2 = 0.9972, Fig. 3D), indicating that the 5fU content can be calculated from the ΔS value. The detection limit was 5.15% for DNA–5fU–AQA (at 3SD/slope), representing 8.24 fmol of 5fU. These results indicated the promising potential of OFCRCA for the genome-wide detection of 5fU. The main challenge for quantitative detection of 5fU in genetic samples is the high variation in the types of modified bases, the limited abundance of 5fU, and the variation in different cell types.
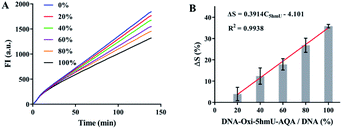
The success of OFCRCA in detecting 5fU prompted us further to extend this method to the quantification of 5hmU. To evaluate the exact content of 5hmU in different samples, we plotted a linear curve of the decrease in the polymerization efficiency of phi29 DNA polymerase caused by the varying concentrations of DNA–5fU–AQA (oxidized from DNA–5hmU) (Fig. 4A). The equation represented the perfect fit of the regression line, ΔS = 0.3914C5fU − 4.101 (R2 = 0.9938, Fig. 4B), indicating that the 5hmU content could also be calculated from the ΔS value.
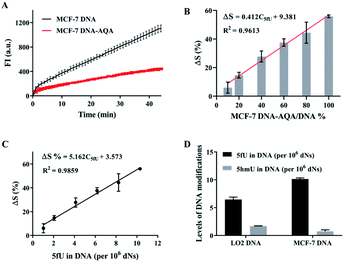
The reliability of OFCRCA was verified by quantifying three artificially prepared DNA–5fU samples in parallel (n = 3) before applying the strategy for detecting 5fU in the genome. The results showed 94.5–112.4% recovery with small relative standard deviations (Table S3†), which confirmed the accuracy of this method. The high accuracy of the method encouraged us to extend the method to quantify 5fU in biological samples. First, genomic dsDNA extracted from MCF-7 cells was used to construct a quantitative calibration curve to detect genomic 5fU. The dsDNA (extracted from MCF-7) was then sheared into small dsDNA fragments (about 200 bps) using ultrasound following the manufacturer's instructions (Fig. S8†). The formed dsDNA fragments were subjected to NEBNext ultra end repair and dA-tailing, followed by ligation to SL. Amplification reactions with the genomic sample before and after their reaction with AQA showed a clear polymerization efficiency difference, with about 55.9% reduction in the slope of the time-dependent fluorescence spectrum (Fig. 5A). The decrease in the slope represents the global 5fU levels in MCF-7 dsDNA (0.00103% in DNA), which was quantified by LC-MS (Fig. S9†). A quantitative calibration plot for 5fU in genomic DNA was obtained by analyzing the gradual dilution of AQA-tagged MCF-7 dsDNA fragments. The ΔS increased linearly with the 5fU content in the range of 0.000103–0.001030%, with a linear correlation of ΔS = 5.162C5fU + 3.573 (R2 = 0.9859, Fig. 5B and C). The content of 5fU was quantified to be 6.5 per106 dNs in LO2 genomic DNA and 10.1 per106 dNs in MCF-7 genomic DNA (Fig. 5D). The relative error of quantitative detection for 5fU levels in LO2 genomic DNA by OFCRCA was −28.6%.
The reliability of this improved method was assessed by determining the 5hmU content in DNA. Three artificially prepared DNA samples with different 5hmU concentrations were examined. The results showed a recovery in the 93.4–112.8% range, which implied that this method of determining 5hmU was accurate and reliable (Table S4†). The applicability of the improved OFCRCA method was further investigated with biological samples for 5hmU detection in genomic DNA. 5hmU was first oxidized to 5fU using KRuO4.20,51 The genomic DNA of MCF-7 and LO2 was then subjected to OFCRCA to quantify the total 5fU content after oxidation. The 5hmU content was determined by subtracting the amount of 5fU present in the sample before oxidation from the total 5fU content. Consequently, 5hmU was quantified to be 1.68 per106 dNs in LO2 genomic DNA and 0.74 per106 dNs in genomic DNA of MCF-7 (Fig. 5D).
Conclusions
In summary, we have developed a novel OFCRCA strategy capable of sensitively quantifying the global levels of thymine oxides with nanogram scale sample input, including 5hmU and 5fU, that are difficult to quantify by existing methods as they are found in minimal amounts in organisms. The OFCRCA method is reliable, cost-effective, and convenient because multiple samples can be analyzed simultaneously and on one plate with standard laboratory equipment. The strategy will also be a promising option for analyzing numerous samples' thymine oxides and other nucleoside modifications.Author contributions
XZ directed the project. FX and QW performed the main experiments and data analysis. KZ completed oxidation and LC-MS experiments. CL gave experimental advice. FX, GZ and XZ wrote and revised the manuscript.Conflicts of interest
There are no conflicts to declare.Acknowledgements
We thank the National Natural Science Foundation of China for their financial support (grant no. 92153303, 21721005, and 91940000).Notes and references
- Z. Vaníková, M. Janoua ková, M. Kambová, L. Krásný and M. Hocek, Chem. Sci., 2019, 10, 3937–3942 RSC.
- F. Kawasaki, D. Beraldi, R. E. Hardisty, G. R. McInroy, P. van Delft and S. Balasubramanian, Genome Biol., 2017, 18, 23 CrossRef PubMed.
- Q. Zhang, Nucleic Acids Res., 1997, 25, 3969–3973 CrossRef CAS PubMed.
- S. R. Wang, J. Q. Wang, B. S. Fu, K. Chen, W. Xiong, L. Wei, G. Qing, T. Tian and X. Zhou, J. Am. Chem. Soc., 2018, 140, 15842–15849 CrossRef CAS.
- T. Pfaffeneder, F. Spada, M. Wagner, C. Brandmayr, S. K. Laube, D. Eisen, M. Truss, J. Steinbacher, B. Hackner, O. Kotljarova, D. Schuermann, S. Michalakis, O. Kosmatchev, S. Schiesser, B. Steigenberger, N. Raddaoui, G. Kashiwazaki, U. Müller, C. G. Spruijt, M. Vermeulen, H. Leonhardt, P. Schär, M. Müller and T. Carell, Nat. Chem. Biol., 2014, 10, 574–581 CrossRef CAS.
- X. Wu and Y. Zhang, Nat. Rev. Genet., 2017, 18, 517–534 CrossRef CAS PubMed.
- C. G. Spruijt, F. Gnerlich, A. H. Smits, T. Pfaffeneder, P. W. T. C. Jansen, C. Bauer, M. Muenzel, M. Wagner, M. Mueller, F. Khan, H. C. Eberl, A. Mensinga, A. B. Brinkman, K. Lephikov, U. Mueller, J. Walter, R. Boelens, H. van Ingen, H. Leonhardt, T. Carell and M. Vermeulen, Cell, 2013, 152, 1146–1159 CrossRef CAS.
- M. J. Booth, M. R. Branco, G. Ficz, D. Oxley, F. Krueger, W. Reik and S. Balasubramanian, Science, 2012, 336, 934–937 CrossRef CAS PubMed.
- S. Ito, L. Shen, Q. Dai, S. C. Wu, L. B. Collins, J. A. Swenberg, C. He and Y. Zhang, Science, 2011, 333, 1300–1303 CrossRef CAS PubMed.
- D. Chen, Y. Wang, M. Mo, J. Zhang, Y. Zhang, Y. Xu, S. Y. Liu, J. Chen, Y. Ma, L. Zhang, Z. Dai, C. Cai and X. Zou, Nucleic Acids Res., 2019, 47, e119 CrossRef CAS PubMed.
- H. P. Jiang, T. Liu, N. Guo, L. Yu, B. F. Yuan and Y. Q. Feng, Anal. Chim. Acta, 2017, 981, 1–10 CrossRef CAS.
- H. Hong and Y. Wang, Anal. Chem., 2007, 79, 322–326 CrossRef CAS PubMed.
- H. Hong, H. Cao, Y. Wang and Y. Wang, Chem. Res. Toxicol., 2006, 19, 614–621 Search PubMed.
- E. J. Privat and L. C. Sowers, Mutat. Res., 1996, 354, 151–156 CrossRef PubMed.
- H. Kasai, A. Iida, Z. Yamaizumi, S. Nishimura and H. Tanooka, Mutat. Res., 1990, 243, 249 CAS.
- F. Kawasaki, P. Murat, Z. Li, T. Santner and S. Balasubramanian, Chem. Commun., 2017, 53, 1389–1392 RSC.
- D. K. Rogstad, J. Heo, N. Vaidehi, W. A. Goddard, A. Burdzy and L. C. Sowers, Biochemistry, 2004, 43, 5688–5697 CrossRef CAS PubMed.
- J. U. Guo, Y. Su, C. Zhong, G. l. Ming and H. Song, Cell, 2011, 145, 423–434 CrossRef CAS PubMed.
- S. Cortellino, J. Xu, M. Sannai, R. Moore, E. Caretti, A. Cigliano, M. Le Coz, K. Devarajan, A. Wessels, D. Soprano, L. K. Abramowitz, M. S. Bartolomei, F. Rambow, M. R. Bassi, T. Bruno, M. Fanciulli, C. Renner, A. J. Klein-Szanto, Y. Matsumoto, D. Kobi, I. Davidson, C. Alberti, L. Larue and A. Bellacosa, Cell, 2011, 146, 67–79 CrossRef CAS PubMed.
- C. Liu, Y. Chen, Y. Wang, F. Wu, X. Zhang, W. Yang, J. Wang, Y. Chen, Z. He, G. Zou, S. Wang and X. Zhou, Nano Res., 2017, 10, 2449–2458 CrossRef CAS.
- Y. Wang, X. Zhang, G. Zou, S. Peng, C. Liu and X. Zhou, Acc. Chem. Res., 2019, 52, 1016–1024 CrossRef CAS PubMed.
- Y. Wang, C. Liu, X. Zhang, W. Yang, F. Wu, G. Zou, X. Weng and X. Zhou, Chem. Sci., 2018, 9, 3723–3728 RSC.
- Z. Zhang, D. Yang, W. Tian, Y. Qi, W. Ren, Z. Li and C. Liu, Anal. Chem., 2020, 92, 3477–3482 CrossRef CAS PubMed.
- J. A. Sikorsky, D. A. Primerano, T. W. Fenger and J. Denvir, Biochem. Biophys. Res. Commun., 2007, 355, 431–437 CrossRef CAS.
- B. Sudhamalla, D. Dey, M. Breski and K. Islam, Anal. Biochem., 2017, 534, 28–35 CrossRef CAS PubMed.
- Y. Yu, F. Yuan, X. H. Zhang, M. Z. Zhao, Y. L. Zhou and X. X. Zhang, Anal. Chem., 2019, 91, 13047–13053 CrossRef CAS PubMed.
- Q. Zhou, K. Li, L. L. Li, K. K. Yu, H. Zhang, L. Shi, H. Chen and X. Q. Yu, Anal. Chem., 2019, 91, 9366–9370 CrossRef CAS PubMed.
- Y. Wang, C. Liu, W. Yang, G. Zou, X. Zhang, F. Wu, S. Yu, X. Luo and X. Zhou, Chem. Commun., 2018, 54, 1497–1500 RSC.
- C. Liu, Y. Wang, X. Zhang, F. Wu, W. Yang, G. Zou, Q. Yao, J. Wang, Y. Chen, S. Wang and X. Zhou, Chem. Sci., 2017, 8, 4505–4510 RSC.
- B. Samanta, J. Seikowski and C. Höbartner, Angew. Chem., Int. Ed., 2016, 55, 1912–1916 CrossRef CAS PubMed.
- P. Guo, X. Xu, X. Qiu, Y. Zhou, S. Yan, C. Wang, C. Lu, W. Ma, X. Weng, X. Zhang and X. Zhou, Org. Biomol. Chem., 2013, 11, 1610–1613 RSC.
- W. Hirose, K. Sato and A. Matsuda, Angew. Chem., Int. Ed., 2010, 49, 8392–8394 CrossRef CAS PubMed.
- J. Tang, G. Zou, C. Chen, J. Ren, F. Wang and Z. Chen, Anal. Chem., 2021, 93, 16439–16446 CrossRef CAS PubMed.
- W. Yang, S. Han, X. Zhang, Y. Wang, G. Zou, C. Liu, M. Xu and X. Zhou, Anal. Chem., 2021, 93, 15445–15451 CrossRef CAS PubMed.
- Q. Wang, H. Yin, J. Ding, Y. Zhou and S. Ai, ACS Appl. Nano Mater., 2021, 4, 8998–9007 CrossRef CAS.
- B. Xia, D. Han, X. Lu, Z. Sun, A. Zhou, Q. Yin, H. Zeng, M. Liu, X. Jiang, W. Xie, C. He and C. Yi, Nat. Methods, 2015, 12, 1047–1050 CrossRef CAS PubMed.
- L. Xu, Y. C. Chen, S. Nakajima, J. Chong, L. Wang, L. Lan, C. Zhang and D. Wang, Chem. Sci., 2014, 5, 567–574 RSC.
- E.-A. Raiber, D. Beraldi, G. Ficz, H. E. Burgess, M. R. Branco, P. Murat, D. Oxley, M. J. Booth, W. Reik and S. Balasubramanian, Genome Biol., 2012, 13, R69 CrossRef PubMed.
- R. E. Hardisty, F. Kawasaki, A. B. Sahakyan and S. Balasubramanian, J. Am. Chem. Soc., 2015, 137, 9270–9272 CrossRef CAS PubMed.
- J. B. Lee, J. Hong, D. K. Bonner, Z. Poon and P. T. Hammond, Nat. Mater., 2012, 11, 316–322 CrossRef CAS PubMed.
- H. Kuhn, Nucleic Acids Res., 2002, 30, 574–580 CrossRef CAS PubMed.
- B. Joffroy, Y. O. Uca, D. Prešern, J. P. K. Doye and T. L. Schmidt, Nucleic Acids Res., 2017, 46, 538–545 CrossRef PubMed.
- M. M. Ali, F. Li, Z. Zhang, K. Zhang, D. K. Kang, J. A. Ankrum, X. C. Le and W. Zhao, Chem. Soc. Rev., 2014, 43, 3324 RSC.
- W. Zhao, M. M. Ali, M. A. Brook and Y. Li, Angew. Chem., Int. Ed., 2008, 47, 6330–6337 CrossRef CAS PubMed.
- O. Soderberg, M. Gullberg, M. Jarvius, K. Ridderstrale, K. J. Leuchowius, J. Jarvius, K. Wester, P. Hydbring, F. Bahram, L. G. Larsson and U. Landegren, Nat. Methods, 2006, 3, 995–1000 CrossRef PubMed.
- P. M. Lizardi, X. H. Huang, Z. R. Zhu, P. Bray-Ward, D. C. Thomas and D. C. Ward, Nat. Genet., 1998, 19, 225–232 CrossRef CAS PubMed.
- F. B. Dean, J. R. Nelson, T. L. Giesler and R. S. Lasken, Genome Res., 2001, 11, 1095–1099 CrossRef CAS PubMed.
- Q. Yao, Y. Wang, J. Wang, S. Chen, H. Liu, Z. Jiang, X. Zhang, S. Liu, Q. Yuan and X. Zhou, ACS Nano, 2018, 12, 6777–6783 CrossRef CAS PubMed.
- D. Ji, M. G. Mohsen, E. M. Harcourt and E. T. Kool, Angew. Chem., Int. Ed., 2016, 55, 2087–2091 CrossRef CAS PubMed.
- B. Schweitzer, S. Wiltshire, J. Lambert, S. ÓMalley, K. Kukanskis, Z. Zhu, S. F. Kingsmore, P. M. Lizardi and D. C. Ward, Proc. Natl. Acad. Sci. U. S. A., 2000, 97, 10113–10119 CrossRef CAS PubMed.
- C. X. Song, K. E. Szulwach, Q. Dai, Y. Fu, S. Q. Mao, L. Lin, C. Street, Y. Li, M. Poidevin, H. Wu, J. Gao, P. Liu, L. Li, G. L. Xu, P. Jin and C. He, Cell, 2013, 153, 678–691 CrossRef CAS.
Footnotes |
| † Electronic supplementary information (ESI) available. See https://doi.org/10.1039/d2sc03013f |
| ‡ These authors contributed equally. |
| This journal is © The Royal Society of Chemistry 2022 |

