 Open Access Article
CRISPR/Cas9-based coronal nanostructures for targeted mitochondria single molecule imaging†
Xuan
Zhao
,
Na
Na
 and
Jin
Ouyang
 *
*
Key Laboratory of Theoretical and Computational Photochemistry, College of Chemistry, Beijing Normal University, Beijing 100875, China. E-mail: jinoyang@bnu.edu.cn
First published on 10th September 2022
Abstract
The biological state at the subcellular level is highly relevant to many diseases, and the monitoring of organelles such as mitochondria is crucial based on this. However, most DNA and protein based nanoprobes used for the detection of mitochondrial RNAs (mitomiRs) lack spatial selectivity, which leads to inefficiencies in probe delivery and signal turn-on. Herein, we constructed a novel DNA nanoprobe named protein delivery nano-corona (PDNC) to improve the delivery efficiency of Cas protein, for spatially selective imaging of mitomiRs in living cells switched on by a CRISPR/Cas system. Combined with a single-molecule counting method, this strategy enables highly sensitive detection of low-abundance mitomiR. Therefore, the strategy in this work opens up new opportunities for cell identification, early clinical diagnosis, and research in biological behaviour at the subcellular level.
Introduction
Mitochondria are critical organelles with a key role in supplying energy in the cell.1,2 It is obvious that mitochondrial abnormalities are associated with a variety of diseases, including metabolic diseases, neurodegenerative disorders, and cancer.3–5 Therefore, it is particularly critical to detect the behavior, distribution and biological state of mitochondria in cells. Considering that mitochondria are widely distributed in the cytoplasm, this places high demands on the specificity and sensitivity of mitochondrial detection and imaging.6 Mitochondrial miRNAs (mitomiRs) are mitochondria-specific miRNAs thought to be involved in a variety of specific cell behaviors in cancer.7–9 This kind of naturally specific target unit in live cells enables a fluorescent probe to catch mitochondria accurately.10,11 Li et al. reported a DNA nanoreporter technology for the imaging of dual mitomiRs in living cells.7 The engineering of biosensors for spatially selective imaging of mitomiRs worth more future investigation.However, the traditional fluorescence methods always face the problem of “always on”, because the fluorescence signal is turned on during the transportation process, which reduces the accuracy and sensitivity of detection.12–15 Fluorescence imaging sensing strategies require the design of a switch to regulate signal turn-on, which has been developing in the field of fluorescence imaging in recent years. In some strategies, enzymes can act as signal switches due to their catalytic function.16,17 Or light has been utilized as a powerful tool to artificially control the signals to turn on. The discovery of UCNPs enables such a strategy to flourish.18–20 Nevertheless, a strategy to automatically turn on the signal when reaching the target position, without additional factors such as lighting control, still needs to be developed.
Clustered Regularly Interspaced Short Palindromic Repeats (CRISPRs) and CRISPR-associated (Cas) systems made a great contribution to establish platforms in enhancing assay sensitivity, specificity, multiplexity, and clinical applications.21–23 CRISPR/Cas system's precise cutting of nucleic acids makes it important molecular scissors in the process of identifying and manipulating nucleic acids.24,25 And, in some reports, the CRISPR/Cas system can respond in a short period of time due to excellent precision and clever controllable strategies.26–28 These properties make it become a candidate for fluorescent signal switches.29–31 But remarkably, when proteins and nucleic acids are the major components of cellular uptake, there are two-sided effects. While biomacromolecules on nanomaterials improve biocompatibility, losses during uptake reduce the delivery efficiency. Therefore, the delivery of the CRISPR/Cas system is a problem worth considering.
Delivery strategies of the CRISPR/Cas system have been organized into two broad categories: viral and non-viral vectors.32,33 Viral vectors may lead to carcinogenesis and immunogenicity. The residual virus and integrated genes will lead to the emergence of new mutations, which limits its clinical application.33 Gold nanoparticles are often used as carriers for in vivo detection probes or therapeutic drugs due to their excellent biocompatibility, which deserves further use.34–36 However, in the process of protein loading on gold nanoparticles, the contact of protein with gold may lead to protein denaturation, which limits the transport efficiency of Cas protein.37–39 Prof. X. Chris Le et al. reported on the construction of a new type of protein corona, termed binding-mediated protein corona.40 The binding-mediated protein corona overcomes both limitations of the traditional protein corona for the delivery of biologically active proteins: irreversible binding and protein leakage.
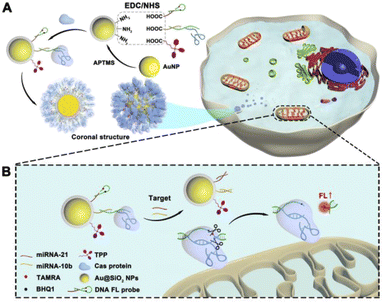
In this work, we reported a DNA nanoprobe technology for spatially selective imaging of mitochondria in living cells switched on by a CRISPR/Cas system. The DNA probes and mitochondrial targeting units triphenylphosphonium (TPP) are attached to silicon-coated gold nanoparticles (AuNPs). AuNPs, as a carrier, loaded with DNA probes, guide RNAs and Cas protein into cells. This sort of multi-layered coronal structure, named protein delivery nano-corona (PDNC), improved the delivery efficiency of Cas protein. Target mitomiRs competed against DNA probes, prompting them to form stable double chains. The CRISPR/Cas system, as DNA scissors, plays the role of a switch to turn on the fluorescent signal in this strategy. Due to the presence of CRISPR/Cas, the fluorescent signal only turned on when the DNA probe reacted with target mitomiRs, which avoids waste during probe transmission and a high background signal, improving the sensitivity of imaging. “Gene scissors” can make the probe generate a signal response in a short period of time, so this kind of rapid imaging detection is beneficial to early clinical diagnosis.41–45 What's more, the lower background signal allows the method to be combined with a single-molecule counting technique46–48 to detect the distribution and behavior of mitochondria, which are important indicators of cancer cells. The sensitive DNA nanoprobe hold promise for ideas to diagnostic imaging of cancer cells.
Results and discussion
Construction and characterization of PDNCs
The coronal structure was established layer by layer. AuNPs, as the core, play the roles of a DNA probe substrate and Cas system vector. To verify the successful synthesis of the coronal structure, we prepared products of different stages of synthesis. As shown in Fig. 1A, Au NPs with a diameter of about 30 nm were synthesized according to conventional methods. In order to prevent the protein from being close to the nano-metal particle surface, resulting in the irreversible denaturation of the protein, we tried to coat a silicon shell on the surface of the AuNPs. The TEM image in Fig. 1A demonstrates the successful encapsulation of the silicon shell, when the DLS data show the variation in particle size (Fig. 1B and C), which is consistent with the TEM image. Moreover, as shown in Fig. 1D, the scanning transmission electron microscopy (STEM) images show the uniform distribution of multiple elements (Au, N and Si), which also proved the successful synthesis of AuNPs@SiO2.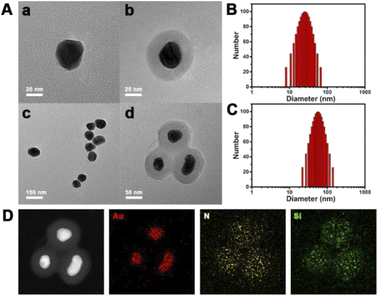 | ||
| Fig. 1 (A) TEM image and (B) and (C) DLS data of AuNPs and AuNPs@SiO2. (D) TEM mapping of AuNPs@SiO2. | ||
Scheme 1A shows the process of PDNC construction. Firstly, the inner crown, which mainly consists of the DNA probe and guide RNA of Cas9 protein, was attached to the Au/Si substrate. Since the main component of the silicon shell is APTMS, the amino group on it provided site groups for the subsequent connection of the DNA inner crown. The EDC/NHS cross-linking method was used to link the substrate material with DNA chains. As shown in Fig. S1A,† differences in FT-IR spectra mean the success of group modification. The remarkably increased characteristic peaks at 2978 cm−1 correspond to the saturated C–H stretching vibration. The peaks at 1645 cm−1 indicated the presence of amide and C![[double bond, length as m-dash]](https://www.rsc.org/images/entities/char_e001.gif) O stretching vibrations. Triphenylphosphonium (TPP), as a mitochondria-targeting ligand, was modified on the substrate material, so that precise guidance for mitochondrial fluorescence imaging was enabled. The peaks at 1450 cm−1 in Fig. S1A† represented the ring breathing vibrations generated by the aromatic rings in TPP, which are exhibited when conjugated with phosphorus. In addition, UV/Vis absorption spectra showed that the modified nanoparticles had a tiny redshift in optical absorption compared to that of AuNPs due to changes in the size and local refractive index. These consistent results indicate a successful modification process.
O stretching vibrations. Triphenylphosphonium (TPP), as a mitochondria-targeting ligand, was modified on the substrate material, so that precise guidance for mitochondrial fluorescence imaging was enabled. The peaks at 1450 cm−1 in Fig. S1A† represented the ring breathing vibrations generated by the aromatic rings in TPP, which are exhibited when conjugated with phosphorus. In addition, UV/Vis absorption spectra showed that the modified nanoparticles had a tiny redshift in optical absorption compared to that of AuNPs due to changes in the size and local refractive index. These consistent results indicate a successful modification process.
After that, due to the presence of a guide RNA, the Cas9 protein was bound to the nanostructure, forming the outer corona (Scheme 1A). The multi-layered coronal structure keeps the protein out of touch with the substrate metal material, avoiding protein inactivation. Meanwhile, we observed that the outer layer coronal structure of proteins may affect the uptake of nanomaterials in cells. The quantification of cell uptake was performed by measuring intracellular AuNPs using ICP-MS. MCF-7 cells were incubated for 4 h with PDNCs, which had different Cas to AuNP ratios. As shown in Fig. S2A,† the cell uptake gradually increased with increasing ratio of Cas protein to AuNPs. By optimizing this factor, we chose a 10![[thin space (1/6-em)]](https://www.rsc.org/images/entities/char_2009.gif) :
:![[thin space (1/6-em)]](https://www.rsc.org/images/entities/char_2009.gif) 1 ratio as the optimal condition to improve the cellular uptake. Under this condition, the cell uptake can be improved while avoiding the waste of excessive Cas protein shedding due to the steric hindrance effect. Besides, compared with the PDNC, the cellular uptake of nanoparticles without the addition of the Cas protein outer corona was at a lower level (Fig. S2B†). Furthermore, the introduction of serum had basically no effect on it. Proteins in FBS are nonspecific and have little effect on the stability of the PDNC outer corona. These results demonstrate the excellent properties of PDNCs for cellular uptake, which could be caused by increased PDNC outer corona density which is more favorable for cellular uptake. This provides a new idea for improving the transmission efficiency of the CRISPR/Cas system.
1 ratio as the optimal condition to improve the cellular uptake. Under this condition, the cell uptake can be improved while avoiding the waste of excessive Cas protein shedding due to the steric hindrance effect. Besides, compared with the PDNC, the cellular uptake of nanoparticles without the addition of the Cas protein outer corona was at a lower level (Fig. S2B†). Furthermore, the introduction of serum had basically no effect on it. Proteins in FBS are nonspecific and have little effect on the stability of the PDNC outer corona. These results demonstrate the excellent properties of PDNCs for cellular uptake, which could be caused by increased PDNC outer corona density which is more favorable for cellular uptake. This provides a new idea for improving the transmission efficiency of the CRISPR/Cas system.
Based on the successful construction of the PDNC, we designed a strategy for the CRISPR/Cas system to detect mitochondrial miRNAs (mitomiRs). After the PDNC entered into the cell, the mitochondria-specific recognition unit TPP, which is modified on the surface, came into play, resulting in targeting of mitochondria. As shown in Scheme 1B, due to the hairpin structure, the fluorescent dye TAMRA and quenching group BHQ1 on the DNA fluorescent probe are so close that the fluorescence signal would be quenched. In the meantime, the Cas protein captured by the guide RNA was fixed on the DNA single-stranded S2, which cannot initiate the cleavage of the active site by the CRISPR/Cas system. However, when two kinds of target mitomiRs appeared, everything changed. Due to the complementary base pairing mechanism and the principle of strand displacement, the existence of miRNA-21 caused the H2 chain of the hairpin structure to be replaced, when miRNA-10b would make S2 chain to be substituted. At this point, the AuNPs were separated from DNA probes, completing their mission as carriers. The long distance prevents the energy transfer between AuNPs and fluorophores, which allows no change in the fluorescence signal to occur at this time. Ingeniously, H2 and S2 have extensive complementary base pairing, forming stable double strands, on which an active site PAM sequence would be recognized and cut by CRISPR. The breakage of the H2 chain separated TAMRA from BHQ1, preventing the quenching. The fluorescent dye TAMRA was shed and the fluorescent signal turned on in mitochondria.
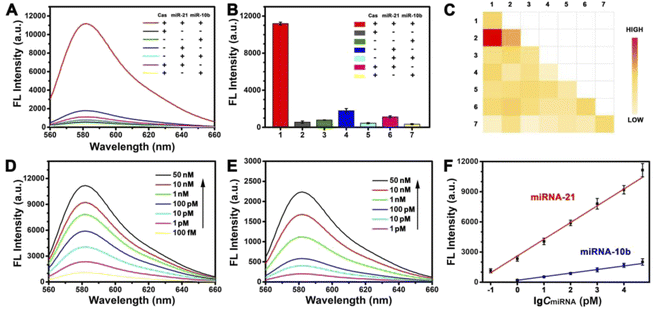
To prove the feasibility of this strategy, we validated this process in vitro. As shown in Fig. 2A and B, we explored the effect of the presence or absence of Cas protein and the target miRNA. The presence of target mitomiR miRNA-21 and miRNA-10b alone cannot turn the signal on. The Cas protein, as the key to enabling the response, was also indispensable. Only in the presence of all three, there would be an obvious fluorescent signal response. This can be understood as a simple logic gate (Fig. S3†). A high FL signal was observed (output = 1) when both mitomiR and Cas protein were introduced into the tube (input = 1/1). In addition, the dual-target strategy enables a PDNC with excellent selectivity. As shown by heat map analysis in Fig. 2C, multiple common miRNAs had little effect on the fluorescence signal.
Although fluorescent signal response only occurred when both target miRNAs were present, we sought to explore the sensitivity of this strategy for the detection of a single target miRNA. We fixed the concentration of miRNA-10b at 100 nM to detect different concentrations of miRNA-21. A satisfactory linear relationship was obtained (Fig. 2F), whose linear equation is Y = 1665.19![[thin space (1/6-em)]](https://www.rsc.org/images/entities/char_2009.gif) log
log![[thin space (1/6-em)]](https://www.rsc.org/images/entities/char_2009.gif) A + 2608.92 (Y is the fluorescence intensity (a.u), A is the concentration of miRNA-21 (pM), and R2 = 0.9923, ranging from 0.1 pM to 50 nM). Similarly, the linear equation for the detection of miRNA-10b is Y = 355.88
A + 2608.92 (Y is the fluorescence intensity (a.u), A is the concentration of miRNA-21 (pM), and R2 = 0.9923, ranging from 0.1 pM to 50 nM). Similarly, the linear equation for the detection of miRNA-10b is Y = 355.88![[thin space (1/6-em)]](https://www.rsc.org/images/entities/char_2009.gif) log
log![[thin space (1/6-em)]](https://www.rsc.org/images/entities/char_2009.gif) B + 195.75 (B is the concentration of miRNA-10b (pM), and R2 = 0.9952, ranging from 1 pM to 50 nM). The limits of detection (LOD) are 0.04 pM and 0.3 pM, respectively. The limits of detection (LOD) were calculated by the 3σ/S method (σ is the standard deviation of blank sample measurement and S is the slope of the calibration plot). The expected linear relationship is necessary for high sensitivity detection, which demonstrates the excellent potential of this strategy for highly sensitive imaging at the subcellular level.
B + 195.75 (B is the concentration of miRNA-10b (pM), and R2 = 0.9952, ranging from 1 pM to 50 nM). The limits of detection (LOD) are 0.04 pM and 0.3 pM, respectively. The limits of detection (LOD) were calculated by the 3σ/S method (σ is the standard deviation of blank sample measurement and S is the slope of the calibration plot). The expected linear relationship is necessary for high sensitivity detection, which demonstrates the excellent potential of this strategy for highly sensitive imaging at the subcellular level.
What's more, a variety of strategies based on the CRISPR/Cas system have been developed recently.49,50 Of note, many of these methods suffer from a longer signal response time due to the lack of spatiotemporal selectivity, as Cas proteins need to seek targets in the environment to initiate cleavage.51 We tested the signal response time of this work as shown in Fig. S4.† The co-incubated Cas protein and gRNA were added to a double-stranded DNA solution composed of the H2 chain and S2 chain, and the change of fluorescence intensity with time was observed. Compared with no Cas protein added (black line in Fig. S4A†), the fluorescence signal increases rapidly within seconds and remains stable for 5 minutes to half an hour (red line). We can infer the cleavage efficiency of the CRISPR/Cas system from this. As shown in Fig. S4B,† the increase in the fluorescence signal means the success of cleavage. Similarly, we modeled the response speed of this strategy to target mitomiR in vitro. With the addition of the target, the signal increased and reached a steady state after 15 minutes (Fig. S4C†), which makes the method have the application prospect of rapid detection.
Imaging of mitochondria in cells
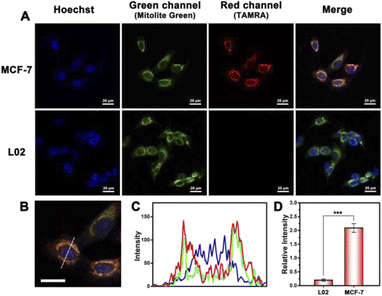
The confocal laser scanning microscopy (CLSM) image was utilized to explore the working process of the probe in cells. When the PDNC entered the cell and reached the mitochondria under the guidance of TPP, the fluorescence signal was turned on under the action of the target mitomiR. A strong red channel fluorescence signal was observed in MCF-7 cells, compared with hardly any signal in the red channel of L02 cells shown in Fig. 3A. Correspondingly, there is a significant difference in the fluorescence intensity of the red channel in Fig. 3D. This difference is obviously caused by the different expression levels of mitomiR in cancer cells and normal cells. Besides, the fluorescence in the green channel was derived from a specific mitochondrial dye (Mitolite Green), which was used to verify the targeting ability of this strategy towards mitochondria. As shown in Fig. 3C, the intensity and emission location of the red channel on the dotted line of Fig. 3B are roughly the same as those of the green channel, which demonstrated the targeting ability of PDNCs to some degree. In addition, the effect of Cas protein transmission efficiency on the fluorescent signal should be demonstrated. We have observed a difference in the fluorescent signal between the strategy in this work and the method of directly delivering RNA, DNA and proteins into cells (Fig. S8†). The improvement of the transmission efficiency can avoid the waste of fluorescent probes, thereby improving the fluorescent signal.Before this, cell viability experiments have been performed to demonstrate the biocompatibility and low toxicity of PDNCs. As shown in Fig. S5,† the cell survival rate had been maintained above 80% when the concentration of PDNCs and incubation time increased, suggesting a satisfactory biocompatibility of the probe. In addition, to rule out the possibility that autofluorescence had an effect on imaging, we discussed the function of Cas protein as a lock to turn on the signal. When PDNCs without Cas-loaded entered cells, the connection between the fluorescent dye and the quenching group could not be cut off, and the fluorescent signal remained in a quenched state. However, when the CRISPR/Cas system was intact on PDNCs, the cleavage of Cas acted as a switch, allowing red fluorescence to be observed (Fig. S6†). The combined effect of targeting and response switches allows this strategy to turn on the signal at specific subcellular sites, which is beneficial for highly sensitive imaging or detection.
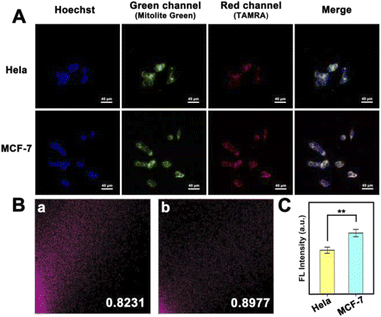
Differences in mitomiR expression between similar cancer cells are also worth investigating, which is a test for the accuracy and sensitivity of imaging at the subcellular level. We selected HeLa cells and MCF-7 cells as a comparison pair to observe the fluorescence signal difference between them. As shown in Fig. 4A, a red fluorescent signal was observed in both kinds of cells, indicating the abundant distribution of mitomiR in the mitochondria of cancer cells. However, the fluorescence intensity was different due to the difference in the mitomiR content. From a statistical point of view, there was a significant difference between the two (Fig. 4C, n = 3, and **P < 0.01). What's more, since some mitomiRs also exist in the cytoplasm, the strategy of using dual-target mitomiR simultaneous detection to improve selectivity in this work needs to be validated. As shown in Fig. 4B, PDNCs showed specificity in both HeLa and MCF-7 cells, whose colocalization coefficients between TAMRA and Mitolite Green channels were both above 0.8. The excellent targeting ability of this strategy towards mitochondria was more precisely demonstrated, which provided a platform for more sensitive imaging at the subcellular level.
Single molecule counting of mitomiR and mitochondria
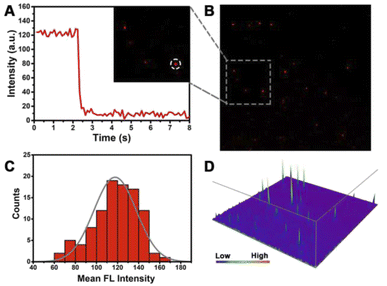
Given the high-sensitivity imaging of this strategy, we further explored subcellular level imaging with total internal reflection fluorescence (TIRF)-based techniques. Single-molecule counting is a highly sensitive quantitative method achieved by counting the fluorescent dots.52–54 This method has the advantage of low sample consumption, based on which our proposed method was carried out to detect mitomiR. This is a new attempt to detect low-abundance mitomiR, which is helpful for subcellular level detection, for example the mitochondrial content. Therefore, we can make early diagnosis of different diseases by distinguishing different cancer cells.Primarily, the properties of an individual fluorescent dot deserve to be analysed. We digested PDNC-incubated MCF-7 cells in a 6-well plate and prepared a cell lysate from hypotonic solution and sonication. The highly sensitive TIRF technique was utilized to image the diluted cell lysate (Fig. 5B). We determined whether individual fluorescent spots were single molecules by analysing their photobleaching properties. Single-step bleaching behaviour is often regarded as important evidence that the fluorescent dot is a single molecule. In contrast, if the analysed fluorescent spot is a “multi-step” drop, it means that the analysed fluorescent spot is a polymer of multiple fluorescent dye molecules. As shown in Fig. 5A, the single fluorescent spot circled in the inset has a one-step bleaching behaviour, which proves that it is a single fluorescent molecule.
In addition, 100 individual fluorescent spots were investigated by statistical methods, and their fluorescence intensity distributions were measured as shown in Fig. 5C. The intensity of most fluorescent spots is from 110 to 140 a.u., basically conforming to normal distribution, which ensures that single fluorescent spots can be observed. A high signal-to-noise ratio is essential for highly sensitive detection. The point-spread functions (PSFs) in Fig. 5D exhibit a high signal of an individual fluorescent spot and low background noise. The resulting high signal-to-noise ratio lays the foundation for the subsequent single-molecule counting methods.
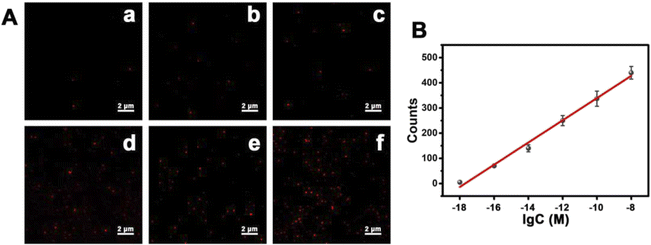
Subsequently, we attempted to explore the possibility of detecting lower concentrations of mitomiR using the single-molecule counting method. In the same environment, we prepared different concentrations of mitomiR samples, in which a single sample had the same concentration of miRNA-21 and miRNA-10b. As the concentration of mitomiR increased, the number of fluorescent spots gradually increased (Fig. 6A), which was consistent with the increase in fluorescence intensity macroscopically. A good linear relationship was established as shown in Fig. 6B. The linear regression equation is Y = 44.08![[thin space (1/6-em)]](https://www.rsc.org/images/entities/char_2009.gif) log
log![[thin space (1/6-em)]](https://www.rsc.org/images/entities/char_2009.gif) C + 780.11 (Y is the counts of fluorescence spots, C is the concentration of mitomiR (M), and R2 = 0.9904, ranging from 1 aM to 10 nM). The limit of detection was found to be 31.2 × 10⁻²⁰ M, which is lower than previously reported values using other methods.
C + 780.11 (Y is the counts of fluorescence spots, C is the concentration of mitomiR (M), and R2 = 0.9904, ranging from 1 aM to 10 nM). The limit of detection was found to be 31.2 × 10⁻²⁰ M, which is lower than previously reported values using other methods.
Due to the important role of mitomiR in mitochondria and its correlation with various diseases, the detection of low-abundance mitomiR can help us to analyse the mitochondrial content in different cancer cells and disease diagnosis. We attempted to establish the relationship between the mitomiR and mitochondrial content or cell type. We selected MCF-7, HeLa and 293T cells for comparison, and detected their mitomiR content with the strategy of this paper. There are two main reasons for us to choose 293T cells as a normal comparison: one is the low expression of mitomiR in 293T cells and the other is that it is easy to transfect, often used as a host cell. We wondered if it was possible to distinguish different cell types by observing differences in the mitomiR content. We prepared 10 cell lysate samples from each of the three types of cells incubated with PDNCs, and detected the corresponding mitomiR content by the single-molecule counting method. As shown in Fig. S7A,† for MCF-7 cells, an average of 600.7 fluorescent spots could be captured, significantly different from 326.5 for HeLa cells and 51.8 for 293T cells, which is consistent with the trend difference in the content of mitomiR in the three kinds of cells.
Although the mean values are quite different, there are still some different cells that get similar detection results when discriminating cells based on these results. In order to verify the reliability of this strategy for discriminating cells, we introduced receiver operator characteristic (ROC) curve analysis. The area under the curve (AUC) is the integral area of a group of data, which can illustrate the identification effect of a certain method. In clinical diagnosis, the closer the AUC value is to 1, the higher the sensitivity and specificity the method has, and the better the diagnostic effect we get. As shown in Fig. S7B–D,† the AUC of ROC analysis in all MCF-7 vs. HeLa, MCF-7 vs. 293T and HeLa vs. 293T is above 0.85, which demonstrates the good sensitivity and accuracy of this strategy in discriminating cells and then shows the application prospect of clinical early diagnosis.
Conclusions
In summary, we constructed a novel DNA nanoprobe named protein delivery nano-corona (PDNC) to improve the delivery efficiency of Cas protein, for spatially selective imaging of mitomiRs in living cells switched on by a CRISPR/Cas system. The coronal structure avoids inactivation caused by the close proximity of the protein to the metal substrate, and the efficiency of cellular uptake can be optimized by adjusting the ratio of protein to gold. Most of the present reports on mitochondrial imaging have only ultimate targeting and lack signal switches to avoid loss during delivery. As an efficient cleavage tool, the CRISPR/Cas system can act as a reaction switch, spatially selectively turning on the signal under the guidance of the targeting unit. Such a highly sensitive method can be further applied to imaging techniques at the cellular and subcellular levels. In addition, combined with a single-molecule counting method, this strategy enables highly sensitive detection of low-abundance mitomiR. Therefore, compared with previous imaging methods, this mitomiR-responsive strategy, which can target mitochondria and turn on the signal spatially and selectively, realizes highly sensitive detection and imaging of mitochondria, which is helpful for cell identification, early clinical diagnosis, and research on biological behavior at the subcellular level.Experimental
Chemicals and instruments
All the nucleic acid sequences and relevant probes were purchased and purified from Sangon Biotech Co., Ltd (Shanghai, China). The sequences are listed in Table S1 (ESI†). Sodium citrate tribasic dihydrate, which was used to synthesis AuNPs, was bought from Aladdin Bio-Chem Technology Co., Ltd (Shanghai, China). DMEM medium (high glucose), PBS buffer, Fetal Bovine Serum (FBS), trypsin–EDTA solution and other cell experiment consumables were purchased from BBI Co., Ltd (Shanghai, China). Isopropyl alcohol, hydrogen tetrachloroaurate(III) tetrahydrate (HAuCl4·4H2O), (3-aminopropyl) trimethoxysilane (APTMS), ammonia solution (28–30 wt%), (4-carboxybutyl) triphenylphosphonium bromide (TPP), 1-(3-dimethylaminopropyl)-3-ethylcarbodiimide (EDC) and N-hydroxysuccinimide (NHS) were purchased from InnoChem Co., Ltd (Beijing, China). Cas 9 protein was purchased from Thermo Fisher Scientific Co., Ltd (Shanghai, China). All reagents used in the experiment were of analytical reagent grade.Fluorescence spectra were collected on a FR-6000 fluorescence spectrophotometer (Shimadzu, Japan). DLS data were obtained by using a Nano-ZS Zetasizer ZEN3600 (Malvern Instruments Ltd, UK). TEM images were acquired with a FEI Talos F200S microscope (Thermo Fisher Scientific, USA) operating at 200 kV. Fluorescence imaging experiments were carried out with a Nikon N-SIM super-resolution microscope (Nikon, Japan) and acquired the images in TIRF observation mode. ICP-MS data were collected on a NexION 300X; iCAP6300 (PerkinElmer, USA). FT-IR experiments were obtained via an IR Affinity-1 (Shimadzu, Japan). All aqueous solutions were prepared using ultrapure water which was purified with a Milli-Q water purification system (Millipore, Milford, MA, USA).
Synthesis of AuNP@SiO2
HAuCl4 was formulated as 1 wt% solution and sodium citrate was dissolved in ultrapure water to make 5 wt% solution. 2 mL HAuCl4 solution was added into 50 mL ultrapure water and heated to reflux. 1 mL sodium citrate solution was added in quickly and continuously heated for 15 minutes. The product AuNPs were obtained after cooling to room temperature. Then, the mixture of AuNPs (1 mL), isopropyl alcohol (12.5 mL), ultrapure water (1.25 mL) and ammonia solution (0.2 mL) was stirred in an Erlenmeyer flask for 30 minutes to disperse evenly and create an alkaline environment. APTMS (20%, dissolved in isopropyl alcohol) was added in three times (3.5 μL per time, every 30 min). The obtained product was centrifuged and washed 3 times with water/ethanol solution. AuNP@SiO2 was obtained and kept in a refrigeration (4 °C).Preparation of PDNCs
The targeting unit TPP and DNA probe strands were linked to AuNP@SiO2 by an EDC/NHS reaction. 1 mg TPP dissolved in 200 μL PBS buffer (pH = 7.4) and 100 μL DNA probe chains (S1, S2, H1 and H2, 10 μM) were mixed with 4 mg EDC (dissolved in 100 μL PBS buffer). The mixture was shaken for 15 min (700 rpm and 10 °C) to activate the carboxyl group. Then, 6 mg NHS dissolved in 100 μL PBS buffer was added in, and shaken for another 15 min (700 rpm and 10 °C). Finally, 1 mL AuNP@SiO2 was added and shaken for 2 hours with the same speed and temperature. The product was centrifuged, washed three times, and kept refrigerated.The outer coronal structure is composed of Cas 9 proteins, which require a guide RNA for connections. Before the hybridization, the guide RNA, composed of crRNA and tracrRNA, should be heated to 95 °C for 5 min and cooled to room temperature in 1 h naturally. 30 pmol Cas 9 protein and 50 pmol guide RNA were mixed in 100 μL buffer, and incubated at 37 °C for 30 min. The mixture was added into previous DNA probe capped AuNP@SiO2 (10 μL), and co-incubated at 37 °C for 15 min. The protein delivery nano-corona (PDNC) was obtained.
Fluorescence measurements of the DNA probe
The sequence of the DNA probe is shown in Table S1.† Before the reaction, all of the DNA probes including S1, S2, H1 and H2 were annealed by heated to 95 °C for 5 min, and then cooled to room temperature. The whole process was carried out in HEPES buffer (10 mM). Then, chains S1, S2, H1 and H2 were incubated in buffer at 37 °C. The emission wavelength of TAMRA is 580 nm at an excitation wavelength of 540 nm.Confocal fluorescence imaging assay
The cells of MCF-7 were incubated in a Petri dish in Roswell Park Memorial Institute (RPMI) 1640 supplemented with 10% fetal bovine serum (FBS) and 1% penicillin-streptomycin solution at 37 °C in a humidified atmosphere containing 5% CO2. Similarly, the HeLa and L02 cells were incubated in Dulbecco's modified eagle medium (DMEM). The cells were incubated in a glass-bottom confocal dish overnight to guarantee that the cell abundance meets requirements. After seeding the probe, the cells were incubated with the probe for 3 h. 4% paraformaldehyde fix solution was added to fix the cells. The fluorescence signal can be obtained by using a confocal laser scanning microscope. Green channel range is from 500–560 nm with excitation of 488 nm; red channel range is from 570–630 nm with excitation of 561 nm.Single molecular detection and imaging
We digested PDNC-incubated MCF-7 cells in a 6-well plate and prepared a cell lysate from hypotonic solution and sonication. Similarly, PDNCs were co-incubated with HeLa and 293T cells in 6-well plates, respectively, and cell lysates were subsequently made separately. The medium used for HeLa and 293T cells was DMEM instead of RPMI 1640 for MCF-7. The single-molecule studies were carried out using a TIRF microscope equipped with a Nikon CFI Apochromat TIRF 100 × oil (NA 1.49) immersion objective. Images were recorded with an Andor Technology iXon DU897 EMCCD camera. Images with a region of interest of 512 × 512 pixels were acquired using NIS-Elements and analyzed with NIS-Elements Viewer and ImageJ software. The fluorescence count averages were obtained by calculating ten frames. The number of fluorescence spots was counted by using ImageJ software.Statistical analysis
The statistical analyses were performed using the IBM SPSS Statistics program (version 26.0). Values are presented as mean ± standard deviation for data that were normally distributed. The Kolmogorov–Smirnov test was used to inspect the normality and homogeneity of variance of all the data. For two-group comparison, P values were derived from the one-way Student's t-test to determine differences between groups with normally distributed data and the Mann–Whitney U test with nonparametric data. Receiver Operator Characteristic (ROC) curves were constructed to determine and compare the sensitivity and specificity of imaging different kinds of cells. For all comparisons, we considered P values of less than 0.05 to be statistically significant.Data availability
All relevant data is presented in the manuscript and ESI.† Raw data is available upon request by email to the corresponding author.Author contributions
Xuan Zhao performed the study, collected and analysed the data, and wrote the original draft. The other authors also assisted in analysing and validating the data and were involved in preparing the manuscript. Jin Ouyang conceived the idea of the study and was responsible for the funding acquisition, project administration and writing of the manuscript.Conflicts of interest
There are no conflicts to declare.Acknowledgements
J. Ouyang gratefully acknowledges the financial support from the National Natural Science Foundation of China (21974010 and 21675014). N. Na thanks the NNSF of China (21874012) and the National Key Research and Development Program of China (No. 2019YFC1805600).Notes and references
- F. Li, Y. Liu, Y. Dong, Y. Chu, N. Song and D. Yang, J. Am. Chem. Soc., 2022, 144, 4667–4677 CrossRef CAS PubMed.
- W.-X. Zong, J. D. Rabinowitz and E. White, Mol. Cell, 2016, 61, 667–676 CrossRef CAS.
- D. C. Wallace, Nat. Rev. Cancer, 2012, 12, 685–698 CrossRef CAS PubMed.
- J. Nunnari and A. Suomalainen, Cell, 2012, 148, 1145–1159 CrossRef CAS PubMed.
- S. B. Vafai and V. K. Mootha, Nature, 2012, 491, 374–383 CrossRef CAS PubMed.
- W. Ji, X. Tang, W. Du, Y. Lu, N. Wang, Q. Wu, W. Wei, J. Liu, H. Yu, B. Ma, L. Li and W. Huang, Chem. Soc. Rev., 2022, 51, 71–127 RSC.
- J. Zhao, Z. Li, Y. Shao, W. Hu and L. Li, Angew. Chem., Int. Ed., 2021, 60, 17937–17941 CrossRef CAS PubMed.
- P. K. Purohit and N. Saini, Cell. Mol. Life Sci., 2021, 78, 1405–1421 CrossRef CAS PubMed.
- M. A. Ortega, O. Fraile-Martínez, L. G. Guijarro, C. Casanova, S. Coca, M. Álvarez-Mon, J. Buján, N. García-Honduvilla and Á. Asúnsolo, Cancers, 2020, 12, 2443 CrossRef CAS PubMed.
- F. Yang, H. Lu, X. Meng, H. Dong and X. Zhang, Small, 2022, 18, 2106281 CrossRef CAS PubMed.
- W. Wei, W. Dai, F. Yang, H. Lu, K. Zhang, Y. Xing, X. Meng, L. Zhou, Y. Zhang, Q. Yang, Y. Cheng and H. Dong, Angew. Chem., Int. Ed., 2022, 61, e202116909 CAS.
- T.-T. Chen, X. Tian, C.-L. Liu, J. Ge, X. Chu and Y. Li, J. Am. Chem. Soc., 2015, 137, 982–989 CrossRef CAS PubMed.
- B. Groves, Y.-J. Chen, C. Zurla, S. Pochekailov, J. L. Kirschman, P. J. Santangelo and G. Seelig, Nat. Nanotechnol., 2016, 11, 287–294 CrossRef CAS PubMed.
- D. S. Seferos, D. A. Giljohann, H. D. Hill, A. E. Prigodich and C. A. Mirkin, J. Am. Chem. Soc., 2007, 129, 15477–15479 CrossRef CAS PubMed.
- C. Xue, S.-X. Zhang, C.-H. Ouyang, D. Chang, B. J. Salena, Y. Li and Z.-S. Wu, Angew. Chem., Int. Ed., 2018, 57, 9739–9743 CrossRef CAS.
- Y. Di, E. Zhang, Z. Yang, Q. Shen, X. Fu, G. Song, C. Zhu, H. Bai, Y. Huang, F. Lv, L. Liu and S. Wang, Angew. Chem., Int. Ed., 2022, 61, e202116457 CAS.
- R. Wang, J. Chen, J. Gao, J.-A. Chen, G. Xu, T. Zhu, X. Gu, Z. Guo, W.-H. Zhu and C. Zhao, Chem. Sci., 2019, 10, 7222–7227 RSC.
- J. Zhao, H. Chu, Y. Zhao, Y. Lu and L. Li, J. Am. Chem. Soc., 2019, 141, 7056–7062 CrossRef CAS PubMed.
- J. Zhao, J. Gao, W. Xue, Z. Di, H. Xing, Y. Lu and L. Li, J. Am. Chem. Soc., 2018, 140, 578–581 CrossRef CAS PubMed.
- X. Zhao, Q. Han, N. Na and J. Ouyang, Anal. Chem., 2021, 93, 14514–14520 CrossRef CAS PubMed.
- C. Knight Spencer, L. Xie, W. Deng, B. Guglielmi, B. Witkowsky Lea, L. Bosanac, T. Zhang Elisa, M. El Beheiry, J.-B. Masson, M. Dahan, Z. Liu, A. Doudna Jennifer and R. Tjian, Science, 2015, 350, 823–826 CrossRef CAS PubMed.
- H. Wang, M. Nakamura, R. Abbott Timothy, D. Zhao, K. Luo, C. Yu, M. Nguyen Cindy, A. Lo, P. Daley Timothy, M. La Russa, Y. Liu and S. Qi Lei, Science, 2019, 365, 1301–1305 CrossRef CAS.
- C. Calcines-Cruz, I. J. Finkelstein and A. Hernandez-Garcia, Nano Lett., 2021, 21, 2752–2757 CrossRef CAS.
- D.-X. Wang, Y.-X. Wang, J. Wang, J.-Y. Ma, B. Liu, A.-N. Tang and D.-M. Kong, Chem. Sci., 2022, 13, 4364–4371 RSC.
- D. Huang, D. Ni, M. Fang, Z. Shi and Z. Xu, Anal. Chem., 2021, 93, 16965–16973 CrossRef CAS PubMed.
- T. Zhang, W. Zhao, W. Zhao, Y. Si, N. Chen, X. Chen, X. Zhang, L. Fan and G. Sui, Anal. Chem., 2021, 93, 16184–16193 CrossRef CAS.
- Z.-Y. Gu, S.-S. Yang, M. Xu, X.-D. Zhang, C. Fan and J. Li, Pure Appl. Chem., 2021, 93, 1453–1461 CrossRef CAS.
- Y. Wei, Z. Yang, C. Zong, B. Wang, X. Ge, X. Tan, X. Liu, Z. Tao, P. Wang, C. Ma, Y. Wan and J. Li, Angew. Chem., Int. Ed., 2021, 60, 24241–24247 CrossRef CAS.
- W. Fan, P. Han, Q. Feng, Y. Sun, W. Ren, T. Lawson and C. Liu, Anal. Chem., 2022, 94, 2172–2179 CrossRef CAS PubMed.
- Q. Han, X. Zhao, X. Zhang, N. Na and J. Ouyang, Sens. Actuators, B, 2022, 360, 131663 CrossRef CAS.
- Y. Tang, L. Gao, W. Feng, C. Guo, Q. Yang, F. Li and X. C. Le, Chem. Soc. Rev., 2021, 50, 11844–11869 RSC.
- H.-X. Wang, M. Li, C. M. Lee, S. Chakraborty, H.-W. Kim, G. Bao and K. W. Leong, Chem. Rev., 2017, 117, 9874–9906 CrossRef CAS PubMed.
- H. Yin, R. L. Kanasty, A. A. Eltoukhy, A. J. Vegas, J. R. Dorkin and D. G. Anderson, Nat. Rev. Genet., 2014, 15, 541–555 CrossRef CAS PubMed.
- E. E. Coughlin, J. Hu, A. Lee and T. W. Odom, J. Am. Chem. Soc., 2021, 143, 3671–3676 CrossRef CAS PubMed.
- Y. Xi, B. Liu, S. Wang, X. Huang, H. Jiang, S. Yin, T. Ngai and X. Yang, Chem. Sci., 2021, 12, 3885–3889 RSC.
- L. Yang, S. Yu, Y. Yan, S. Bi and J.-J. Zhu, Anal. Chem., 2022, 94, 7075–7083 CrossRef CAS PubMed.
- H. Mohammad-Beigi, Y. Hayashi, C. M. Zeuthen, H. Eskandari, C. Scavenius, K. Juul-Madsen, T. Vorup-Jensen, J. J. Enghild and D. S. Sutherland, Nat. Commun., 2020, 11, 4535 CrossRef CAS PubMed.
- A. A. Shemetov, I. Nabiev and A. Sukhanova, ACS Nano, 2012, 6, 4585–4602 CrossRef CAS PubMed.
- J. Wang, U. B. Jensen, G. V. Jensen, S. Shipovskov, V. S. Balakrishnan, D. Otzen, J. S. Pedersen, F. Besenbacher and D. S. Sutherland, Nano Lett., 2011, 11, 4985–4991 CrossRef CAS PubMed.
- J. Wu, H. Peng, X. Lu, M. Lai, H. Zhang and X. C. Le, Angew. Chem., Int. Ed., 2021, 60, 11104–11109 CrossRef CAS PubMed.
- Y. Sun, H. Liu, Y. Shen, X. Huang, F. Song, X. Ge, A. Wang, K. Zhang, Y. Li, C. Li, Y. Wan and J. Li, ACS Omega, 2020, 5, 14814–14821 CrossRef CAS PubMed.
- Y. Pu, H. Yin, C. Dong, H. Xiang, W. Wu, B. Zhou, D. Du, Y. Chen and H. Xu, Adv. Mater., 2021, 33, 2104641 CrossRef CAS.
- K. Zhang, R. Deng, X. Teng, Y. Li, Y. Sun, X. Ren and J. Li, J. Am. Chem. Soc., 2018, 140, 11293–11301 CrossRef CAS PubMed.
- K. Zhang, R. Deng, Y. Li, L. Zhang and J. Li, Chem. Sci., 2016, 7, 4951–4957 RSC.
- D. J. Brogan, D. Chaverra-Rodriguez, C. P. Lin, A. L. Smidler, T. Yang, L. M. Alcantara, I. Antoshechkin, J. Liu, R. R. Raban, P. Belda-Ferre, R. Knight, E. A. Komives and O. S. Akbari, ACS Sens., 2021, 6, 3957–3966 CrossRef CAS PubMed.
- Z.-y. Wang, D.-l. Li, X. Tian and C.-y. Zhang, Chem. Sci., 2021, 12, 10426–10435 RSC.
- M. J. Mickert, Z. Farka, U. Kostiv, A. Hlaváček, D. Horák, P. Skládal and H. H. Gorris, Anal. Chem., 2019, 91, 9435–9441 CrossRef CAS PubMed.
- L. Smith, M. Kohli and A. M. Smith, J. Am. Chem. Soc., 2018, 140, 13904–13912 CrossRef CAS PubMed.
- J. Hemphill, E. K. Borchardt, K. Brown, A. Asokan and A. Deiters, J. Am. Chem. Soc., 2015, 137, 5642–5645 CrossRef CAS PubMed.
- P. K. Jain, V. Ramanan, A. G. Schepers, N. S. Dalvie, A. Panda, H. E. Fleming and S. N. Bhatia, Angew. Chem., Int. Ed., 2016, 55, 12440–12444 CrossRef CAS PubMed.
- Y. Liu, S. Zou Roger, S. He, Y. Nihongaki, X. Li, S. Razavi, B. Wu and T. Ha, Science, 2020, 368, 1265–1269 CrossRef CAS PubMed.
- C.-c. Li, H.-y. Chen, X. Luo, J. Hu and C.-y. Zhang, Chem. Sci., 2021, 12, 12407–12418 RSC.
- C.-c. Li, J. Hu, X. Luo, J. Hu and C.-y. Zhang, Anal. Chem., 2021, 93, 14568–14576 CrossRef CAS PubMed.
- M. Peng, F. Sun, N. Na and J. Ouyang, Small, 2020, 16, 2000460 CrossRef CAS PubMed.
Footnote |
| † Electronic supplementary information (ESI) available. See https://doi.org/10.1039/d2sc03329a |
| This journal is © The Royal Society of Chemistry 2022 |

