 Open Access Article
Design of an activatable NIR-II nanoprobe for the in vivo elucidation of Alzheimer's disease-related variations in methylglyoxal concentrations†
Yi
Lai
a,
Yijing
Dang
a,
Qian
Sun
a,
Jiaxing
Pan
b,
Haijun
Yu
 b,
Wen
Zhang
 *a and
Zhiai
Xu
 *a
*a
aSchool of Chemistry and Molecular Engineering, East China Normal University, 500 Dongchuan Road, Shanghai 200241, China. E-mail: wzhang@chem.ecnu.edu.cn; zaxu@chem.ecnu.edu.cn
bState Key Laboratory of Drug Research, Center of Pharmaceutics, Shanghai Institute of Materia Medica, Chinese Academy of Sciences, 501 Haike Road, Shanghai 201203, China
First published on 19th October 2022
Abstract
Clear elucidation of the changes in Alzheimer's disease (AD)-related methylglyoxal (MGO) levels in vivo is significant yet highly challenging. Fluorescence imaging in the second near-infrared region (NIR-II, 1000–1700 nm) has gained increasing attention as an observation method in living organisms, but an MGO-activatable fluorescent probe that emits in this region for in vivo brain imaging is lacking because of the existence of the blood–brain barrier (BBB). Herein, a biocompatible Fe3O4 nanoparticle (IONP)-conjugated MGO-activatable NIR-II fluorescent probe (MAM) modified with the peptide T7 (HAIYPRH) (named TM-IONP) is reported for the in situ detection of MGO in a transgenic AD mouse model. In this system, the T7 peptide enhances BBB crossing and brain accumulation by specifically targeting transferrin receptors on the BBB. Due to the MAM probe, TM-IONPs emit fluorescence in the NIR-II region and display high selectivity with an MGO detection limit of 72 nM and a 10-fold increase in the fluorescence signal. After intravenous administration, the TM-IONPs are easily delivered to the brain and pass through the BBB without intervention, and as a result, the brains of AD mice can be noninvasively imaged for the first time by the in situ detection of MGO with a 24.2-fold enhancement in NIR-II fluorescence intensity compared with wild-type mice. Thus, this MGO-activated NIR-II-emitting nanoprobe is potentially useful for early AD diagnosis in clinic.
Introduction
Alzheimer's disease (AD) is a late-onset neurodegenerative disorder that is characterized by progressive neuronal loss and the impairment of multiple cognitive functions.1,2 Reactive dicarbonyl compounds, such as methylglyoxal (MGO), which are mainly endogenously produced via glycolysis, have been proven to be effective in facilitating the pathological cascades underlying neurodegenerative disorders. This is due to the potent glycation of reactive dicarbonyls to form advanced glycation end products (AGEs), which play an important role in the accumulation of amyloid β (Aβ) and neurofibrillary tangles.3,4 MGO is the most potent precursor of AGEs, and its levels have been reported to increase in the cerebrospinal fluid of AD patients.5,6 Therefore, accurate mapping of MGO in the brains of AD patients will provide critical information to better understand its role in the onset and progression of AD. However, the highly complicated matrix and blood–brain barrier (BBB) make the in situ detection of MGO in living brains challenging.In vivo fluorescence-based optical imaging is indispensable in disease diagnosis owing to its inherent advantages, such as high temporal and spatial resolution.7 In particular, a new bioimaging technology using fluorescence in the second near-infrared region (NIR-II, 1000–1700 nm) has shown a promising deep penetration and high-fidelity imaging capabilities.8,9 Although a variety of fluorescent probes have been developed for MGO detection, most of them fluoresce in the visible to red regions with wavelengths less than 650 nm, which does not allow for high-resolution bioimaging with deep tissue penetration.10–19 Moreover, none of these MGO-activated fluorescent probes can pass through the BBB to enter the brain after systemic administration.
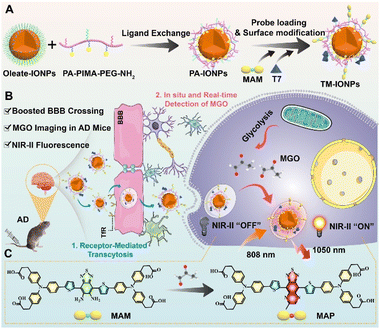
In this study, we designed a novel NIR-II fluorescent nanoprobe for mapping MGO in the brains of transgenic AD model mice. As depicted in Scheme 1, a benzo[c][1,2,5]thiadiazole-5,6-diamine-derived donor-acceptor-donor (D-A-D)-type organic NIR-II fluorescent probe with a MGO-activated response (MAM) was developed and then processed into water-dispersible nanoparticles by its attachment to the surface of a biocompatible Fe3O4 nanoparticle (IONP). Furthermore, to endow the nanoparticles with a boosted ability to cross the BBB, the peptide T7 (HAIYPRH), which actively targets transferrin (Tf) receptors overexpressed in brain capillary endothelial cells (BCECs), was covalently attached to the nanoparticle surface to form TM-IONPs. By taking advantage of the 10-fold enhancement in NIR-II fluorescence in response to MGO with high selectivity, good spatiotemporal resolution and excellent temporal resolution, the formed TM-IONPs can be delivered across the BBB via Tf-receptor-mediated transcytosis for the in situ real-time detection of MGO in the brains of AD mice. In vivo NIR-II imaging showed that the TM-IONPs could successfully differentiate AD mice from normal mice by displaying a 24.2-fold enhancement in fluorescence. Thus, TM-IONPs are a promising new tool for the noninvasive early clinical diagnosis of AD.
Results and discussion
Construction of the MGO-activatable NIR-II fluorescent nanoprobe
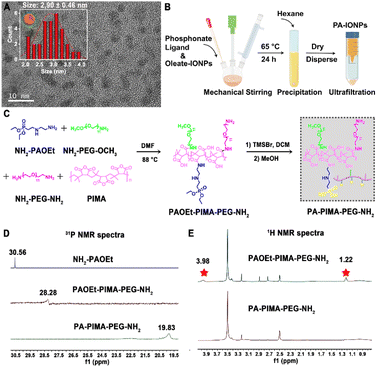
Hydrophobic Fe3O4 nanoparticles, termed oleate-IONPs, were first prepared through a conventional thermal decomposition method by using oleic acid as the surface ligand (Scheme S1†). Transmission electron microscopy (TEM) images of the as-prepared oleate-IONPs showed well-dispersed and spherical nanoparticles with a uniform diameter of ∼2.90 ± 0.46 nm (Fig. 1A). Next, these oleate-IONPs were PEGylated to obtain biocompatible particles (PA-IONPs) with surface-reactive amine moieties by exchanging the anchoring groups of the oleic acid ligands for versatile coordinating ligands based on the phosphonate anchoring motif, which possess a higher binding affinity for Fe3+ (Fig. 1B, Scheme S1†).20–22The ligand based on the phosphonic acid groups, termed PA–PIMA–PEG–NH2, was synthesized through a nucleophilic addition reaction between poly(isobutylene-alt-maleic anhydride) (PIMA), an amine-functionalized phosphonate derivative (NH2–PAOEt) and short polyethylene glycol hydrophilic blocks (a mixture of NH2–PEG–OCH3 and NH2–PEG–NH2) (Fig. 1C).21 First, the anhydride rings along the PIMA backbone reacted with phosphoramidate and amine-PEG to yield the intermediate (PAOEt–PIMA–PEG–NH2). The intermediate was then treated with bromotrimethylsilane (TMSBr) and methanol to hydrolyse the phosphate esters along the chain into phosphonic acid groups and obtain the final product (PA–PIMA–PEG–NH2) since PAOEt does not participate in metal coordination. The 1H nuclear magnetic resonance (NMR) spectra of the NH2–PAOEt precursor verified the successful synthesis (Fig. S1†). The 31P NMR spectra showed that the peak of the precursor (NH2–PAOEt) at ∼30.56 ppm shifted to ∼28.28 ppm and ∼19.83 ppm for the intermediate (PAOEt–PIMA–PEG–NH2) and hydrolysate (PA–PIMA–PEG–NH2), respectively, which confirmed that the addition and hydrolysis reactions occurred (Fig. 1D). In addition, the 1H NMR spectrum of PAOEt–PIMA–PEG–NH2 showed two peaks (marked with asterisks) at ∼1.22 and 3.98 ppm, which were assigned to the protons of the methyl and ethylene groups of the phosphate, respectively, indicating that the phosphate ester groups were successfully synthesized along the PIMA backbone (Fig. 1E). The disappearance of the two characteristic peaks in the 1H NMR spectrum of PA–PIMA–PEG–NH2 suggested the complete hydrolysis of the phosphate ester into a phosphonic acid moiety. Moreover, the stoichiometry of the product was calculated by integrating the phosphate methyl and ethylene proton peaks (∼1.22 and 3.98 ppm, respectively) and the PEG–OCH3 proton peak (∼3.25 ppm) (Fig. S2†). The results suggested that the polymer (PAOEt–PIMA–PEG–NH2) was constructed with ∼18 NH2–PAOEt, ∼17 NH2–PEG–OCH3 and ∼3 NH2–PEG–NH2 along each PIMA chain. Fourier transform infrared (FT-IR) examination further confirmed the successful synthesis of the PA–PIMA–PEG–NH2 ligands (Fig. S3†).
The hydrodynamic size and polydispersity index (PDI) of the PA-IONPs after phase transfer modification revealed by dynamic light scattering (DLS) studies were slightly changed from 10.10 ± 0.51 nm and 0.18 ± 0.01 for the oleate-IONPs to 18.2 ± 0.74 nm and 0.17 ± 0.02, respectively, indicating homogeneous nanoparticle dispersions yielded via ligand exchange (Fig. S4A–C†). Additionally, TEM examination showed that the PA-IONPs were 8.49 ± 2.26 nm in size (Fig. S4D†).
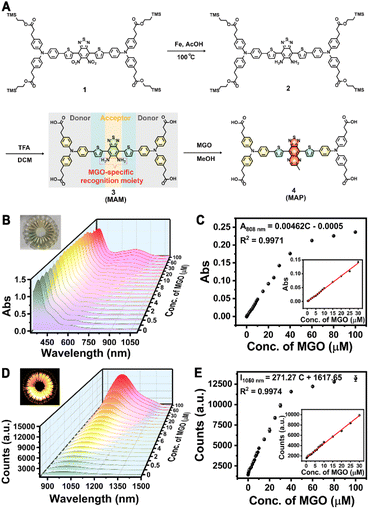
Not only did the PEGylated phospholipid coating render the IONPs water-soluble and biocompatible, it also provided functional groups for subsequent bioconjugation with biomarkers or targeting molecules. We then designed a MGO-activatable NIR-II molecular probe (MAM) by employing a D-A-D structure with electron-deficient benzobisthiadiazole-fused o-phenylenediamine as the acceptor unit and the MGO-specific recognition unit (Fig. 2A). MAM was synthesized by iron reduction and the deprotection of the trimethylsilyl ethers in 76.7% total yield, which was confirmed by NMR and ESI-QTOF MS (electrospray ionization quadrupole time-of-flight mass spectrometry) (Fig. S5–S7†). When the benzo[c][1,2,5]thiadiazole-5,6-diamine of MAM was oxidized by MGO to form a stronger acceptor (6-methyl-[1,2,5]thiadiazolo[3,4-g]quinoxaline), the absorption of the MGO-activatable product (MAP) at 500–900 nm was significantly increased and accompanied by enhanced NIR-II fluorescence intensity at 1050 nm upon excitation with an 808 nm laser (Fig. S8†). With IR-26 as a reference (0.5%), the quantum yield of MAP was determined to be 0.70% in dimethyl sulfoxide (Fig. S9A–E†). Additionally, time-resolved fluorescence spectra displayed a fluorescence lifetime (τ) of 1.07 ns for MAP at 1050 nm (Fig. S9F†).
Then, MAM was further conjugated to the PA-IONP surface through amidation to obtain a NIR-II fluorescent nanoprobe with MGO responsiveness, termed M-IONPs (Fig. S10A, Scheme S1†). As determined by absorption spectroscopy, the grafting rate of the MAM moiety was 68.5% with an optimal feed ratio of MAM and PA-IONPs of 1.2![[thin space (1/6-em)]](https://www.rsc.org/images/entities/char_2009.gif) :
:![[thin space (1/6-em)]](https://www.rsc.org/images/entities/char_2009.gif) 1 (Fig. S10B and C, Table S1†). The average diameter of the M-IONPs was 8.76 ± 1.10 nm as determined by TEM with an average hydrodynamic diameter of 24.40 ± 0.51 nm in phosphate-buffered saline (PBS) after analysis by DLS (Fig. S11, Table S1†). Additionally, the zeta (ζ) potential value decreased to −22.3 ± 0.8 mV from the −19.9 ± 1.4 mV measured for PA-IONPs, suggesting the successful introduction of the MGO probe onto the Fe3O4 nanoparticles. The M-IONPs were colloidally stable, as there were few changes in their hydrodynamic size and surface charge after storage in various media, including H2O, normal saline, 1× PBS, and serum (10% FBS), for 24 h (Fig. S12†).
1 (Fig. S10B and C, Table S1†). The average diameter of the M-IONPs was 8.76 ± 1.10 nm as determined by TEM with an average hydrodynamic diameter of 24.40 ± 0.51 nm in phosphate-buffered saline (PBS) after analysis by DLS (Fig. S11, Table S1†). Additionally, the zeta (ζ) potential value decreased to −22.3 ± 0.8 mV from the −19.9 ± 1.4 mV measured for PA-IONPs, suggesting the successful introduction of the MGO probe onto the Fe3O4 nanoparticles. The M-IONPs were colloidally stable, as there were few changes in their hydrodynamic size and surface charge after storage in various media, including H2O, normal saline, 1× PBS, and serum (10% FBS), for 24 h (Fig. S12†).
MGO-activated NIR-II emission of the nanoprobe in vitro
The optical response of the M-IONPs towards MGO was studied in PBS solution (pH 7.4). Upon reaction with MGO (30 μM), NIR absorption at 750 nm was generated, which was accompanied by a robust increase in the fluorescence intensity within the NIR-II window when the excitation wavelength was 808 nm (Fig. S13†). As expected, the absorbance signal at 500–900 nm increased with a gradual increase in the MGO concentration, inducing a colour change from pale yellow to green with a good linear relationship (R2 = 0.9971) over the concentration range of 0.25 to 30 μM with a detection limit of 210 nM (S/N = 3) (Fig. 2B and C). M-IONP fluorescence was activated upon MGO addition, with an on/off ratio that increased to 7 at 30 μM and approximately 10 at 100 μM. This NIR-II fluorescence intensity at 1050 nm also showed excellent linearity with the MGO concentration over the range of 0.25–30 μM (R2 = 0.9974) (Fig. 2D and E). The detection limit was determined to be 72 nM, indicating the high sensitivity of the M-IONPs to detect MGO. In addition, M-IONPs afforded a good optical response within a physiological pH range (pH 4-8.5), and the fluorescence from the activated M-IONPs exhibited negligible variation after continuous irradiation at 808 nm for 2 h, suggesting the potential to use the M-IONPs over a wide range of pH values and for long-term cell imaging (Fig. S14†). Furthermore, upon 808 nm excitation, a dramatic increase in signal intensity was observed only in the presence of MGO, including when other radicals, such as reactive carbonyls (RCS: MDA (malondialdehyde), EPRY (ethyl pyruvate), OPA (o-phthalaldehyde), FA (formaldehyde), BA (benzaldehyde), and GO (glyoxal)), reactive oxygen species (ROS: ClO−, H2O2, TBHP (tert-butyl hydroperoxide), KO2, ·OH, and 1O2), reactive nitrogen species (RNS: NO, ONOO−, NaNO2, and NaNO3), and reactive sulfur species (RSS: GSH, Cys) were present in 10-fold higher concentrations (Fig. S15A and B†). Moreover, no notable change in fluorescence response was observed when the interferents coexisted with MGO, illustrating the high selectivity of the nanoprobe for MGO detection (Fig. S15C and D†).Preparation of the T7-decorated MGO-activatable nanoprobe and its intracellular behaviour
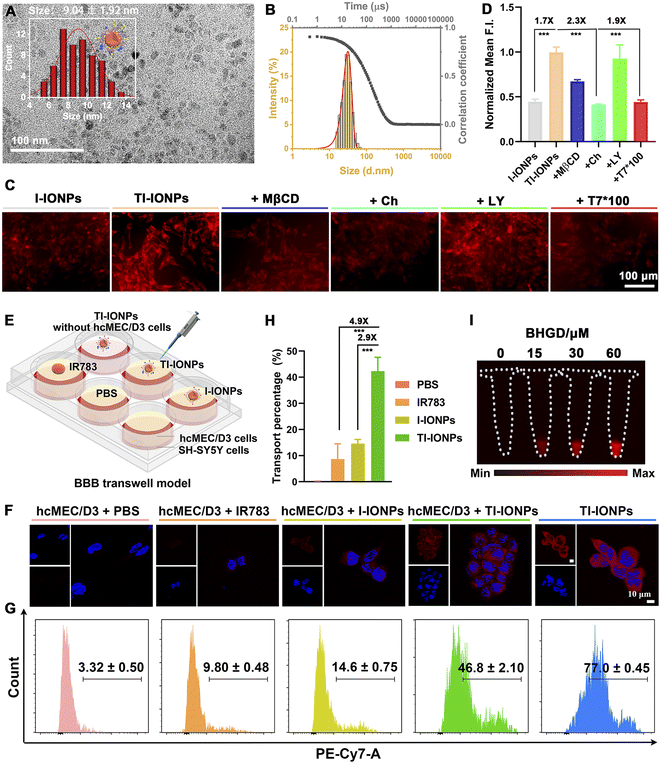
Having established the optimal MAM-modified Fe3O4 nanoparticles to form uniform and stable M-IONPs, the probe structure was redesigned by further functionalization with an ideal exogenous targeting ligand (T7, HAIYPRH) that specifically binds to the Tf receptor without competing with endogenous Tf, resulting in TM-IONPs (Scheme S1†). T7 decoration did not affect nanoparticle formation, as demonstrated by the uniform spherical morphology with a similar diameter (9.04 ± 1.02 nm), similar hydrodynamic size (28.20 ± 0.62 nm) and narrow size distribution (PDI = 0.22 ± 0.01) (Fig. 3A and B, Table S2†). Employing the improved Pauly chromogenic method for histidine,23 the grafting ratio of T7 in the TM-IONPs was calculated as 18.10% (Fig. S16, Table S2†).Following the successful formation of the T7-decorated Fe3O4 nanoparticles, the ability of T7 decoration to induce enhanced cellular uptake of the Fe3O4 nanoparticles was evaluated in vitro by employing the murine brain endothelial cell line bEnd.3 that overexpresses the Tf receptor (TfR). Before imaging, the potential cytotoxicity of PA-IONPs, M-IONPs and TM-IONPs was evaluated in bEnd.3 cells and human neuroblastoma (SH-SY5Y) cells, and all cells showed over 80% viability after incubation with 400 μg mL−1 nanoparticles for 24 h, indicating the low cytotoxicity of these Fe3O4 nanoparticles in both bEnd.3 and SH-SY5Y cells (Fig. S12†). To directly measure the intracellular nanoparticle uptake, carboxylated IR783 dye, which was successfully synthesized as confirmed by 1H NMR and electrospray ionization-mass (ESI-MS) spectroscopy, was covalently coupled with PA-IONPs through an amidation reaction to obtain fluorescent Fe3O4 nanoparticles as determined via DLS and spectrographic analysis (Scheme S1, Fig. S18 and S19†). The bEnd.3 cellular uptake of T7- and IR783-decorated nanoparticles (TI-IONPs) was greater than that of fluorescent nanoparticles without T7 (I-IONPs) after 6 h of incubation, suggesting that T7 efficiently promoted cellular uptake through receptor-mediated transcytosis (Fig. 3C and S20A†). This result was further confirmed by the observed significant decrease in fluorescence intensity in the group pretreated with free T7 peptide (100×) compared with that in the untreated group. The endocytosis process was studied by pretreatment with specific uptake inhibitors (methyl-β-cyclodextrin, chlorpromazine, and LY294002 for caveolin-, clathrin-, and pinocytosis-mediated endocytosis).24,25 Treatment with methyl-β cyclodextrin (MβCD, 1.9 mM) and chlorpromazine (Ch, 2.9 μM) resulted in a decrease in the fluorescence intensity of the TI-IONPs, whereas a minimal change was observed in the group pretreated with LY294002 (LY, 2.9 μM), suggesting that T7-decorated nanoparticles were taken up mainly through caveolae-mediated endocytosis and clathrin vesicles (Fig. 3C and S20A†). In addition, the cellular uptake behaviour of T7-decorated nanoparticles by bEnd.3 cells was quantified by flow cytometry (Fig. 3D and S20B†). Flow cytometry analysis showed that bEnd.3 cellular uptake of T7 peptide-modified nanoparticles was 1.7-fold higher than that of unmodified nanoparticles, which was reduced by 1.9-fold after blocking with excess free T7 peptide. Moreover, pretreatment with chlorpromazine induced a 2.3-fold decrease in fluorescence. These data further indicated that receptor-mediated endocytosis was one of the major pathways by which these nanoparticles were internalized.
To determine the BBB transcytosis capacity of T7-decorated nanoparticles, a transwell BBB model was established by adding bEnd.3 cells or human cerebral microvascular endothelial (hcMEC/D3) cells overexpressing TfR to the upper chamber and SH-SY5Y cells to the lower chamber (Fig. 3E and S21A†). IR783-labelled nanoparticles were then added to the upper chambers, and the cells in the lower chambers were collected for flow cytometry analysis and confocal laser scanning microscopy (CLSM) imaging. As depicted in Fig. 3F, S21B and C,† SH-SY5Y cells treated with TI-IONPs exhibited significantly higher fluorescence intensity than those treated with I-IONPs and free dye, suggesting that the BBB permeability and SH-SY5Y cell endocytosis of Fe3O4 nanoparticles could be improved with the assistance of T7. Flow cytometry assays further revealed that TI-IONPs penetrated deeper than I-IONPs and free dye, further demonstrating the superiority of T7 modification for deep BBB penetration (Fig. 3G and S21D†). Moreover, the transcytosis of the TI-IONPs (42.3 ± 5.2%) across the hcMEC/D3 cell monolayer was 2.9-fold and 4.9-fold higher than that of the I-IONPs and free dye (14.6 ± 1.6% and 8.7 ± 5.8%, respectively), suggesting that T7 decoration could boost the penetration of nanoparticles through the BBB model and facilitate cellular uptake by SH-SY5Y cells (Fig. 3G).
MGO detoxification takes place mainly through the MGO pathway consisting of two enzymes, glyoxalase 1 (GLO1) and glyoxalase 2 (GLO2), which catalyse the conversion of MGO to D-lactate in the presence of GSH.26 To test the ability of TM-IONPs to image endogenous MGO, we used the GLO1 inhibitor BHGD to increase the content of endogenous MGO in SH-SY5Y cells. After pretreatment with BHGD for 6 h, SH-SY5Y cells were treated with TM-IONPs for 2 h. NIR-II fluorescence imaging showed that TM-IONPs exhibited a BHGD concentration-dependent NIR-II fluorescence enhancement in SH-SY5Y cells, while relatively weak fluorescence signals were observed in the group without BHGD pretreatment (Fig. 3I and S22†).
In vivo brain penetration of T7-decorated nanoparticles
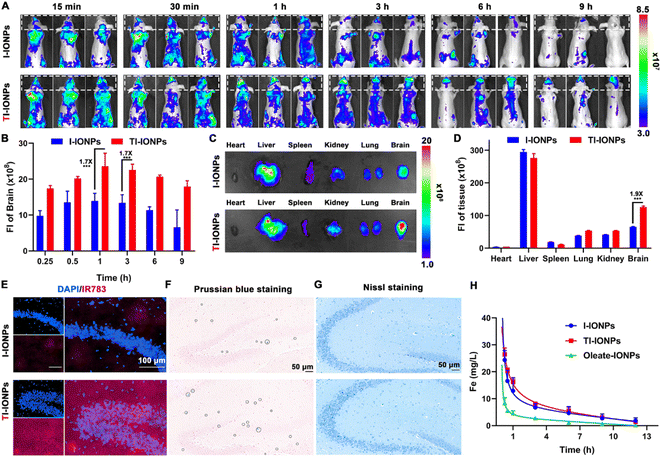
To explore the BBB transcytosis ability and accumulation of T7-decorated nanoparticles, the biodistribution of IR783-labelled nanoparticles injected intravenously into BALB/c nude mice was monitored by in vivo fluorescence imaging. Over time, an increase in signal accumulation was found in the T7-linked nanoparticle group, which displayed stronger fluorescence in the brain than the T7-free nanoparticles, suggesting that T7 modification could improve brain endothelium uptake and facilitate brain targeting (Fig. 4A and B). Ex vivo imaging of the organs further showed 1.9-fold higher distribution in the brains of the TI-IONP-treated mice than that in the brains of the I-IONP-treated mice (Fig. 4C and D). Fluorescence images of brain sections also revealed that nanoparticle accumulation in the brain was higher in the TI-IONP group than that in the I-IONP group (Fig. 4E). In addition, more blue spots, as shown by Prussian blue staining, appeared in the brains of the TI-IONP group of mice than in those of the I-IONP group, further confirming the enhanced BBB transcytosis property of T7 (Fig. 4F). Moreover, no obvious neuron loss was observed in mice treated with TI-IONPs or I-IONPs, as characterized by Nissl staining, indicating that these Fe3O4 nanoparticles did not injure the nerve cells or affect their normal functions (Fig. 4G). The plasma concentration–time curves of Fe after treatment with different formulations revealed that PEGylation of the Fe3O4 nanoparticles prolonged the blood circulation time, which might be attributed to the avoidance of rapid uptake by the reticuloendothelial system (Fig. 4H). Additionally, these Fe3O4 nanoparticles were almost completely eliminated 12 h after intravenous injection, verifying their good biodegradability. To further explore the biosafety of the Fe3O4 nanoparticles in vivo, haematological analysis and blood biochemical assays were carried out. No significant changes in any of the biochemical indices were observed after 3 intravenous injections of any dose of the different Fe3O4 nanoparticles, suggesting that the Fe3O4 nanoparticles do not affect normal blood function (Tables S3 and S4†). Furthermore, the haematoxylin-eosin (H&E) staining images of the major organs demonstrated that the Fe3O4 nanoparticle-treated group had no distinct tissue damage (Fig. S23†).In situ NIR-II imaging of MGO in the brains of AD mice
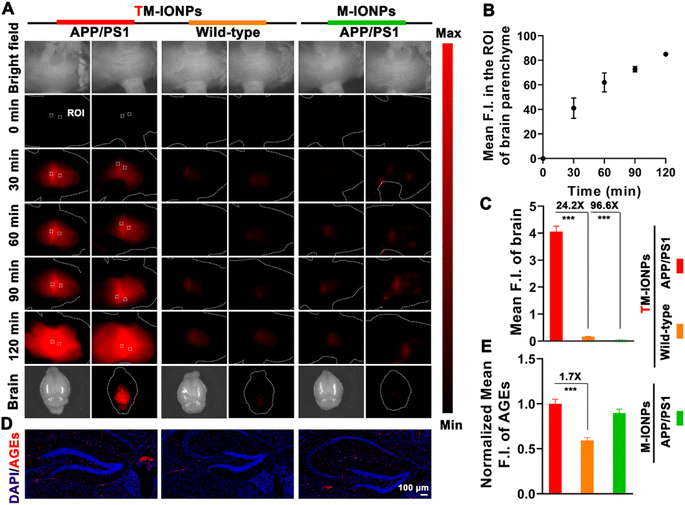
To gain insight into the vital role of MGO in the etiopathogenesis of AD, we explored the capability of the engineered TM-IONPs to detect MGO in situ real time via NIR-II fluorescence imaging after sufficient accumulation of T7-decorated nanoparticles in the brains of mice. The real-time mapping of MGO based on the intensity and distribution of the fluorescence signals was evaluated by time-dependent whole-body NIR-II fluorescence imaging. The NIR-II fluorescence signals of the brain parenchyma (the areas apart from the blood stream) of APPswe/PS1dE9 transgenic (APP/PS1, AD) mice after intravenous injection of TM-IONPs gradually increased in intensity and spread throughout the brain within 120 min, whereas the NIR-II fluorescence in the brains of TM-IONP-treated wild-type mice and M-IONP-treated APP/PS1 mice was very weak (Fig. 5A). These results indicated a higher MGO level in the brains of AD mice. The fluorescence intensity of two different regions in the brain parenchyma (according to region of interest (ROI) measurements) quantitatively revealed the response of TM-IONPs to MGO in the brains of APP/PS1 mice (Fig. 5B). We further carried out ex vivo fluorescence imaging of the mouse brains from the above three groups, and the results were consistent with the above in vivo results (Fig. 5A and C). Excitingly, AD mice and wild-type mice, which were difficult to differentiate through visible inspection, could be clearly distinguished by the 24.2-fold fluorescence enhancement based on our MGO-activatable NIR-II nanoprobe. Extensive evidence has proven the high levels and immunoreactivity of advanced glycation end products (AGEs) in AD and their close relationship to the formation of plaques and neurofibrillary tangles as well as oxidative stress.6,27 Thus, immunofluorescent staining analysis of AGEs in brain tissues was carried out to confirm the higher AGE accumulation in AD brains than in wild-type brains (Fig. 5D and E). Since MGO is the most potent precursor of AGEs, this result not only further verified the high level of MGO in AD brains, which was consistent with the in vivo NIR-II imaging results, but also revealed the contribution of MGO to AD as a mediator of protein cross-linking and oxidative stress.Conclusions
In conclusion, we have filled a gap with the development of a NIR-II emissive MGO-activatable fluorescent nanoprobe for in situ MGO imaging in the brains of AD mice without BBB intervention. The formulated nanoparticles showed a large (10-fold) NIR-II fluorescence enhancement and a detection limit of 72 nM. With TfR targeting properties endowed by T7 decoration, the nanoparticles were able to map MGO in vivo in real time. TM-IONPs were found to be capable of visualizing subtle abnormalities in MGO levels in AD brains and differentiating AD mice from normal mice by the 24.2-fold enhancement in NIR-II fluorescence for the first time. The as-developed NIR-II nanoprobe would be an efficient tool for studying MGO-related neurodegenerative disease in vivo and boost the design of NIR-II emissive nanoprobes for overcoming the limitations imposed by the BBB.Ethical approval
All animal studies were performed in accordance with the guidelines approved by the Institutional Animal Care and Use Committee of East China Normal University.Data availability
Experimental procedures, compound characterization, and additional data have been included in the ESI.†Author contributions
Y. Lai, W. Zhang and Z. Xu conceived the project, performed the experimental study, analyzed the data, prepared and revised the manuscript. H. Yu analyzed the data and revised the manuscript. Y. Dang assisted in the synthesis of compounds. Q. Sun and J. Pan helped to revise the manuscript.Conflicts of interest
There are no conflicts of interest to declare.Acknowledgements
Financial support received from the National Natural Science Foundation of China (No. 22074043 and 22174047), and the Science and Technology Commission of Shanghai Municipality (No. 20142202800) is greatly appreciated.Notes and references
- K. Rajasekhar and T. Govindaraju, RSC Adv., 2018, 8, 23780–23804 RSC.
- M. J. Hajipour, M. R. Santoso, F. Rezaee, H. Aghaverdi, M. Mahmoudi and G. Perry, Trends Biotechnol., 2017, 35, 937–953 CrossRef CAS PubMed.
- S. S. More, A. P. Vartak and R. Vince, ACS Chem. Neurosci., 2013, 4, 330–338 CrossRef CAS PubMed.
- C. Angeloni, L. Zambonin and S. Hrelia, BioMed Res. Int., 2014, 2014, 238485 Search PubMed.
- C. Angeloni, M. Malaguti, B. Rizzo, M. C. Barbalace, D. Fabbri and S. Hrelia, Chem. Res. Toxicol., 2015, 28, 1234–1245 Search PubMed.
- S. Koike, C. Ando, Y. Usui, Y. Kibune, S. Nishimoto, T. Suzuki and Y. Ogasawara, Brain Res. Bull., 2019, 144, 164–170 CrossRef CAS PubMed.
- X. Yi, F. Wang, W. Qin, X. Yang and J. Yuan, Int. J. Nanomed., 2014, 9, 1347–1365 CrossRef PubMed.
- C. Chen, R. Tian, Y. Zeng, C. Chu and G. Liu, Bioconjugate Chem., 2020, 31, 276–292 CrossRef CAS PubMed.
- C. Li, G. Chen, Y. Zhang, F. Wu and Q. Wang, J. Am. Chem. Soc., 2020, 142, 14789–14804 CrossRef CAS PubMed.
- T. Wang, E. F. Douglass, Jr., K. J. Fitzgerald and D. A. Spiegel, J. Am. Chem. Soc., 2013, 135, 12429–12433 CrossRef CAS PubMed.
- T. Tang, Y. Zhou, Y. Chen, M. Li, Y. Feng, C. Wang, S. Wang and X. Zhou, Anal. Methods, 2015, 7, 2386–2390 RSC.
- S. T. Wang, Y. Lin, C. D. Spicer and M. M. Stevens, Chem. Commun., 2015, 51, 11026–11029 RSC.
- W. Zhang, F. Zhang, Y. L. Wang, B. Song, R. Zhang and J. Yuan, Inorg. Chem., 2017, 56, 1309–1318 CrossRef CAS PubMed.
- M. Yang, J. Fan, J. Zhang, J. Du and X. Peng, Chem. Sci., 2018, 9, 6758–6764 RSC.
- C. Ding, F. Wang, Y. Dang, Z. Xu, L. Li, Y. Lai, H. Yu, Y. Luo, R. Huang, A. Zhang and W. Zhang, Anal. Chem., 2019, 91, 15577–15584 CrossRef CAS PubMed.
- Y. J. Reo, Y. W. Jun, S. Sarkar, M. Dai and K. H. Ahn, Anal. Chem., 2019, 91, 14101–14108 CrossRef CAS PubMed.
- H. Wang, Y. Xu, L. Rao, C. Yang, H. Yuan, T. Gao, X. Chen, H. Sun, M. Xian, C. Liu and C. Liu, Anal. Chem., 2019, 91, 5646–5653 CrossRef CAS PubMed.
- Y. Dang, F. Wang, L. Li, Y. Lai, Z. Xu, Z. Xiong, A. Zhang, Y. Tian, C. Ding and W. Zhang, Chem. Commun., 2020, 56, 707–710 RSC.
- H. Xu, Q. Liu, X. Song, C. Wang, X. Wang, S. Ma, X. Wang, Y. Feng, X. Meng, X. Liu, W. Wang and K. Lou, Anal. Chem., 2020, 92, 13829–13838 CrossRef CAS PubMed.
- J. Zeng, L. Jing, Y. Hou, M. Jiao, R. Qiao, Q. Jia, C. Liu, F. Fang, H. Lei and M. Gao, Adv. Mater., 2014, 26, 2694–2698 CrossRef CAS PubMed.
- L. Du, W. Wang, C. Zhang, Z. Jin, G. Palui and H. Mattoussi, Chem. Mater., 2018, 30, 7269–7279 CrossRef CAS.
- R. Calzada, C. M. Thompson, D. E. Westmoreland, K. Edme and E. A. Weiss, Chem. Mater., 2016, 28, 6716–6723 CrossRef CAS PubMed.
- H. T. Macpherson, Biochem. J., 1946, 40, 470–481 CrossRef CAS PubMed.
- H. J. Eom and J. Choi, Chem.-Biol. Interact., 2019, 311, 108774 CrossRef CAS PubMed.
- J. Rejman, V. Oberle, I. S. Zuhorn and D. Hoekstra, Biochem. J., 2004, 377, 159–169 CrossRef CAS PubMed.
- L. de Bari, A. Atlante, T. Armeni and M. P. Kalapos, Ageing Res. Rev., 2019, 53, 100915 CrossRef CAS PubMed.
- H. J. Luth, V. Ogunlade, B. Kuhla, R. Kientsch-Engel, P. Stahl, J. Webster, T. Arendt and G. Munch, Cereb. Cortex, 2005, 15, 211–220 CrossRef PubMed.
Footnote |
| † Electronic supplementary information (ESI) available. See DOI: https://doi.org/10.1039/d2sc05242c |
| This journal is © The Royal Society of Chemistry 2022 |

