Nanoarchitectonics of Congo red dye to biocompatible fluorescent carbon dots for highly sensitive Fe3+ and ferritin detection†
Arunkumar
Kathiravan
 *a,
Sekar
Thulasi
b,
Trevor A.
Smith
 cd,
Muthupandian
Ashokkumar
 c and
Mariadoss
Asha Jhonsi
 *b
*b
aDepartment of Chemistry, Vel Tech Rangarajan Dr Sagunthala R & D Institute of Science and Technology, Avadi, Chennai-600 062, Tamil Nadu, India. E-mail: akathir23@gmail.com
bDepartment of Chemistry, B. S. Abdur Rahman Crescent Institute of Science and Technology, Chennai-600048, Tamil Nadu, India. E-mail: jhonsiasha@gmail.com
cSchool of Chemistry, University of Melbourne, VIC 3010, Australia
dARC Centre of Excellence in Exciton Science, University of Melbourne, VIC 3010, Australia
First published on 28th November 2022
Abstract
In this work, we have meticulously tuned the carcinogenic Congo red dye to environmentally benign fluorescent carbon dots (CDs) by adopting a typical hydrothermal method without any additives. The as-synthesized CDs were extremely water soluble, exhibited an excitation wavelength independent emission with a high fluorescence quantum yield (46%) and were biocompatible. The microscopy results revealed that the CDs were quasi-spherical with a particle diameter of ∼5 nm. The structure and functional groups of the CDs were comprehensively investigated using Fourier-transform infrared, X-ray photoelectron and Raman spectroscopy analyses. These studies show that the CDs were intrinsically functionalized with –OH, N–H and C![[double bond, length as m-dash]](https://www.rsc.org/images/entities/char_e001.gif) O groups. In the sensing experiments, the CDs selectively responded to Fe3+ ions over other analytes with a detection limit of 12 nM. The time-resolved fluorescence quenching measurements were used to decipher the sensing mechanism. For the onsite ‘equipment-free’ detection of iron, we have developed a CD adsorbed paper-based analytical tool. Furthermore, the selective nature of CDs was highly beneficial for detecting Fe3+ in non-heme metalloprotein (ferritin) and real water samples. Thus, the CDs produced from the Congo red dye could be a prospective asset to the bio-imaging and biosensing research fields.
O groups. In the sensing experiments, the CDs selectively responded to Fe3+ ions over other analytes with a detection limit of 12 nM. The time-resolved fluorescence quenching measurements were used to decipher the sensing mechanism. For the onsite ‘equipment-free’ detection of iron, we have developed a CD adsorbed paper-based analytical tool. Furthermore, the selective nature of CDs was highly beneficial for detecting Fe3+ in non-heme metalloprotein (ferritin) and real water samples. Thus, the CDs produced from the Congo red dye could be a prospective asset to the bio-imaging and biosensing research fields.
Introduction
Colored dyes are predominantly used in various industries such as textile, leather, polymer, paper, paint and pigment manufacturing, which account for the contamination of water bodies by direct disposal of dye effluents into water resources curtailing their sustainable use.1–3 Dyes significantly affect the photosynthetic activity of aquatic life due to the presence of aromatics, metals and chlorides in the structure. The majority of dyes used in industry are light and oxidation stable, as well as resistant to aerobic digestion. In addition, the dyes are toxic, allergic, mutagenic and carcinogenic, posing an immense threat to living organisms.4 Among all dyes, azo dyes are the most common and are a major source of concern for the environment due to the formation of amines, which are toxic and carcinogenic.2 Congo red (CR) is a common anionic azo dye which is highly soluble in water and exhibits high persistence once it is discharged into the environment. Depending on the pH, different forms of CR dye can be present in aqueous solutions, which curbs its elimination. CR, a human carcinogen, has been banned in many countries due to health risks and the use of CR dye has been superseded by other commercial dyes. However, CR dye is still widely used to stain tissues for microscopic examination, and to serve as an acid–base indicator,5 because it turns red in the presence of alkalis and blue when exposed to acids. In addition, its anaerobic degradation product is benzidine,6 which is also a recognized human carcinogen. As a result, excessive CR in wastewater must be removed for sustainable environmental concerns.7 Various techniques, with their own merits and shortcomings, have been explored for CR removal from wastewater, such as membrane separation,8 biodegradation,9 photo-degradation,10 coagulation,11 oxidation processes12 and adsorption.13,14 Among them, adsorption is recognized as the most economical and effective method, with advantages such as ease in operation, absence of secondary pollution, insensitivity to toxic substances and efficacy for various types of pollutants.Universally, researchers have concentrated on the effective removal of hazardous CR dye2,7,15 from wastewater by adsorption methods, wherein, the adsorbed moiety is once again eradicated as waste. In this context, our attempt is entirely different from the existing reports; we have targeted the complete valorization of CR dye into fruitful fluorescent nanomaterials. Hence, we have adopted the hydrothermal method for the effective conversion of hazardous CR dye into fluorescent carbon dots (CDs), which are further utilized for potential sensing of Fe3+ ions. Fe3+ is one of the heavy metal ions16–19 that are essential in both biological systems and environmental processes; in the human body, it is involved in electron transitions in cytochromes and oxygen transport in tissues. However, the deficiency or excess of Fe3+ ions can cause severe problems in human health (liver damage and kidney failure) and harm the immune system; it can also cause heart attacks, Alzheimer's disease and hepatitis.20–22 The concentration of Fe3+ ions plays a key role in Parkinson's disease, and excess Fe3+ ions cause cytotoxicity. Fe3+ is also an important pollutant in environmental monitoring and its concentration in drinking water needs to be monitored and should not exceed 0.3 ppm as recommended by the World Health Organization (WHO).23 Therefore, to reduce the harmful effects of Fe3+ ions, it is crucial to develop an effective analytical method for the detection of Fe3+ ions. Accordingly, the fluorescence quenching method is a promising approach for the detection of Fe3+ ions.24 Fluorescent CDs are also used to detect ferritin among other proteins including cytochrome c, myoglobin, human serum albumin (HSA), bovine serum albumin (BSA) and lysozyme. Thus, the developed CDs could be used as fluorescent probes for Fe3+ detection in environmental and biological systems.
Experimental section
Materials
Congo red dye, metal chlorides, anions and amino acids were procured from Alfa Acer, Loba and Merck. These chemicals were used without further purification. Micro syringe filters (0.2 μm) and dialysis membrane bags (MWCO-15![[thin space (1/6-em)]](https://www.rsc.org/images/entities/char_2009.gif) 000 Da) were purchased from Hi-Media products. Equine spleen ferritin was purchased from Sigma Aldrich India. Doubly distilled water was used for all hydrothermal syntheses and spectral measurements.
000 Da) were purchased from Hi-Media products. Equine spleen ferritin was purchased from Sigma Aldrich India. Doubly distilled water was used for all hydrothermal syntheses and spectral measurements.
Methods
Scanning electron microscopy (SEM) was carried out to understand the morphology of the CDs using a Nova NanoSEM 600 from FEI, Netherlands and EDS analysis was performed with an EDAX system. High-resolution transmission electron microscopy (HRTEM, Phillips CM120) was used to examine the size and shape of the synthesized CDs. Fourier transform infrared (FTIR) spectral analysis was performed with a JASCO FT-IR ATR 6300 spectrometer at room temperature in the range of 4000–400 cm−1. X-ray photoelectron spectroscopic (XPS) measurements were conducted on a VG ESCALAB220i-XL spectrometer equipped with a hemispherical analyzer. The data were analyzed using the CasaXPS software and the energy calibration was referenced to the C 1s peak at 284.8 eV. The Raman spectrum of the CDs was measured on a high-resolution Renishaw Raman microscope using a He–Ne laser of 18 mW at 632.8 nm. UV-Visible absorption spectra of CR dye and the CDs were recorded using a Shimadzu UV-1800 spectrophotometer. The fluorescence and sensing measurements were carried out using a Hitachi F-4500 fluorescence spectrometer. Time correlated single photon counting was used to determine the fluorescence decay behaviour of CDs under excitation at 390 nm. The limit of detection (LOD) was calculated from the fluorescence quenching data by using equation 3σ/K, where σ is the standard deviation of the fluorescence intensity, and K is the slope of the linear plot.Fluorescence quantum yield measurements
The fluorescence quantum yield (ϕF) was calculated using eqn (1)| ϕF/ϕR = (IS/IR) × (FR/FS) × (ηS/ηR)2 | (1) |
Synthetic optimization
The hydrothermal method is a widely used facile approach adopted for the synthesis of CDs over the years.16,18,19,28–32 In this methodology, the formation of CDs may take place via dehydration, polymerization and carbonization which make up the carbonic structure.31 Thus, we have adopted the same approach for the conversion of the toxic CR dye to CDs. In a typical reaction, the CR dye (100 mg) and distilled water (100 ml) were taken in a 250 ml beaker with mild stirring to obtain a homogenous mixture. The solution was transferred into a Teflon-lined autoclave (stainless steel) and kept in a muffle furnace at 200 °C. To optimize the time duration for the effective conversion of the CR dye, we conducted the reactions over varying times such as 1 h, 4 h, 8 h and 12 h. It was observed that the CR dye remained unchanged after 1 h and 4 h of hydrothermal treatments (Fig. 1a); however, after 8 h & 12 hours, the color of the CR dye completely changed from red to light brown.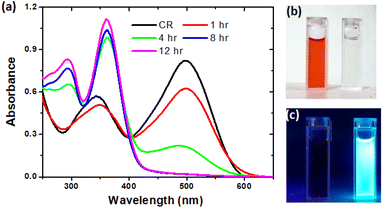 | ||
| Fig. 1 (a) UV-Vis absorption spectra of CR dye and CDs at 1 h, 4 h, 8 h and 12 h reaction times; (b) daylight and (c) UV light illuminated image of CR dye and CDs after 12 h of reaction. | ||
The supernatant was collected by centrifuging the mixture at 3000 rpm for 10 min and was further dialyzed using ultrapure water with a dialysis membrane bag (MWCO 15 kDs and pore size ∼3.5 nm) for 24 h. During dialysis, the water was changed every 6 h in order to avoid deposition of the particles on the membrane wall.
The obtained CDs were vacuum dried and stored at room temperature for further analysis. The formation pathway of CDs from the CR dye is supported by naked eye observations and UV-Vis absorption spectral analysis. With a naked eye (Fig. 1b), one could clearly see the decolorization of the CR dye to a colorless (diluted) solution. This clearly infers that the conversion of the CR dye to CDs occurred without adding any catalyst/additives. The absorption spectra (Fig. 1a) of the CR dye and 1 h treated CR dye are similar with a minimal hypochromic effect in the wavelength range of 340–500 nm. However, the 4 h treatment of the CR dye led to a large hypochromic effect and a new peak at 290 was also noticed, which confirms the formation of CDs and the carbonic core structure.33 On the other hand, under 8 h and 12 h conditions, the absorption peak at 500 nm is completely deteriorated, which confirms that the reaction was completed and consequently the carbonic core absorbance at 290 nm was also enhanced. Thus, we have successfully optimized the reaction conditions for the effective conversion of the CR dye to CDs. Moreover, the synthesized CD particles are highly fluorescent under UV (<365 nm) illumination (Fig. 1c).
Cell culture and fluorescence imaging
Triple negative breast cancer cells (MDA-MB-231) were procured from the National Centre for Cell Science, Pune, India. The cells were cultured using DMEM (Dulbecco's modified Eagle medium) as it is the most broadly suitable medium for many adherent cell phenotypes among defined media for cell and tissue culture. The cells were passaged every two to three days when the monolayer reached >95% confluence. MDA-MB-231 cells were seeded at a density of 104 cells per well in 96-well plates and incubated overnight. On the next day, the cells were treated with different concentrations of the CDs (5, 25, 50, 100, 200 and 400 μg ml−1) for 24 h. Upon completion of the incubation time, 20 μl of freshly prepared MTT (5 mg ml−1 of PBS) was added to each well followed by incubation in a CO2 incubator (Thermo, USA) for 3 h. Lastly, the absorbance of the 96-well plates was read at 590 nm using a microplate reader (Bio-Rad, USA). The imaging of the cells was visualized under a fluorescence microscope (Accu-Scope, EX310, USA) at 20× magnifications.Results and discussion
Material characterization
The surface morphology, elemental composition and particle size of the prepared CDs were investigated by conventional microscopic techniques. The SEM image of the prepared material at 1 μm and 500 nm scales (Fig. 2a & b) clearly shows the evenly dispersed quasi-spherical particles. The EDAX results (Fig. S1†) show that the particles mainly consist of carbon 67.7% and oxygen 20.8% with a trace amount of sulfur (3.9%). Fig. 2c & e show the TEM images of the CDs at a 50 nm and 100 nm scale, which illustrate the monodispersed quasi-spherical shaped particles. Fig. 2d shows the histogram plot of the CD size distribution and the average diameter was calculated to be ∼5 nm. In addition, we were able to obtain a single quasi-spherical dot at a scale of 20 nm (Fig. 2f). Furthermore, the Raman spectrum of the CDs was measured to determine the degree of disorder, lattice defects (D band) and the ordered graphene core in the CD particles (Fig. S2†). The spectrum shows two different characteristic peaks at 1366 cm−1 and 1605 cm−1 which are associated with the D and G bands, respectively. Typically, the D band arises due to the sp3 hybridized carbon atom and the G band represents the E2g vibration mode of sp2 hybridized carbon.33,34 Thus, the formation of the carbon core is evident. The ratio of the intensities of the D and G bands (ID/IG) is calculated as 0.285, which is less than that of the original graphite film (ID/IG = ∼1.05), indicating that the synthesized CD particles consist of a graphitic core surrounded by amorphous functional groups.35,36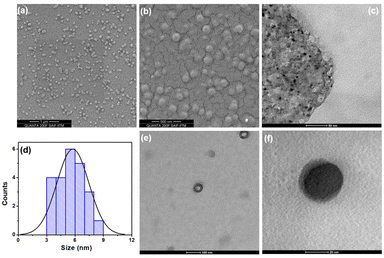 | ||
| Fig. 2 SEM images of CDs at (a) 1 μm and (b) 500 nm scales. TEM images at (c) 50 nm, (e) 100 nm and (f) 20 nm scales. (d) The statistical histogram of the size distribution of CDs. | ||
The FTIR spectrum of the CDs was measured to get the preliminary information about the functional groups present on the surface of the CDs (Fig. S3†). The peaks at 3469 cm−1 and at 3353 cm−1 represent the O–H and N–H stretching vibrations, respectively. The strong peak at 1583 cm−1 was assigned to the C![[double bond, length as m-dash]](https://www.rsc.org/images/entities/char_e001.gif) O stretching of carboxylic acid and the medium stretching band of the S
O stretching of carboxylic acid and the medium stretching band of the S![[double bond, length as m-dash]](https://www.rsc.org/images/entities/char_e001.gif) O group of sulfonic acid (SO3H) and sulfoxide appeared at 1348 cm−1 and 1062 cm−1, respectively. The C–O stretching vibration was observed at 1222 cm−1 and the bending vibration peak at 1446 cm−1 was attributed to the alkane C–H group. The existence of these functional groups contributes to the improved stability and hydrophilicity of the CDs, which makes them potentially useful for specific functionalization towards sensing and bio-imaging applications in aqueous medium.33
O group of sulfonic acid (SO3H) and sulfoxide appeared at 1348 cm−1 and 1062 cm−1, respectively. The C–O stretching vibration was observed at 1222 cm−1 and the bending vibration peak at 1446 cm−1 was attributed to the alkane C–H group. The existence of these functional groups contributes to the improved stability and hydrophilicity of the CDs, which makes them potentially useful for specific functionalization towards sensing and bio-imaging applications in aqueous medium.33
A further detailed study on the surface chemical bonding of the CDs was conducted by X-ray photoelectron spectroscopy (XPS). The XPS survey spectrum of the CDs (Fig. 3a) shows two major peaks at ∼285 and ∼532 eV, which can be associated with C 1s and O 1s, respectively. Two minor peaks at ∼400 eV and 169 eV, correspond to N 1s and S 2p, respectively. A high resolution deconvoluted spectrum of C 1s (Fig. 3b) confirms the presence of O–C![[double bond, length as m-dash]](https://www.rsc.org/images/entities/char_e001.gif) O (289.1 eV), C–O (286.8 eV), C–N (285.7 eV) and C–C (285 eV). The two peaks in the O 1s spectrum (Fig. S4a†) at 532.3 eV and 533.7 eV indicate the presence of oxygen as C
O (289.1 eV), C–O (286.8 eV), C–N (285.7 eV) and C–C (285 eV). The two peaks in the O 1s spectrum (Fig. S4a†) at 532.3 eV and 533.7 eV indicate the presence of oxygen as C![[double bond, length as m-dash]](https://www.rsc.org/images/entities/char_e001.gif) O and C–OH, respectively. The N 1s (Fig. S4b†) peaks at 399.8 eV and 401.7 eV indicate that N is present in the CDs as NH/NC and NO2, respectively. The functional groups present on the surface of the CDs as revealed by FTIR are nicely corroborated with the results from XPS.
O and C–OH, respectively. The N 1s (Fig. S4b†) peaks at 399.8 eV and 401.7 eV indicate that N is present in the CDs as NH/NC and NO2, respectively. The functional groups present on the surface of the CDs as revealed by FTIR are nicely corroborated with the results from XPS.
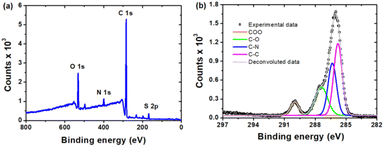 | ||
| Fig. 3 The high resolution XPS spectra of the as synthesized CDs: (a) full range XPS spectrum and (b) C 1s spectrum. | ||
Photophysical properties of the CDs
Generally, the CDs exhibit excitation dependent fluorescence owing to the polydisperse size of the particles and multiple emissive surface trap states.37 In contrast, we have observed large excitation wavelength independent fluorescence with a maximum emission wavelength of 440 nm. Such excitation independent fluorescence behavior may be ascribed to the monodisperse size distribution of particles with uniform surface states, and thus non-radiative transitions between the carbon core and the surface state are likely to occur. This hypothesis was previously established for other CD materials.38,39 On the other hand, the excitation spectra (Fig. 4) of the CDs show two characteristic peaks indicating the core and surface excitation of the CDs at ∼295 nm and at ∼365 nm, which correspond to the π–π* transition of the carbon core centre and the n–π* transition of the functional moieties on the surface of the CDs, respectively.40 Notably, the observed excitation spectrum closely matches with the absorption spectrum of the CDs, which clearly reveals the monodispersed nature and single emissive states of the CDs. The fluorescence quantum yield (ϕF) is determined to be ∼46%, which is suitable for bio-imaging, chemo-sensing and other relevant fluorescence-based applications. Furthermore, the fluorescence emission is quite stable for about two years. This indeed indicates that the CDs derived from the Congo red dye could be useful in the fabrication of optoelectronic devices.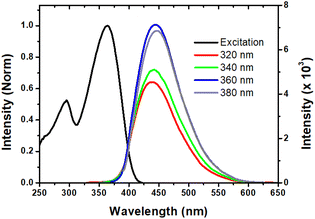 | ||
| Fig. 4 Excitation spectrum (black, λem = 440 nm) and excitation-independent emission spectra of CDs in water. | ||
Stability of CDs
Generally, the fluorescence properties of the molecule/probe could be disturbed by various external factors; thus we have examined the stability of the CDs in view of potential practical applications and commercialization. The prepared CDs were intrinsically water-soluble due to the presence of oxygen-rich moieties on the surface of the CDs and thus, they could be employed as a fluorescent probe for sensing and bio-imaging applications in aqueous media. Before employing the CDs for the above-mentioned applications, we conducted the stability test at different pH and ionic strength values. As shown in Fig. S5a,† the fluorescence intensity remained almost constant from pH 7 to pH 14. At pH 1–3, the fluorescence of the CDs was very weak, and only modest fluorescence was observed at pH 5. Furthermore, the fluorescence intensities of the CDs remained the same (Fig. S5b†) with increasing NaCl concentration from 1 mM to 1 M. Owing to the high stability at pH ranging from 7 to 14, and at higher ionic strengths, this material has potential for sensing and bio-imaging applications.Fe3+ sensing
The surface functional groups of the CDs are commonly known to complex with metal ions and exhibit a fluorescence alteration. Using this strategy, the fluorescence response of the CDs to several environmental and biologically crucial cations and anions such as Fe3+, Co2+, Cu2+, Zn2+, Cd2+, Hg2+, Pb2+, Ag+, Ca2+, Cs+, Na+, Fe2+, F−, Cl−, Br−, I−, CN−, SCN− and H2PO4− was investigated. As shown in Fig. S6a & b,† the Fe3+ ion responded selectively through quenching of the CD emission, suggesting that the as-synthesized CDs can be employed for prompt sensing of Fe3+ ions in environmental and biological systems.Fig. 5a shows the fluorescence spectra of the CDs as a function of various micromolar concentrations of Fe3+ ions. The obvious quenching was observed as a function of Fe3+ ion concentrations at regular intervals. The change in fluorescence intensities (ΔF = F0 − F) shows moderate linearity for the concentration of Fe3+ in the range of 0 to 6 μM (Fig. 5b), where F and F0 are the intensities at 440 nm in the presence and absence of Fe3+, respectively. The limit of detection (LOD) for Fe3+ sensing was calculated by the following relationship using the fluorescence quenching method: LOD = 3σ/K (σ is the standard deviation of the blank measurements, and K is the slope of the linear plot). From the slope of the linear section of the plot, the LOD was calculated to be 12 nM, which is significantly lower than those of previously reported carbon-based fluorescent probes for Fe3+ detection (Table S1†). Several analytical methods, including inductively coupled plasma-mass spectrometry (ICP-MS), colorimetry, voltammetry, and atomic absorption spectroscopy (AAS), have been previously41–50 used to determine Fe3+, but several other metal ions have been shown to interfere, necessitating complicated pre-treatment procedures and the use of sophisticated instrumentation. As a result, fluorescent chemosensors51 and, more recently, CDs have been widely studied for the selective detection of Fe3+ due to their ability to provide a simple, sensitive, selective, and economical method at very low concentrations without any pre-treatment (Table S1†). Hence, owing to the higher sensitivity and excellent selectivity, the derived CD probe could be used to detect Fe3+ ions in living cells and environmental water bodies.
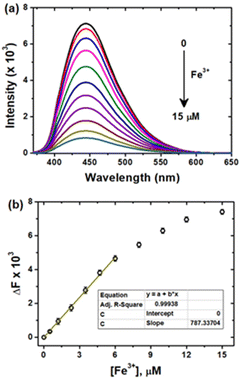 | ||
| Fig. 5 (a) Fluorescence emission spectra of CDs as a function of [Fe3+] (from top to bottom, 0 to 15 μM) and (b) the dependence of F0/F on [Fe3+] in the range of 0–15 μM. | ||
Mechanism of quenching
To understand the quenching process and mechanism, a typical Stern–Volmer plot was constructed (Fig. S7†) based on the quenching of emission by the Fe3+ ions. The Stern–Volmer plot yielded an upward curvature indicating that the quenching is probably caused by both static and dynamic processes. To understand the static process, we have conducted UV-visible absorption spectral measurements of CDs with varying Fe3+ ion concentrations. Fig. S8† depicts the changes in the absorption spectrum of the CDs with respect to Fe3+ concentration. An isosbestic point was observed at 376 nm, which clearly indicates that ground state complex formation occurred between the CDs and the Fe3+ ions.Furthermore, to understand the dynamic quenching portion, time resolved fluorescence decay measurements were conducted using the time-correlated single-photon counting (TCSPC) technique. Generally, the changes in the fluorescence lifetime are direct evidence for a dynamic quenching process either via an electron or energy transfer mechanism. The poor overlap between the emission spectrum of the CDs and the absorption spectrum of the Fe3+ ions ruled out the possibility of an energy transfer mechanism.
To determine the contribution of the electron transfer quenching component to the combined quenching process, we have examined fluorescence decays recorded under excitation at 390 nm. Fig. 6 shows the fitted time-resolved fluorescence decays of the CDs in the absence and presence of Fe3+ ions. The fluorescence decay of the CDs alone was fitted with a bi-exponential function with the lifetimes of τ1 = 1.21 ns (39%) and τ2 = 3.04 ns (61%). In the presence of Fe3+ ions, the fluorescence decay of the CDs is shorterned with the lifetimes of τ1 = 0.01 ns (96%) and τ2 = 2.52 ns (4%). The reduced fluorescence lifetimes directly revealed that the origin of excited state quenching is due to the electron transfer from the CDs to the half-filled 3d orbital of the Fe3+ ions.52 As a result, we believe that ground state complexation followed by oxidative electron transfer from CDs to Fe3+ ions is the key processes that contribute to overall quenching.
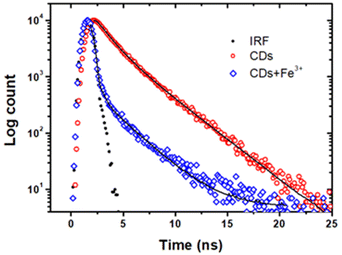 | ||
| Fig. 6 Time-resolved fluorescence decays of CDs in the absence (red) and in the presence (blue) of Fe3+ (10 μM) ions monitored at 450 nm (excitation: 390 nm). | ||
In vitro cytotoxicity and bio-imaging
To assess the bio-imaging applications of the prepared CDs, cytotoxicity studies should be conducted in live cells. Preceding reports have verified that carbon based fluorescent materials are biocompatible and exhibit little toxicity to cells.53,54 Thus, the in vitro cytotoxicity of CDs was assessed by using breast cancer cells (MDA-MB-231) with the methylthiazolydiphenyltetrazoliumbromide (MTT) assay and the results are shown in Fig. S9.† The MTT assay result reveals the low cytotoxicity up to 50 μg ml−1 and excellent biocompatibility nature of CDs in live cells.In addition, we assessed the labeling ability of CDs in live cells. As shown in Fig. 7a, blue emission occurred in the intracellular region after incubating the MDA-MB-231 breast cancer cells with CDs for 1 h. This implies that the same labeling performance can be achieved. Concurrently, the bright field images of CD-treated cells indicated the normal morphology of cells (Fig. 7c), endorsing the biocompatibility of CDs. To further investigate the application of CDs in monitoring intracellular Fe3+, MDA-MB-231 breast cancer cells treated with CDs were incubated for 30 min with 10 μM Fe3+ and imaged (Fig. 7b & d). As expected, the image (Fig. 7b) showed extremely weak fluorescence, indicating that CDs can be used for cell imaging and as an effective probe for intracellular Fe3+ sensing.
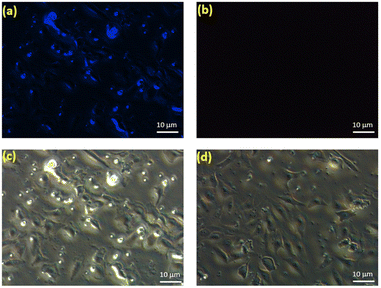 | ||
| Fig. 7 Fluorescence images of MDA-MB-231 breast cancer cells incubated with CDs (10 μg ml−1) in the (a–c) absence and (b–d) presence of Fe3+. Scale bar: 10 μm. | ||
Sensing of Fe3+ in real water samples
Water contamination with Fe3+ ions is detrimental since it decolorizes plumbing fixtures and imparts an unpleasant odour and taste to drinking water. Furthermore, Fe3+ promotes the growth of certain bacteria, resulting in fouling, pipe clogging and other negative environmental effects.55,56 Therefore, monitoring, controlling, and removing iron content from water are critical economic and environmental challenges. In this context, our aim is to quantify the iron content in real water samples. Thus, the developed fluorescent CD probe was used to detect Fe3+ ions in situ real water samples (pond, lake and tap water). Testing of these water samples was performed without any sample pre-treatment except for the addition of CDs and Fe3+ ions. Owing to the rapid response nature of CDs, no incubation time was maintained for recovery studies. The fluorescence intensity of CDs is not altered in all water samples, indicating that there are no intrinsic Fe3+ ions in the collected environmental water samples. In addition, the standard colorimetric thiocyanate method57 has been adopted to test the content of Fe3+ in real water samples. Intriguingly, comparable results were obtained, revealing that the analyzed water samples do not contain intrinsic Fe3+ ions. When different concentrations (0.5, 1, 3 and 5 μM) of Fe3+ ions were spiked into the water samples, the fluorescence intensity of CDs was altered and we were able to measure the Fe3+ concentrations. The average Fe3+ ion recovery and relative standard deviations (RSD) for three replicates of sensing measurements are depicted in Table S2.† In all of the real-water samples, the recovery of Fe3+ ions was determined to be ∼100%. These analytical results emphasize that the CDs derived from the Congo red dye could detect Fe3+ ions in a polluted environment.Development of paper-based analytical devices
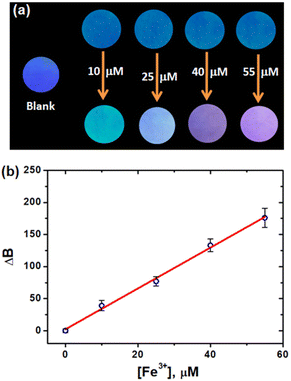
It was previously reported that paper-based strips were appropriate for on-site detection applications.58,59 In this regard, we have developed a CD-adsorbed paper-based analytical device for Fe3+ detection. Whatmann filter paper was cut into small round strips and dipped in the aqueous CD solution. After 2 minutes, the CD adsorbed strips were removed from the solution and allowed to dry at room temperature. The aqueous Fe3+ ion solutions were drop-cast onto the CD-adsorbed paper strip and allowed to dry at room temperature. Using a UV torch, the difference in the fluorescence of the CD-adsorbed paper strip was evaluated in order to explore the solid-state detection of metal ions. Fig. 8a depicts the photographs of the CD-adsorbed paper strips and strips with different concentrations of Fe3+ ions under UV light illumination. The CD-adsorbed paper strips undergo noticeable colour changes after being dipped in a solution of Fe3+ ions, suggesting that they can be utilized to detect the presence of Fe3+ ions in paper strips. Indeed, RGB colour intensity analysis on CD-adsorbed paper strips could achieve quantitative Fe3+ detection without the need for sophisticated equipment. The OpenCV library was used to extract the RGB values from fluorescent paper strips. For LOD calculations, the B values are considered due to the blue fluorescence of CDs (Fig. 4) and linearity was achieved in the range of 0–55 μM of Fe3+ ions. The LOD was determined from the slope of the linear plot (Fig. 8b) and is found to be 4.43 μM. These findings confirmed the robustness of the developed paper strip for the on-site detection of Fe3+ ions. Note: The power intensity and distance of the UV lamp may influence the RGB values of the paper strip. The best detection results could be obtained as long as the fluorescent sensor is placed within a certain range of UV lamp illumination.Ferritin sensing
Ferritin is the primary iron storage protein and plays an essential role in iron homeostasis maintenance.60,61 A deficiency of ferritin in the body can result in anaemia, whereas an excess of ferritin may lead to iron overload illness and hemochromatosis.62,63 As a result, ferritin detection and analysis are extremely important in clinical profession.64 In this context, owing to the high affinity, selectivity and sensitivity of CDs for Fe3+ ions, we were intended to investigate the interaction of the CDs with ferritin along with other proteins such as cytochrome c, myoglobin, human serum albumin (HSA), bovine serum albumin (BSA) and lysozyme. Notably, the pH of the solution was maintained at 6.0 to study the interaction between the CDs and ferritin, because ferritin cannot release Fe3+ at physiological pH.65 As anticipated, the CDs showed emission quenching with ferritin at 20 μg ml−1 concentration. Under the same experimental conditions, no other proteins showed any discernible quenching (Fig. 9a). The quenching of emission may be caused by the high abundance of Fe3+ in ferritin.66 Fluorescence titration studies of CDs with ferritin revealed concentration-dependent linear quenching (Fig. 9b) in the concentration range of 0–8 μg ml−1, and the LOD was determined from the linear plot to be 1.21 μg ml−1, which is comparable with the previously reported values for fluorimetric ferritin detection.67,68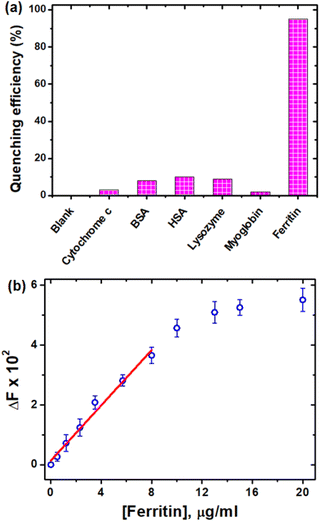 | ||
| Fig. 9 (a) Quenching efficiency of CDs with different proteins at pH 6 and (b) change in the fluorescence intensity of CDs with different concentrations of ferritin at pH 6. | ||
Conclusion
A toxic Congo red dye was meticulously valorized into biocompatible CDs. Their morphology, size and surface functional groups were thoroughly characterized by pivotal techniques. The as-synthesized CDs exhibited an excitation independent emission, long fluorescence lifetime and high fluorescence quantum yield. The fluorescence of the CDs is selectively quenched by Fe3+ over other interfering ions with a detection limit as low as 12 nM. The fluorescence quenching is caused by oxidative electron transfer from the excited CDs to the half-filled 3d-orbital of Fe3+ ions. On the other hand, CDs have been successfully used for cell imaging owing to their biocompatibility and have been shown to be quenched by intracellular Fe3+. Furthermore, the CDs were used to detect ferritin, with a sensitivity of 1.21 μg ml−1. Overall, the as-synthesized CDs have several advantages, including high fluorescence quantum yield, biocompatibility, rapid Fe3+ discrimination, less interference, and low cost.Author contributions
Arunkumar Kathiravan and Muthupandian Ashokkumar: methodology, experimental operation, writing – original draft, funding acquisition, and resources. Sekar Thulasi and Trevor A. Smith: data analysis, experimental operation, validation, and data curation. Mariadoss Asha Jhonsi: writing – review and supervision.Conflicts of interest
The authors have no conflicts of interest to declare.Acknowledgements
A. K. thanks the SERB Research Scientists scheme (SB/SRS/2018-2019-05/CS, dated: 30/01/2019). A. K. would like to express gratitude to Vel Tech Rangarajan Dr Sagunthala R & D Institute of Science and Technology for funding the analytical characterization charges. A. K. also thanks the sophisticated analytical instruments facility (SAIF), Indian Institute of Technology, Chennai, for the fluorescence lifetime measurements. MAJ thanks the BSACIST for providing the seed grant (ref. no. CSD/CSM/2022/08, dated: 14/07/2022) for conducting independent research. TAS acknowledges the support from the ARC Centre of Excellence in Exciton Science (CE170100026).References
- K. Litefti, M. S. Freire, M. Stitou and J. González-Álvarez, Sci. Rep., 2019, 9, 16530 CrossRef PubMed.
- N. P. Raval, P. U. Shah and N. K. Shah, Environ. Sci. Pollut. Res., 2016, 23, 14810–14853 CrossRef CAS PubMed.
- S. Vahidhabanu, A. A. Idowu, D. Karuppasamy, B. R. Babu and M. Vineetha, ACS Sustainable Chem. Eng., 2017, 5, 10361–10370 CrossRef CAS.
- J. Hu, H. Yu, W. Dai, X. Yan, X. Hu and H. Huang, RSC Adv., 2014, 4, 35124–35130 RSC.
- J. Sun, P. Ling and F. Gao, Anal. Chem., 2017, 89, 11703–11710 CrossRef CAS PubMed.
- L. Shen, Z. Jin, W. Xu, X. Jiang, Y. Shen, Y. Wang and Y. Lu, Ind. Eng. Chem. Res., 2019, 58, 7817–7824 CrossRef CAS.
- Y. Zheng, B. Cheng, J. Fan, J. Yu and W. Ho, J. Hazard. Mater., 2021, 403, 123559 CrossRef CAS PubMed.
- C. Zhao, B. Yang, J. Han, Y. Meng, L. Yu, D. Hou, J. Wang, Y. Zhao, Y. Zhai, S. Wang and X. Sun, Appl. Surf. Sci., 2018, 453, 502–512 CrossRef CAS.
- D. Olivo-Alanis, R. B. Garcia-Reyes, L. H. Alvarez and A. Garcia-Gonzalez, J. Hazard. Mater., 2018, 347, 423–430 CrossRef CAS PubMed.
- B. Ren, W. Shen, L. Li, S. Wu and W. Wang, Appl. Surf. Sci., 2018, 447, 711–723 CrossRef CAS.
- M. Chethana, L. G. Sorokhaibam, V. M. Bhandari, S. Raja and V. V. Ranade, ACS Sustainable Chem. Eng., 2016, 4, 2495–2507 CrossRef CAS.
- M. Harja, G. Buema and D. Bucur, Sci. Rep., 2022, 12, 1–18 CrossRef PubMed.
- Z. Yan, L. Fu, H. Yang and J. Ouyang, J. Hazard. Mater., 2018, 344, 1090–1100 CrossRef CAS PubMed.
- S. Sivalingam and S. Sen, Appl. Surf. Sci., 2019, 463, 190–196 CrossRef CAS.
- M. Stjepanović, N. Velić, A. Galić, I. Kosović, T. Jakovljević and M. Habuda-Stanić, Water, 2021, 13, 279 CrossRef.
- H. Zhang, Y. Chen, M. Liang, L. Xu, S. Qi, H. Chen and X. Chen, Anal. Chem., 2014, 86, 9846–9852 CrossRef CAS PubMed.
- X. Yang, F. Cui, R. Ren, J. Sun, J. Ji, F. Pi, Y. Zhang and X. Sun, ACS Omega, 2019, 4, 12575–12583 CrossRef CAS PubMed.
- H. Deng, C. Tian, Z. Gao, S.-W. Chen, Y. Li, Q. Zhang, R. Yu and J. Wang, Analyst, 2020, 145, 4931–4936 RSC.
- Q. Liu, X. Niu, K. Xie, Y. Yan, B. Ren, R. Liu, Y. Li and L. Li, ACS Appl. Nano Mater., 2021, 4, 190–197 CrossRef CAS.
- Z. Yang, M. She, B. Yin, J. Cui, Y. Zhang, W. Sun, J. Li and Z. Shi, J. Org. Chem., 2012, 77, 1143–1147 CrossRef CAS PubMed.
- W.-Y. Ong and A. A. Farooqui, J. Alzheimer's Dis., 2005, 8, 183–200 CAS.
- M. Zheng, H. Tan, Z. Xie, L. Zhang, X. Jing and Z. Sun, ACS Appl. Mater. Interfaces, 2013, 5, 1078–1083 CrossRef CAS PubMed.
- S. Mohandoss, S. Palanisamy, S. You and Y. R. Lee, J. Mol. Liq., 2022, 356, 118999 CrossRef CAS.
- Q. Zhang, Y. Sun, M. Liu and Y. Liu, Nanoscale, 2020, 12, 1826–1832 RSC.
- A. N. Fletcher, Photochem. Photobiol., 1969, 9, 439–444 CrossRef CAS PubMed.
- J. Drobnik and E. Yeargers, J. Mol. Spectrosc., 1966, 19, 454–455 CrossRef CAS.
- P. Wu, W. Li, Q. Wu, Y. Liu and S. Liu, RSC Adv., 2017, 7, 44144–44153 RSC.
- M. A. Issa, Z. Z. Abidin, S. Sobri, S. A. Rashid, M. A. Mahdi and N. A. Ibrahim, Sci. Rep., 2020, 10, 1–18 CrossRef PubMed.
- Z. Yi, X. Li, H. Zhang, X. Ji, W. Sun, Y. Yu, Y. Liu, J. Huang, Z. Sarshar and M. Sain, Talanta, 2021, 222, 121663 CrossRef CAS PubMed.
- K. Qu, J. Wang, J. Ren and X. Qu, Chem. – Eur. J., 2013, 19, 7243–7249 CrossRef CAS PubMed.
- P. Roy, P.-C. Chen, A. P. Periasamy, Y.-N. Chen and H.-T. Chang, Mater. Today, 2015, 18, 447–458 CrossRef CAS.
- T. Ogi, K. Aishima, F. A. Permatasari, F. Iskandar, E. Tanabe and K. Okuyama, New J. Chem., 2016, 40, 5555–5561 RSC.
- M. Zulfajri, G. Gedda, C.-J. Chang, Y.-P. Chang and G. G. Huang, ACS Omega, 2019, 4, 15382–15392 CrossRef CAS PubMed.
- X. J. Zhao, W. L. Zhang and Z. Q. Zhou, Colloids Surf., B, 2014, 123, 493–497 CrossRef CAS PubMed.
- R. Bandi, N. P. Devulapalli, R. Dadigala, B. R. Gangapuram and V. Guttena, ACS Omega, 2018, 3, 13454–13466 CrossRef CAS PubMed.
- A. Sachdev and P. Gopinath, Analyst, 2015, 140, 4260–4269 RSC.
- A. Kathiravan, A. Gowri, V. Srinivasan, T. A. Smith, M. Ashokkumar and M. A. Jhonsi, Analyst, 2020, 145, 4532–4539 RSC.
- Y. Zhang and J. He, Phys. Chem. Chem. Phys., 2015, 17, 20154–20159 RSC.
- J. Hou, L. Wang, P. Zhang, Y. Xu and L. Ding, Chem. Commun., 2015, 51, 17768–17771 RSC.
- A. Zhao, Z. Chen, C. Zhao, N. Gao, J. Ren and X. Qu, Carbon, 2015, 85, 309–327 CrossRef CAS.
- Z. O. Tesfaldet, J. F. van Staden and R. I. Stefan, Talanta, 2004, 64, 1189–1195 CrossRef CAS PubMed.
- D. M. C. Gomes, M. A. Segundo, J. L. F. C. Lima and A. O. S. S. Rangel, Talanta, 2005, 66, 703–711 CrossRef CAS PubMed.
- S. Lunvongsa, M. Oshima and S. Motomizu, Talanta, 2006, 68, 969–973 CrossRef CAS PubMed.
- K. Akatsuka, J. W. McLaren, J. W. Lam and S. S. Berman, J. Anal. At. Spectrom., 1992, 7, 889–894 RSC.
- A. Bobrowski, K. Nowak and J. Zarebski, Anal. Bioanal. Chem., 2005, 382, 1691–1697 CrossRef CAS PubMed.
- V. A. Elrod, K. S. Johnson and K. H. Coale, Anal. Chem., 1991, 63, 893–898 CrossRef CAS.
- K. Yokoi and C. M. G. Van den Berg, Electroanalysis, 1992, 4, 65–69 CrossRef CAS.
- A. Ohashi, H. Ito, C. Kanai, H. Imura and K. Ohashi, Talanta, 2005, 65, 525–530 CrossRef CAS PubMed.
- M. E. Sakaida, J. L. Kyle and J. L. Farber, Mol. Pharmacol., 1990, 37, 435–442 Search PubMed.
- E. Cooper, G. R. Lynagh, K. P. Hoyes, R. C. Hider, R. Cammack and J. B. Porter, J. Biol. Chem., 1996, 271, 20291–20299 CrossRef PubMed.
- S. Chakraborty, M. Mandal and S. Rayalu, Inorg. Chem. Commun., 2020, 121, 108189 CrossRef CAS.
- Y.-L. Zhang, L. Wang, H.-C. Zhang, Y. Liu, H.-Y. Wang, Z.-H. Kang and S.-T. Lee, RSC Adv., 2013, 3, 3733–3738 RSC.
- Y. Park, Y. Kim, H. Chang, S. Won, H. Kim and W. Kwon, J. Mater. Chem. B, 2020, 8, 8935–8951 RSC.
- M. J. Molaei, RSC Adv., 2019, 9, 6460–6481 RSC.
- T. D. Prasad and E. Danso-Amoako, Procedia Eng., 2014, 70, 1353–1361 CrossRef CAS.
- H. Armand, I. Stoianov and N. Graham, J. Hydroinf., 2017, 20, 424–439 CrossRef.
- J. Woods and M. Mellon, Ind. Eng. Chem., Anal. Ed., 1941, 13, 551–554 CrossRef CAS.
- B. Selvakumar and A. Kathiravan, Talanta, 2021, 235, 122733 CrossRef CAS PubMed.
- A. Kathiravan, S. Sengottiyan, T. Puzyn, P. Gopinath, K. Ramasubramanian, P. A. Susila and M. A. Jhonsi, Anal. Methods, 2022, 14, 518–525 RSC.
- L. A. Cohen, L. Gutierrez, A. Weiss, Y. Leichtmann-Bardoogo, D. L. Zhang, D. R. Crooks, R. Sougrat, A. Morgenstern, B. Galy, M. W. Hentze, F. J. Lazaro, T. A. Rouault and E. G. Meyron-Holtz, Blood, 2010, 116, 1574–1584 CrossRef CAS PubMed.
- J. L. Beard, L. E. Murray-Kolb, F. J. Rosales, N. W. Solomons and M. L. Angelilli, Am. J. Clin. Nutr., 2006, 84, 1498–1505 CrossRef CAS PubMed.
- B. Chiou and J. R. Connor, Pharmaceuticals, 2018, 11, 124 CrossRef CAS PubMed.
- E. Priyadarshini, K. Rawat, H. B. Bohidar and P. Rajamani, Microchim. Acta, 2018, 186, 687 CrossRef PubMed.
- N. Song, J. Zhang, J. Zhai, J. Hong, C. Yuan and M. Liang, Acc. Chem. Res., 2021, 54, 3313–3325 CrossRef CAS PubMed.
- S. L. Baader, G. Bruchelt, R. Handgretinger and D. Niethammer, J. Biochem. Biophys. Methods, 1992, 25, 11 CrossRef CAS PubMed.
- J. Johnson, J. Kenealey, R. J. Hilton, D. Brosnahan, R. K. Watt and G. D. Watt, J. Inorg. Biochem., 2011, 105, 202 CrossRef CAS PubMed.
- W. Schrott, M. Nebyla, L. Meisterová and M. Přibyl, Fast ferritin immunoassay on PDMS microchips, Chem. Pap., 2011, 65, 246–250 CAS.
- M. Garg, N. Vishwakarma, A. L. Sharma and S. Singh, ACS Appl. Nano Mater., 2021, 4, 7416–7425 CrossRef CAS.
Footnote |
| † Electronic supplementary information (ESI) available. See DOI: https://doi.org/10.1039/d2an01674e |
| This journal is © The Royal Society of Chemistry 2023 |

