A highly sensitive competitive aptasensor for AFB1 detection based on an exonuclease-assisted target recycling amplification strategy
Hongyan
Zhan
 ab,
Si
Yang
 ab,
Chenxi
Li
*a,
Rong
Liu
a,
Wenliang
Chen
ab,
Xiaoli
Wang
c,
Yansong
Zhao
d and
Kexin
Xu
ab
ab,
Chenxi
Li
*a,
Rong
Liu
a,
Wenliang
Chen
ab,
Xiaoli
Wang
c,
Yansong
Zhao
d and
Kexin
Xu
ab
aState Key Laboratory of Precision Measuring Technology and Instruments, Tianjin University, Tianjin 300072, PR China. E-mail: lichenxi@tju.edu.cn; Tel: +86-22-27404238
bSchool of Precision Instruments and Optoelectronics Engineering, Tianjin University, Tianjin 300072, PR China
cDepartment of Medical Imaging, Weifang Medical University, Weifang, Shandong 261053, China
dDepartment of Ophthalmology, Clinical Medical Institute, Affiliated Hospital, Weifang Medical University, Weifang, Shandong 261031, China
First published on 28th November 2022
Abstract
Aflatoxin B1 (AFB1) is a typical mycotoxin found in agricultural products, and poses a huge threat to both humans and animals. Accurate and rapid measurement of AFB1 is essential for environmental analysis and food safety. Based on molecular docking simulation design and exonuclease-assisted target recycling amplification, we designed a competitive fluorescence aptasensor to detect AFB1 rapidly and sensitively. According to the molecular docking simulations, a complementary strand (cDNA) was designed by searching for potential binding sites of the aptamer, which had the lowest binding energy. Magnetic beads modified with biotin-Apt were used as the capture probe, while FAM-labeled cDNA acted as the reporter probe. By using EXO I for target recycling amplification, this aptasensor was highly sensitive and selective for AFB1. The detection limit of the suggested aptasensor under optimal conditions was 0.36 ng mL−1 (S/N = 3) in the range of 1–1000 ng mL−1 (R2 = 0.991). The developed aptasensor was successfully used to analyze AFB1 in oil samples.
1. Introduction
Aflatoxin B1 (AFB1) is a dangerous mycotoxin and a probable Group I carcinogen,1,2 generated by a variety of aspergillus species, and often infects agricultural crops such as corn, peanuts and cassava. Due to its teratogenicity and carcinogenicity, AFB1 causes adverse effects on human health, such as genetic anomalies, hepatitis and cancers.3 In order to prevent food contamination incidents, AFB1 levels are restricted and controlled in many countries. According to the Chinese Food Hygiene Standard, AFB1 levels in corn, peanuts and related products are limited to 20 μg kg−1, and the levels in soybean and its oil products are limited to 5 μg kg−1 and 10 μg kg−1 respectively,4 while the European Union (EU) standard is 2 μg kg−1.5 Considering its impact on food safety, the development of highly sensitive, specific and rapid analytical methods to detect AFB1 is of vital importance.Many analytical methods are available for detecting and quantifying AFB1, including high-performance liquid chromatography (HPLC),6 liquid chromatography-mass spectrometry (LC-MS)7 and thin layer chromatography (TLC).8 However, expensive instrumentation, professional operators and complicated sample preparation procedures make these methods limited in on-site detection. Immunoassay methods based on antibodies have been applied to AFB1 detection,9–11 but unstable antibodies may affect its performance. Aptamers are artificially-synthesized single-stranded oligonucleotides that can be used for target recognition with high specificity and affinity.12,13 Taking advantage of high sensitivity, simple synthesis, easy modification, storage stability and low cost, aptamers are utilized as probes in many different types of detection.14
However, most biosensors with high sensitivity and selectivity are designed with the competition principle and typically necessitate the creation of complementary strands (cDNA)15–17 to convert the process of recognition and combination of aptamers to the target into fluorescent, electrochemical or colorimetric signals. In order to detect low-level AFB1, there have been considerable efforts to enhance the sensitivity of biosensors by signal amplification, such as chain reaction and rolling circle.18–20 This method involves a complex fabrication process because the number of base pairs in the cDNA and its complementary region to the aptamer would seriously affect the performance of sensors. In addition, necessitating the cDNA sequence design ensures that it can separate from the aptamer in competition with the target. To make aptasensors more sensitive, Chen et al.21 constructed the optimal complementary sequence by selecting five sequences with different numbers of base pairs. Ma et al.22 experimentally investigated the effect of different complementary regions and lengths of four cDNA on the sensitivity of chloramphenicol detection. These experiments demonstrated that the biosensor would take more time to create cDNA sequences replacing the detected target substance. When the target aptamer sequence gets longer, the construction of cDNA will be a burden. Hence, there is a challenge in developing AFB1 sensors with high sensitivity and practicality.
Molecular docking could simulate aptamer–ligand interactions and completely characterize complexes,23 allowing for generating accurate three-dimensional (3D) models and the elucidation of detailed binding sites.24 Ma et al.25 used molecular docking to predict the critical bases of aptamer binding to chloramphenicol, and then trimmed the 80-base aptamer to 30 bases for designing the biosensor. Through molecular docking, the recognition mechanism between the aptamer and target can be analyzed and quantified in detail to construct a highly sensitive and reliable apasensor, which involved a complementary sequence and competitive strategy. In addition, exonuclease I (EXO I) has been employed to establish an AFB1 aptasensor, which can degrade ssDNA in the direction from the 3′ to 5′ -terminus.26 Its sequence-independent digestion performance also makes it a universal signal amplification platform for various substances.
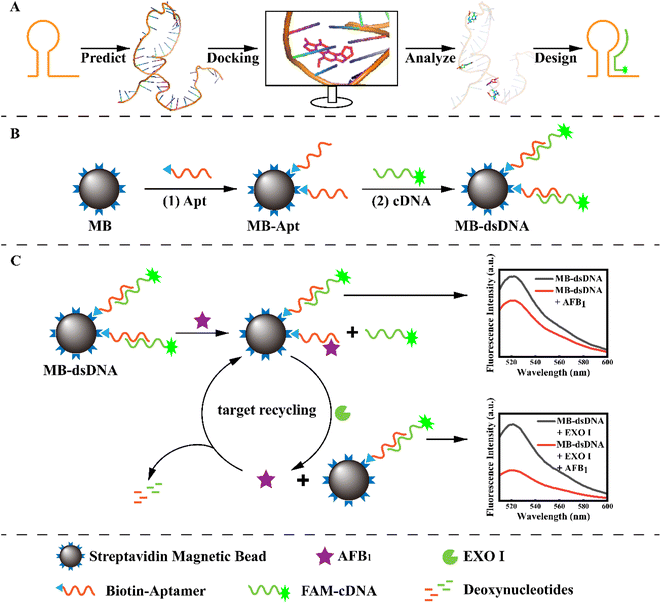
In this work, a competitive fluorescence aptasensor was constructed using an exonuclease-assisted target recycling amplification strategy to detect low levels of AFB1. The complementary sequence of the aptamer was designed with the molecular docking simulation by predicting and comparing the binding sites of the aptamer and AFB1. To assemble this competitive aptasensor, the reporter probe FAM-cDNA was ligated to aptamer-modified magnetic beads (MB) by base pairing. Meanwhile, Exo I could digest the aptamer bound to AFB1, releasing the analyte and enabling target cycle amplification. Then AFB1 could be quantified by the change in fluorescence intensities. The molecular docking approach conveniently supported the design of the complementary sequence and the enzyme-assisted target recycling amplification strategy successfully achieved signal amplification, which both provided high-precision AFB1 detection in practical applications.
2. Materials and methods
2.1 Materials and reagents
AFB1 aptamer and its cDNA were synthesized by Shanghai Sangon Biotechnology Co. Ltd. (Shanghai China). The sequence of the AFB1 aptamer was proposed by NeoVenture Biotechnology Inc. (Canada) in 2012.27 Six thymines at the 5′ end could reduce steric hindrance. The sequence of cDNA was developed according to the results of molecular docking simulations.AFB1 aptamer (Apt): 5′-biotin-TTT TTT GTT GGG CAC GTG TTG TCT CTC TGT GTC TCG TGC CCT TCG CTA GGC CCA CA-3′.
Complementary strand (cDNA): 5′-FAM-TTT AAG GGC ACG AGA CA-3′.
Standards of AFB1, zearalenone (ZEN), ochratoxin A (OTA) and the quality control peanut oil samples were purchased from Pribolab Co., Ltd. (Qingdao, China). Streptavidin immobilized magnetic beads (MB) were purchased from Beyotime Biotechnology (Shanghai, China). Exonuclease I (Exo I) was purchased from Shanghai Sangon Biotechnology Co. Ltd. (Shanghai China). Tris(hydroxymethyl)aminomethane, EDTA, 10× phosphate-buffered saline (PBS), bovine serum albumin (BSA), Tween-20, sodium chloride (NaCl), magnesium chloride (MgCl2) and potassium chloride (KCl) were purchased from Aladdin (Shanghai, China). Millipore Milli-Q water (18 MΩ cm) supplied by a Millipore Milli-Q water purification system (Bedford, MA. USA) was used throughout.
Several buffers were prepared for the aptasensor assembly and analyte reaction:
Buffer A used for magnetic beads was a mixture of 10 mM Tris–HCl (pH 7.5), 1 M NaCl, 1 mM EDTA and 0.02% (v/v) Tween-20; buffer B used for AFB1 and aptamer binding was a mixture of 10 mM Tris–HCl (pH 8.0), 120 mM NaCl, 5 mM MgCl2, 5 mM KCl and 0.02% (v/v) Tween-20.
2.2 Molecular docking simulations
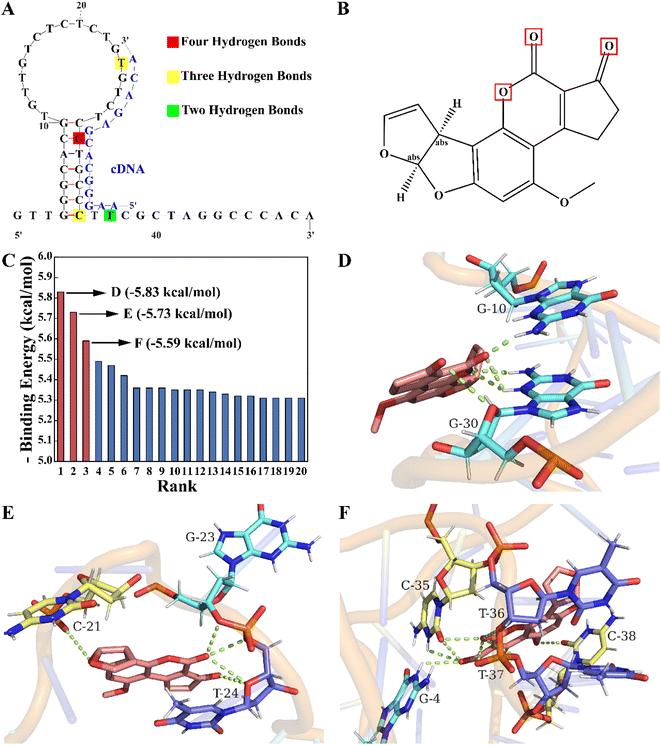
The secondary structure of the AFB1 aptamer was predicted by the Mfold web server23 and then its tertiary structures were obtained from Xiao Lab (http://biophy.hust.edu.cn/new/). The binding energy of the aptamer with AFB1 was estimated using the AutoDockTools (ADT) 1.5.7 package. The potential binding sites and type of interactions were notable results after visualization of aptamer/AFB1 complexes using PyMol.2.3 Fabrication of the MB-dsDNA aptasensor
The MB-dsDNA aptasensor is composed of two parts: surface modification of MB with the biotin-aptamer and hybridization of the aptamer to cDNA. It was prepared according to well-established standard operation procedures. Aptamers were heated at 95 °C for 10 min and then kept at −20 °C for 15 min. 10 μL 1 mg mL−1 magnetic beads and 20 μL 500 nmol L−1 aptamers were added into a centrifuge tube with buffer A. After 30 min incubation at room temperature, the MB-Apt capture probes were formed. After two times of magnetic separation and washing, 2% BSA was added to block excess surface binding sites and avoid unnecessary interference.28 Subsequently, 20 μL of 1 μM FAM-labeled cDNA was mixed with washed MB-Apt and then reacted at 37 °C for 60 min. After two times of magnetic separation and washing, the MB-dsDNA aptasensor was resuspended in buffer B.2.4 Procedure of AFB1 detection
MB-dsDNA aptasensors and 7.5 U EXO I were mixed with the AFB1 solutions (100 μL) at various concentrations in different centrifuge tubes. After incubation at 37 °C with a gentle shake for 60 min, they were washed two times and resuspended in 50 μL PBS. Then the fluorescence intensity was measured using a Spectra Max i3X microplate reader with 485 nm excitation and 517 nm emission wavelengths.2.5 Preparation of oil samples
Corn oil and soybean oil were obtained from a local market and the absence of AFB1 was confirmed by ELISA. AFB1-positive samples were prepared as follows: oil samples were first mixed with AFB1 standard solutions to obtain various spiked samples (5, 10, and 50 ng mL−1). 5 g of oil was added to 15![[thin space (1/6-em)]](https://www.rsc.org/images/entities/char_2009.gif) mL of extraction solution (methanol
mL of extraction solution (methanol![[thin space (1/6-em)]](https://www.rsc.org/images/entities/char_2009.gif) :
:![[thin space (1/6-em)]](https://www.rsc.org/images/entities/char_2009.gif) water, 20
water, 20![[thin space (1/6-em)]](https://www.rsc.org/images/entities/char_2009.gif) :
:![[thin space (1/6-em)]](https://www.rsc.org/images/entities/char_2009.gif) 80) and vortexed for 20 min; after 10 min centrifugation, the supernatant was filtered (0.22 μm) and diluted with buffer B to reduce the impact of impurities and methanol.
80) and vortexed for 20 min; after 10 min centrifugation, the supernatant was filtered (0.22 μm) and diluted with buffer B to reduce the impact of impurities and methanol.
3. Results and discussion
3.1 Principle and design of the AFB1 aptasensor
As illustrated in Scheme 1, the principle of the developed aptasensor is double-strand competition and target recycling amplification. The specific binding sites of Apt and AFB1 were predicted by molecular docking to ensure competitive efficiency and gain high sensitivity. To construct the MB-dsDNA competitive aptasensor, the MB-Apt capture probe was formed by combining the aptamers with streptavidin-modified magnetic beads via the streptavidin–biotin bond, as shown in step (1). The corresponding complementary strand was designed and labeled with 6-FAM as a signal probe. Then, Apt and cDNA formed dsDNA through complementary base pairing on the magnetic bead surface, resulting in maximum fluorescence. Because aptamers bound to AFB1 more strongly than double-strand pairing, the FAM-cDNA might be released from the surface of magnetic beads via AFB1 substitution. Meanwhile, EXO I could degrade single-strand DNA, and digest the aptamer that bound to the AFB1, which substituted more FAM-cDNA. Thus the target recycling amplification was achieved. After the magnetic beads were separated using a magnet, the free cDNA in the supernatant would be washed away. AFB1 was quantified according to the fluorescence intensity.3.2 Molecular docking simulations of the aptamer for cDNA
According to the competition principle, the length and region of the complementary sequence may affect the aptasensor's sensitivity. In our study, molecular docking simulations were performed to identify key bases of the aptamer to the target and assist in determining the base sequence of the cDNA. As shown in Fig. 1A, the aptamer secondary structure was predicted using Mfold. After being constructed and optimized by XiaoLab, its tertiary structure was used as a rigid receptor to search for potential binding sites by the Lamarckian genetic algorithm of AutoDockTools. Autodock's scoring function is related to the intermolecular binding energy, which usually includes hydrogen bonds, van der Waals interactions and electrostatic potential in the receptor–ligand interactions. Based on this scoring function, the docking results indicate that the lower the binding energy is, the more stable the binding of the aptamer to the target is, which also demonstrates the higher binding probability. The binding energy rank results of twenty docking conformations are shown in Fig. 1C. To reduce the impact of chance coincidence, the three conformations with the lowest binding energies were further analyzed. In the conformation with the lowest binding energy (−5.83 kcal mol−1), there were four hydrogen bonds mainly between the G30 base (Fig. 1D) and furan, and the carbonyl group (Fig. 1B) of AFB1. In the other two conformations (Fig. 1E and F) with low binding energies (−5.73 kcal mol−1 and −5.59 kcal mol−1), there were three hydrogen bonds between T24, C35 base and AFB1, and two hydrogen bonds between the T37 base and AFB1. These findings indicated that a crucial area for aptamer binding to AFB1 was the stem-loop structure, in which the G30, T24, C35 and T37 bases played a critical role. To achieve a promising competitive effect, the active site sequence of the aptamer located from the 24th to the 37th bases was selected as the hybridization region of the cDNA.3.3 Feasibility of double-strand competition and EXO I-assisted amplification
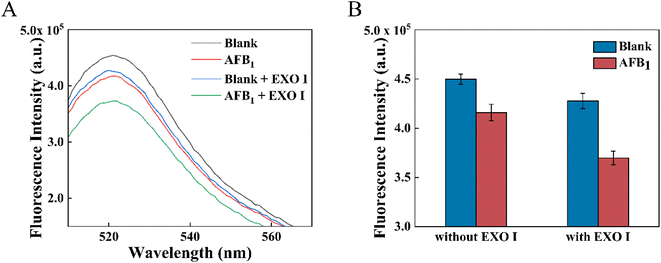
The feasibility of the proposed dsDNA competition and target recycling amplification strategy was first verified and shown in Fig. 2A. About 1.7 times fluorescence signal decrease was obtained under the action of EXO I. This signal enhancement was related to the extra AFB1 released due to the decomposition of aptamers by EXO I. In the control experiment, the maximum fluorescence intensity of the MB-dsDNA aptasensor was reached under the conditions of 100 μL blank solution without AFB1 and EXO I. After 10 ng mL−1 AFB1 was added, the aptamer preferred to bind with AFB1, resulting in the release of cDNA and the decrease of fluorescence intensity. The fluorescence signal decreased slightly after EXO I was added into the blank sample, which might be because there was still a small amount of FAM-cDNA that was non-specifically adsorbed to the magnetic beads before the addition of EXO I. What's more, it was possible that EXO I might have a non-specific breakdown effect on double-stranded DNA.29 The downward trend of fluorescence intensity was obvious when 10 ng mL−1 AFB1 and EXO I were added, under the effect of target recycling amplification. EXO I acted on the aptamer and destroyed the aptamer/AFB1 complex, allowing an AFB1 molecule to compete for more cDNA in the dsDNA. Thus, it led to more obvious fluorescence intensity decreases in Fig. 2B. The fluorescence response demonstrated that it was feasible to detect AFB1 through the proposed dsDNA competition and target recycling amplification strategy.3.4 Optimization of the proposed aptasensor
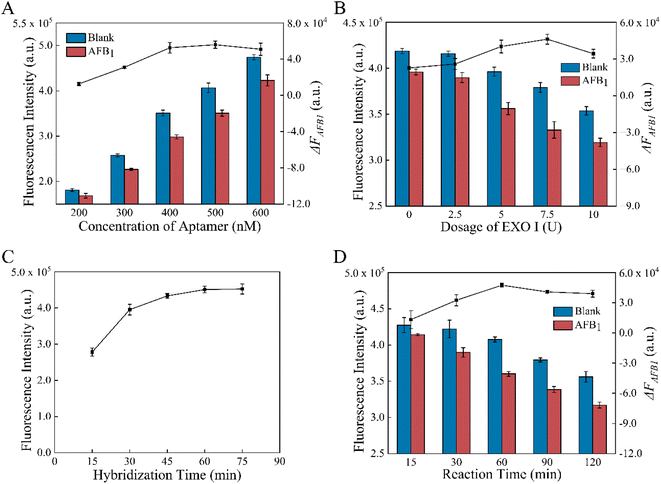
To enhance the performance of the aptasensor, some factors were optimized, such as aptamer concentration, amount of EXO I, formation and reaction time. According to Fig. 3A, increasing the concentration of the aptamer from 200 nM to 600 nM raised the fluorescence intensity F0 of the MB-dsDNA aptasensor. When AFB1 was present, the fluorescence intensity decrease value ΔFAFB1 increased from 200 to 500 nM aptamer concentration, reached the maximum value at 500 nM, and then decreased slightly at 600 nM. This result indicates that the excess amounts of aptamers may also lead to a limited fluorescence decrease. The maximum signal change caused by AFB1 was achieved when 500 nM aptamers were in buffer A.As expected, Fig. 3B illustrates that the amounts of Exo I had influences on F0 and ΔFAFB1. F0 decreased with the increase of EXO I from 0 U to 10 U, indicating the cleavage of cDNA that was nonspecifically attached to the magnetic beads. ΔFAFB1 increased with the amount of EXO I increasing to 7.5 U, however, declined somewhat as the amount exceeded 7.5 U. These results demonstrated that the nonspecific digestion of dsDNA by the excessive amounts of EXO I might cause the decrease of ΔFAFB1. Therefore, 7.5 U EXO I in buffer B was selected as the best condition.
Finally, the impact of formation time and reaction time for the aptasensor was studied. It was demonstrated in Fig. 3C that the double-strand binding was enhanced with the increase of formation time, and thus the fluorescence intensity increased. However, there was no longer a significant increase after 60 min. According to the experimental results, 60 min incubation was optimal for the dsDNA assembly because the maximum fluorescence intensity and rapid assembly could be obtained under these conditions. The reaction time of competition and digestion might affect ΔFAFB1. As shown in Fig. 3D, it took 60 min for AFB1/aptamer binding and EXO I-assisted target recycling amplification with gentle shaking incubation at 37 °C to obtain the maximum of ΔFAFB1. After 60 min, EXO I acted more on non-specific cleavage of dsDNA than the digestion of aptamers combined with AFB1. So 60 min was determined to be the optimal reaction time.
3.5 Performance of the MB-dsDNA aptasensor
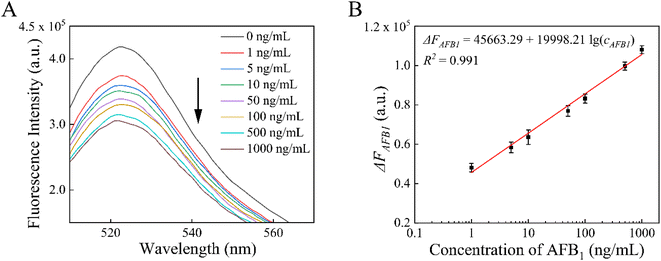
Under the optimal conditions, we successfully detected various concentrations of AFB1 (1, 5, 10, 50, 100, 500, and 1000 ng mL−1) by using the proposed aptasensor. Fig. 4A shows the fluorescence responses of this aptasensor to varying levels of AFB1. In the range of 1–1000 ng mL−1, ΔFAFB1 and the logarithm of AFB1 concentration (cAFB1) exhibited good linearity, as shown in Fig. 4B. The calibration linear equation was ΔFAFB1 = 45![[thin space (1/6-em)]](https://www.rsc.org/images/entities/char_2009.gif) 663.29 + 19
663.29 + 19![[thin space (1/6-em)]](https://www.rsc.org/images/entities/char_2009.gif) 998.21
998.21![[thin space (1/6-em)]](https://www.rsc.org/images/entities/char_2009.gif) lg(cAFB1) (R2 = 0.991). The limit of quantitation for AFB1 was determined to be 0.36 ng mL−1 (S/N = 3), which based on the signal change was 3 times the standard deviation of the blank sample signal.
lg(cAFB1) (R2 = 0.991). The limit of quantitation for AFB1 was determined to be 0.36 ng mL−1 (S/N = 3), which based on the signal change was 3 times the standard deviation of the blank sample signal.
The linear range and LOD are compared in Table 1 between our study and other aptasensors based on chemiluminescence and fluorescence methods. The chemiluminescence method30 could detect 0.2 ng mL−1 of AFB1 but the process was time-consuming and tedious. According to a recent report by Zou et al.,31 ultrasensitive performance with 0.066 ng mL−1 LOD of AFB1 could be achieved by means of fluorescence, but the linear range was relatively narrow. The proposed aptasensor showed good detection capability of a wide linear range and high sensitivity, as well as simple operation and rapid analysis. Target recycling amplification assay further improved the sensitivity of this MB-dsDNA aptasensor.
| Method | Reagent | Linear range | LOD | Ref. |
|---|---|---|---|---|
| Chemiluminescence | HRP, H2O2 | 0.5–40 ng mL−1 | 0.2 ng mL−1 | 30 |
| Fluorescence | DNAzyme | 0.12–4.8 ng mL−1 | 0.066 ng mL−1 | 31 |
| Fluorescence | Cy5 | 0.2–20 ng mL−1 | 0.16 ng mL−1 | 32 |
| Fluorescence | UiO-66-NH2 | 0–180 ng mL−1 | 0.35 ng mL−1 | 33 |
| Fluorescence | MB, FAM | 1–1000 ng mL−1 | 0.36 ng mL−1 | This work |
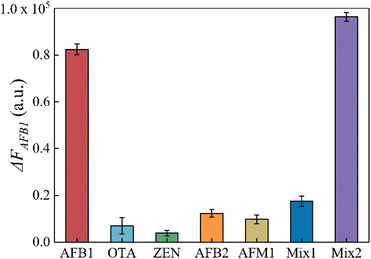
To assess the specificity of this aptasensor, other common mycotoxins in agricultural products such as OTA, ZEN, AFB2 and AFM1 were investigated as interferences. The mix1 group contained OTA, ZEN, AFB2 and AFM1, and the mix2 group contained OTA, ZEN, AFB2, AFM1 and AFB1. The concentrations of AFB1 and interferences were 100 ng mL−1 and 1000 ng mL−1, as well as in the mix samples. As shown in Fig. 5, ΔFAFB1 caused by other mycotoxins was apparently lower even when their concentration was 10 times that of AFB1. This result confirms that this aptasensor has excellent specificity to AFB1.
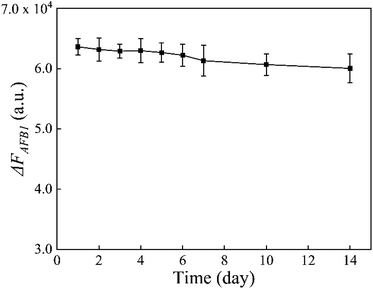
In addition, the stability of the MB-dsDNA aptasensor was monitored by keeping it at 4 °C for some days. When the set concentration of 10 ng mL−1 AFB1 was detected, Fig. 6 showed a slight decrease of ΔFAFB1 with increased storage time. But the fluorescence response remained generally stable over a 14 day period, which indicated the good stability of the proposed aptasensor.
3.6 Detection of AFB1 in oil samples
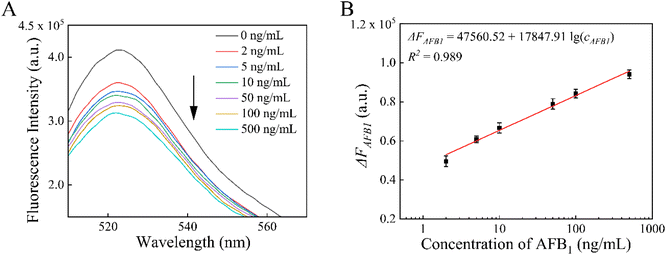
To verify the feasibility of this MB-dsDNA aptasensor for real sample detection, oil samples with various concentrations of AFB1 were analyzed. As shown in Fig. 7, fluorescence intensity decreased with increasing concentration, and ΔFAFB1 exhibited good linearity in the range of 2–500 ng mL−1. The calibration linear equation was ΔFAFB1 = 47![[thin space (1/6-em)]](https://www.rsc.org/images/entities/char_2009.gif) 560.52 + 17
560.52 + 17![[thin space (1/6-em)]](https://www.rsc.org/images/entities/char_2009.gif) 847.91
847.91![[thin space (1/6-em)]](https://www.rsc.org/images/entities/char_2009.gif) lg (cAFB1) (R2 = 0.989) with a detection limit of 0.51 ng mL−1 (S/N = 3). Furthermore, the performance of this aptasensor in diverse sample matrixes was estimated by detecting AFB1 in corn oil, soybean oil and quality control peanut oil samples. As shown in Table 2, the AFB1 levels measured using the proposed aptasensor and the commercial ELISA method were essentially the same, confirming the accuracy and reliability of this aptasensor. The recoveries of AFB1 were between 93.38% and 114.8% with the relative standard deviations (RSDs) no more than 7.81%, indicating acceptable accuracy of this MB-dsDNA aptasensor in detecting AFB1 in real samples. Furthermore, this suggested approach is feasible for food safety supervision and regulation.
lg (cAFB1) (R2 = 0.989) with a detection limit of 0.51 ng mL−1 (S/N = 3). Furthermore, the performance of this aptasensor in diverse sample matrixes was estimated by detecting AFB1 in corn oil, soybean oil and quality control peanut oil samples. As shown in Table 2, the AFB1 levels measured using the proposed aptasensor and the commercial ELISA method were essentially the same, confirming the accuracy and reliability of this aptasensor. The recoveries of AFB1 were between 93.38% and 114.8% with the relative standard deviations (RSDs) no more than 7.81%, indicating acceptable accuracy of this MB-dsDNA aptasensor in detecting AFB1 in real samples. Furthermore, this suggested approach is feasible for food safety supervision and regulation.
| Sample | Reference (ng mL−1) | Detected (ng mL−1) | Recovery (%) | RSD (%) | ELISA (ng mL−1) |
|---|---|---|---|---|---|
| Corn oil | 5 | 5.69 | 113.8 | 6.03 | 5.32 |
| 10 | 11.48 | 114.8 | 7.81 | 11.09 | |
| 50 | 46.69 | 93.38 | 6.12 | 49.78 | |
| Soybean oil | 5 | 5.39 | 107.8 | 3.07 | 5.63 |
| 10 | 11.35 | 113.5 | 4.93 | 10.52 | |
| 50 | 53.64 | 107.28 | 4.86 | 51.73 | |
| Quality control oil | 12.44 | 13.11 | 105.39 | 6.34 | 12.69 |
| 17.80 | 17.06 | 95.84 | 5.92 | 17.57 |
4. Conclusions
This study developed a new aptasensor for AFB1 detection with the use of double-strand competition and exonuclease-assisted target recycling amplification. The results of molecular docking simulations suggested key bases of the aptamer and its cDNA was designed according to the results. After optimization, the proposed aptasensor shows a low detection level of 0.36 ng mL−1 within a wide range of 1–1000 ng mL−1. The discovery of spiked oil samples indicates that the proposed sensor could be applied to sensitive and rapid AFB1 detection in food products.Conflicts of interest
We declare that we do not have any commercial or associative interest that represents a conflict of interest in connection with the work submitted.Acknowledgements
The authors acknowledge the financial support provided by the National Natural Science Foundation of China, grant numbers 81871396 and 81971657; Tianjin Natural Science Foundation, grant number 20JCZDJC00630.References
- S. Akgönüllü, H. Yavuz and A. Denizli, Talanta, 2020, 219, 121219 CrossRef.
- W.-B. Shim, M. J. Kim, H. Mun and M.-G. Kim, Biosens. Bioelectron., 2014, 62, 288–294 CrossRef PubMed.
- A. S. Hamid, S. G. Tesfamariam, Y. Zhang and Z. G. Zhang, Oncol. Lett., 2013, 5, 1087–1092 CrossRef.
- X. Ding, P. Li, Y. Bai and H. Zhou, Food Control, 2012, 23, 143–148 CrossRef.
- S. M. Herzallah, Food Chem., 2009, 114, 1141–1146 CrossRef.
- H. Yazdanpanah, A. Zarghi, A. R. Shafaati, S. M. Foroutan, F. Aboul-Fathi, A. Khoddam, F. Nazari and F. Shaki, Iran. J. Pharm. Res., 2013, 12, 83 Search PubMed.
- M. R. Khan, Z. A. Alothman, A. A. Ghfar and S. M. Wabaidur, J. Sep. Sci., 2013, 36, 572–577 CrossRef.
- K. Kotinagu, T. Mohanamba and L. Rathna Kumari, Vet. World, 2015, 8, 1396 CrossRef CAS PubMed.
- W. Jiang, Z. Wang, G. Nölke, J. Zhang, L. Niu and J. Shen, Food Anal. Methods, 2013, 6, 767–774 CrossRef.
- X. Zhang, C. R. Li, W. C. Wang, J. Xue, Y. L. Huang, X. X. Yang, B. Tan, X. P. Zhou, C. Shao, S. J. Ding and J. F. Qiu, Food Chem., 2016, 192, 197–202 CrossRef PubMed.
- Y. Tang, W. Lai, J. Zhang and D. Tang, Microchim. Acta, 2017, 184, 2387–2394 CrossRef.
- H. Hasegawa, N. Savory, K. Abe, K. Ikebukuro, A. O. A. Miller, J. Jacques and V. Eynde, Molecules, 2016, 21, 421 CrossRef.
- H. Yu, O. Alkhamis, J. Canoura, Y. Liu and Y. Xiao, Angew. Chem., Int. Ed., 2021, 60, 16800–16823 CrossRef.
- J. Zhou, M. R. Battig and Y. Wang, Anal. Bioanal. Chem., 2010, 398, 2471–2480 CrossRef CAS.
- J. J. Zhang, J. T. Cao, G. F. Shi, K. J. Huang, Y. M. Liu and Y. H. Chen, Anal. Methods, 2014, 6, 6796–6801 RSC.
- Y. Li, L. Sun and Q. Zhao, Anal. Chem., 2019, 91, 2022 Search PubMed.
- Y. Jiang, D. Sun, Z. Liang, L. Chen, Y. Zhang and Z. Chen, Sens. Actuators, B, 2018, 262, 35–43 CrossRef CAS.
- N. Zhang, J. Li, B. Liu, D. Zhang, C. Zhang, Y. Guo, X. Chu, W. Wang, H. Wang, X. Yan and Z. Li, Talanta, 2022, 236, 122866 CrossRef CAS.
- C. Zhu, D. Liu, Y. Li, T. Chen and T. You, Food Chem., 2022, 373, 131443 CrossRef CAS.
- L. Hao, W. Wang, X. Shen, S. Wang, Q. Li, F. An and S. Wu, J. Agric. Food Chem., 2020, 68, 369–375 CrossRef CAS.
- L. Chen, F. Wen, M. Li, X. Guo, S. Li, N. Zheng and J. Wang, Food Chem., 2017, 215, 377–382 CrossRef PubMed.
- X. Ma, H. Li, S. Qiao, C. Huang, Q. Liu, X. Shen, Y. Geng, W. Xu and C. Sun, Food Chem., 2020, 302, 125359 CrossRef.
- Y. Yang, Y. Yin, X. Li, S. Wang and Y. Dong, Sens. Actuators, B, 2020, 319, 128250 CrossRef.
- X. Qi, Y. Zhao, H. Su, L. Wang, L. Li, R. Ma, X. Yan, J. Sun, S. Wang and X. Mao, Talanta, 2022, 238, 123032 CrossRef PubMed.
- P. Ma, H. Guo, N. Duan, X. Ma, L. Yue, Q. Gu and Z. Wang, Talanta, 2021, 230, 122349 CrossRef PubMed.
- H. Cui, K. An, C. Wang, Y. Chen, S. Jia, J. Qian, N. Hao, J. Wei and K. Wang, Sens. Actuators, B, 2022, 355, 131238 CrossRef CAS.
- L. C. Le, J. A. Cruz-Aguado and G. A. Penner. DNA Ligands for Aflatoxin and Zearalenone, US pat. PCT/CA2010/001292, Sep 6, 2012 Search PubMed.
- H. Zhang, W. Mao, Y. Hu, X. Wei, L. Huang, S. Fan, M. Huang, Y. Song, Y. Yu and F. F. Fu, Spectrochim. Acta, Part A, 2022, 271, 120862 CrossRef PubMed.
- L. Tang, Y. Huang, C. Lin, B. Qiu, L. Guo, F. Luo and Z. Lin, Talanta, 2020, 214, 120862 CrossRef.
- Y. Yao, H. Wang, X. Wang, X. Wang and F. Li, Talanta, 2019, 201, 52–57 CrossRef PubMed.
- L. Zou, M. Zhang, M. Li, Z. Xiao and L. Ling, Food Res. Int., 2022, 158, 111538 CrossRef PubMed.
- Z. Zhao, H. Wang, W. Zhai, X. Feng, X. Fan, A. Chen and M. Wang, Toxins, 2020, 12, 136 CrossRef PubMed.
- Y. Jia, G. Zhou, X. Wang, Y. Zhang, Z. Li, P. Liu, B. Yu and J. Zhang, Talanta, 2020, 219, 121342 CrossRef CAS PubMed.
| This journal is © The Royal Society of Chemistry 2023 |

