Inner filter effect-based red-shift and fluorescence dual-sensor platforms with sulfur quantum dots for detection and bioimaging of alkaline phosphatase†
Keke
Ning
,
Yao
Fu
,
Jianghong
Wu
,
Yujie
Sun
,
Ke
Liu
,
Kang
Ye
,
Jiaxin
Liu
,
Yuan
Wu
 and
Jiangong
Liang
 *
*
College of Science, State Key Laboratory of Agricultural Microbiology, Huazhong Agricultural University, Wuhan, 430070, P. R. China. E-mail: liangjg@mail.hzau.edu.cn
First published on 22nd November 2022
Abstract
Alkaline phosphatase (ALP), one of the vital biomarkers in several diseases, plays a role in indicating disease presence or severity in early diagnosis. Here, a simple H2O2 assisted top-down method was used to synthesize sulfur quantum dots (SQDs) with excitation and emission at 355 nm and 440 nm. Adding ALP into p-nitrophenyl phosphate (p-NPP) and SQDs was found to exhibit a red shift in the emission wavelength and fluorescence intensity quenching of SQDs, respectively, allowing us to propose dual-sensor platforms of red shift of emission wavelength (RSEW) and fluorescence quenching of SQDs. These dual-sensor platforms were highly sensitive and selective in ALP detection, with a linear response to ALP in the concentration range of 0.25 to 100 U L−1 and detection limits of 0.08 and 0.10 U L−1, respectively. The absorption of p-NP at 400 nm showed a good overlap with the excitation and emission of SQDs, leading to inner filter effect-based RSEW and fluorescence quenching of SQDs. This sensor platform was successfully applied in ALP sensing of serum samples as well as monitoring of ALP in cells. More importantly, this platform can serve as an example of using RSEW to detect ALP.
1. Introduction
Recently, with the sustained development of nanomaterials, researchers have paid great attention to metal-free element quantum dots (QDs), such as sulfur quantum dots (SQDs), carbon quantum dots (CDs), silicon quantum dots (SiQDs), graphene quantum dots (GQDs), etc. Among them, SQDs as brand-new metal free QDs have attractive properties for fluorescence sensing, including the advantages of good aqueous dispersibility,1 low toxicity,2 and inherent antibacterial properties.3 Since their first report in 2014,4 there have been few reports on SQDs to date owing to the challenges in synthesizing high-quality SQDs by feasible approaches. With the unremitting efforts of various scientists, the quantum yield (QY) of SQDs increased gradually. Recently, SQDs with a QY up to 87.8% were obtained via a one-pot solvothermal method.5 Simultaneously, the synthetic methods were further improved and enriched. Additionally, by revealing structure–property relationships, SQDs have been applied in fluorescence sensing, electrochemical sensing,6 electrochemiluminescence sensing,7 and photocatalysis.8 Among these potential applications, fluorescence sensing has attracted more attention owing to simplicity, swift response, and high sensitivity.9 Currently, SQDs are widely used in fluorescent sensing, including glutathione,2 doxycycline,10 Fe3+,11 tetracycline,12 chromium(VI), ascorbic acid,13etc. Nevertheless, SQD-based assay sensors are still in their infancy.Most previously reported probes were focused on changes in fluorescence intensity (on or off). However, fluorescence intensity as a parameter to quantify the analytical target may cause some problems, due to various analyte-independent interfering factors, such as microenvironment changes and local concentrations around probes.14 Simultaneously, fluorescence intensity lacked excellent stability and could be easily affected by the instrument and environmental conditions.15 Fluorescent sensors are known to have different spectral parameters, such as fluorescence intensity, fluorescence life time, fluorescence wavelength, etc.16 Fluorescence wavelength shift features the advantage that, unlike fluorescence intensity, it is more accurate and virtually unaffected by other factors such as particle density and background noise.15 Studies have shown that fluorescence wavelength shift could amplify the fluorescence signal, contributing to the realization of sensing.17 Metal–organic frameworks (MOFs) have been used as probes through red shift sensing for the detection of amines,18 acetylacetone,19 Al3+ and Ga3+.20 Conjugated polymers as red-shift probes achieved the detection of pH response and enzyme activity.21 CdTe QDs and gold–silver nanoclusters were used as red-shift probes for the detection of Ag+ (ref. 22) and cysteine.23 However, to our knowledge, there is no report on the use of SQD sensors for substance detection through fluorescence wavelength shift.
Alkaline phosphatase (ALP), a general and significant hydrolase with a molecular weight of ∼56 KDa, is a zinc glycoprotein of 449 amino acids and can non-specifically catalyze the hydrolysis of nearly all phosphate monoesters involved in various biological processes.24 ALP was reported as an important biomarker for the diagnosis of various diseases, such as bone diseases, breast and prostatic cancer, diabetes, liver dysfunction, intestinal diseases, heart failure, etc.25 Many fluorescent probes have been successfully used for ALP detection, including folic acid functionalized molybdenum oxide quantum dots (FA–MoOx QDs),26L-histidine (His) functionalized zeolite imidazole framework ZIF-8 (His@ZIF-8),27 copper nanoclusters (Cu NCs),28 MoS2 QDs,29 and ZnS QDs.30 However, these probes suffer from the drawbacks of poor photostability and multistep procedures, suggesting the necessity to develop a plain fluorescent probe for ALP detection through fluorescence sensing.
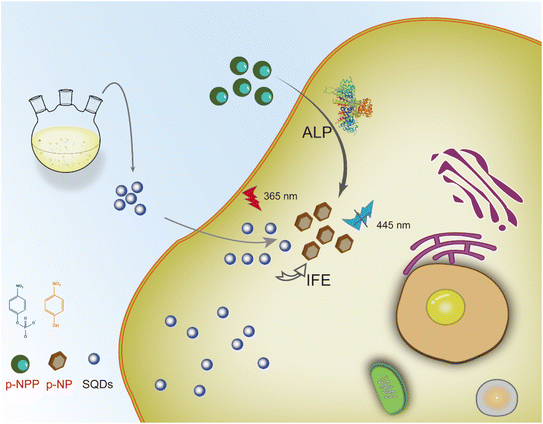
In this work, we combined the properties of the red shift of emission wavelength (RSEW) and fluorescence quenching of SQDs to achieve ALP detection using the dual parameters of the fluorescence wavelength and fluorescence intensity. With increasing ALP addition, both the difference of the fluorescence emission wavelength and the quenching efficiency of fluorescence intensity of SQDs had good linear relationships with ALP concentration. Meanwhile, the RSEW method was shown to be superior to the fluorescence method in selectivity. Additionally, the mechanisms of RSEW and fluorescence quenching of SQDs were investigated and shown to be attributed to the inner filter effect (IFE). These dual-sensor platforms have the advantages of rapidity, economy, high sensitivity and selectivity. Considering the low cytotoxicity of SQDs, we further investigated the possibility of establishing a fluorescence approach for monitoring ALP in cells (Scheme 1).
2. Results and discussion
2.1. Characterization of SQDs
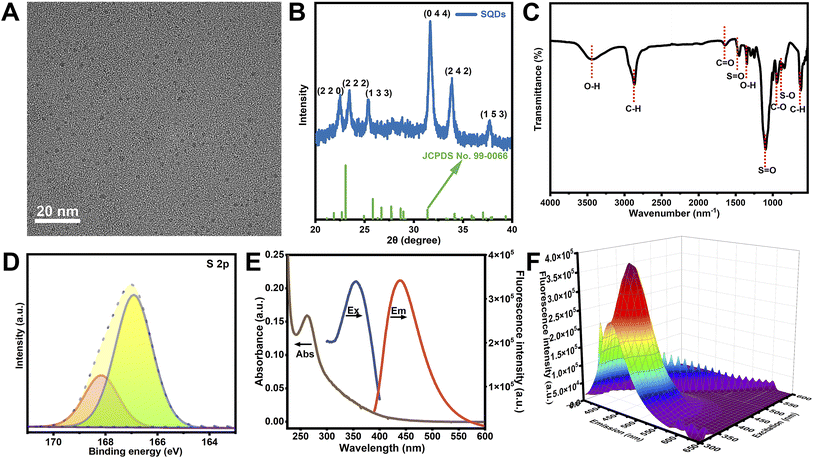
The morphology of SQDs was characterized by TEM (Fig. 1A), which was seen to be monodispersed in the view. SQDs showed a typical spherical appearance with an average size of 2.4 nm (Fig. S1A†), and the distinct crystal lattice spacing was obtained by high-resolution transmission electron microscopy (HRTEM), with the spacing of the two lattices being measured to be 0.23 nm (Fig. S1B†). Fig. 1B shows the XRD pattern of the SQDs, with the peaks of 22.2° (2 2 0), 23.2° (2 2 2), 25.1° (1 3 3), 31.4° (0 4 4), 33.6° (2 4 2), and 37.5° (1 5 3) being comparable to JCPDS no. 99-0066 both in position and intensity, indicating the generation of a sulfur polycrystalline phase.12 The surface functional groups of SQDs were characterized by FTIR spectroscopy. In Fig. 1C, the peaks at 1455 cm−1 and 1151 cm−1 were related to the asymmetric and symmetric stretching vibrations of S![[double bond, length as m-dash]](https://www.rsc.org/images/entities/char_e001.gif) O bands. The absorption peak at 870 cm−1 was attributed to the S–O band, proving the successful etching of H2O2.11 The absorption peaks at 3411 cm−1, 2873 cm−1 and 1640 cm−1 were ascribed to O–H, C–H, and C
O bands. The absorption peak at 870 cm−1 was attributed to the S–O band, proving the successful etching of H2O2.11 The absorption peaks at 3411 cm−1, 2873 cm−1 and 1640 cm−1 were ascribed to O–H, C–H, and C![[double bond, length as m-dash]](https://www.rsc.org/images/entities/char_e001.gif) O, respectively.12 The peaks at 1351 cm−1, 950 cm−1, and 631 cm−1 indicated the stretching vibrations of O–H, C–O and C–H, and there were no other new FTIR peaks found on the synthesized SQDs. The above results indicated a physical interaction rather than a chemical interaction between SQDs and PEG-400. In Fig. S1C,† the XPS survey spectrum showed the existence of C, O and S elements, and in the high-resolution XPS S 2p spectrum of Fig. 1D, the two peaks at 166.9 eV and 168.1 eV were attributed to SO22− (2p2/3) and SO22− (2p1/2), respectively.31 In Fig. 1E, the UV-vis absorption spectrum showed an obvious band at 264 nm, ascribed to the n–π* transition of S atoms.1 The fluorescence spectrum suggested that the SQDs emitted blue fluorescence with a 440 nm maximum emission wavelength at 355 nm excitation. Fig. 1F shows the excitation wavelength dependence in the wavelength range of 300 to 600 nm of SQDs. The QY of the prepared SQDs is 22.3%.
O, respectively.12 The peaks at 1351 cm−1, 950 cm−1, and 631 cm−1 indicated the stretching vibrations of O–H, C–O and C–H, and there were no other new FTIR peaks found on the synthesized SQDs. The above results indicated a physical interaction rather than a chemical interaction between SQDs and PEG-400. In Fig. S1C,† the XPS survey spectrum showed the existence of C, O and S elements, and in the high-resolution XPS S 2p spectrum of Fig. 1D, the two peaks at 166.9 eV and 168.1 eV were attributed to SO22− (2p2/3) and SO22− (2p1/2), respectively.31 In Fig. 1E, the UV-vis absorption spectrum showed an obvious band at 264 nm, ascribed to the n–π* transition of S atoms.1 The fluorescence spectrum suggested that the SQDs emitted blue fluorescence with a 440 nm maximum emission wavelength at 355 nm excitation. Fig. 1F shows the excitation wavelength dependence in the wavelength range of 300 to 600 nm of SQDs. The QY of the prepared SQDs is 22.3%.
2.2. Sensitivity of SQDs in ALP detection based on RSEW and fluorescence quenching
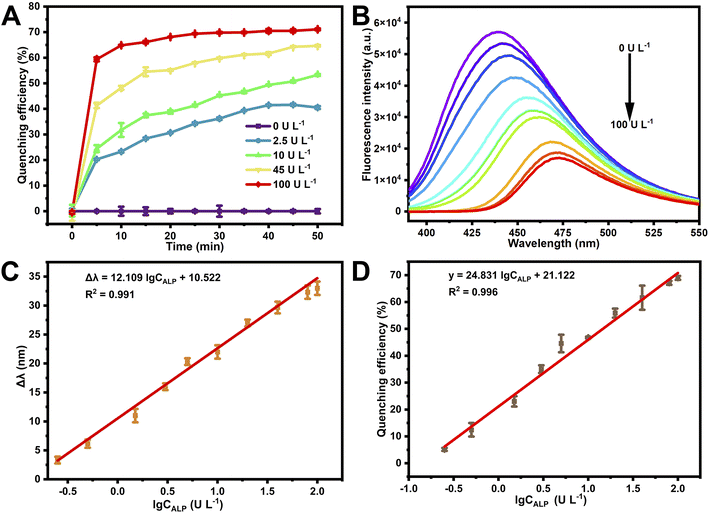
In order to improve the ALP detection performance, the effects of pH, reaction time, and p-NP concentration were studied. In Fig. S2A,† pH 10.5 was seen to exhibit almost the maximum quenching efficiency and relatively mild reaction conditions. The optimal reaction time was investigated with ALP at 0, 2.5, 10, 45 and 100 U L−1 (Fig. 2A), and the quenching efficiency showed the maximal difference at a reaction time of 20 min, so 20 min was selected as the reaction time for further experiments. In Fig. S2B,† the SQDs were seen to have excellent fluorescence behavior without p-NP, while the presence of 500 μM p-NP was seen to substantially quench the fluorescence intensity to 20%. After optimization, the fluorescence platform of SQDs can be established by integrating ALP-mediated enzymatic reaction and p-NP quenching of SQDs. Fig. 2B displays the fluorescence spectra of SQDs with 500 μM p-NPP and a series of concentrations of ALP. As ALP was added into the SQD solution, the fluorescence intensity of SQDs exhibited a progressive decline and obvious red-shift, indicating the good sensitivity of SQDs to ALP.The fluorescence emission peaks of SQDs had a significant red shift in the ALP concentration range of 0.25 to 100 U L−1 (Fig. 2B), and as shown in Fig. 2C, a good linear relationship was established in the RSEW of SQDs (Δλ = λ1 − λ0) and the logarithm of ALP concentration, where λ1 is the wavelength of the SQDs in the presence of various concentrations of ALP and λ0 is the wavelength of the SQDs in the absence of ALP. The linear equation was Δλ = 12.109![[thin space (1/6-em)]](https://www.rsc.org/images/entities/char_2009.gif) lg
lg![[thin space (1/6-em)]](https://www.rsc.org/images/entities/char_2009.gif) CALP + 10.522 and the corresponding linear correlation coefficient was 0.991 with a limit of detection (LOD) (LOD = 3σ/s) of 0.08 U L−1 and a relative standard deviation (RSD) of 5.0% (c = 5.0 U L−1).
CALP + 10.522 and the corresponding linear correlation coefficient was 0.991 with a limit of detection (LOD) (LOD = 3σ/s) of 0.08 U L−1 and a relative standard deviation (RSD) of 5.0% (c = 5.0 U L−1).
Meanwhile, in the ALP concentration range of 0.25 to 100 U L−1, the fluorescence intensity of SQDs was quenched and showed a good linear relationship. Fig. 2D shows the relationship of the fluorescence quenching efficiency (y = (1 − F1/F0) × 100%) and the logarithm of ALP concentration. The linear equation was y = 24.831![[thin space (1/6-em)]](https://www.rsc.org/images/entities/char_2009.gif) lg
lg![[thin space (1/6-em)]](https://www.rsc.org/images/entities/char_2009.gif) CALP + 21.122 with a correlation coefficient R2 = 0.996. The LOD was 0.10 U L−1 and the RSD was 2.62% (c = 5.0 U L−1). This work provided a more sensitive method for ALP detection than most previously reported methods, as shown in Table S1.† The SQDs were non-toxic and simple in synthesis, and the RSEW method was slightly better than the fluorescence method in the LOD (0.08 versus 0.10 U L−1).
CALP + 21.122 with a correlation coefficient R2 = 0.996. The LOD was 0.10 U L−1 and the RSD was 2.62% (c = 5.0 U L−1). This work provided a more sensitive method for ALP detection than most previously reported methods, as shown in Table S1.† The SQDs were non-toxic and simple in synthesis, and the RSEW method was slightly better than the fluorescence method in the LOD (0.08 versus 0.10 U L−1).
2.3. Superiority of the RSEW method to the fluorescence method in selectivity
To evaluate the superiority of the RSEW method relative to the fluorescence method, we investigated the impact of foreign substances, such as metal ions, enzymes, and amino acids. In Fig. 3A, the emission wavelength of SQDs was seen to show a significant red shift in the presence of ALP (5.0 U L−1), and the fluorescence emission wavelength of SQDs was almost not affected by 100 μM of K+, Cu2+, Cd2+, Fe2+, Mg2+, Pb2+, Na+, Ba2+, Mn2+, Ni2+, Co2+, Zn2+, Hg2+, Ca2+ and Fe3+ using the RSEW method. However, when using fluorescence intensity as the parameter for the same fluorescence spectra, the fluorescence intensity of SQDs was seen to be evidently influenced by several metal ions, such as Fe2+, Pb2+, Ni2+, Co2+, Hg2+ and Fe3+. Similar results can be observed in Fig. 3B, where His, Arg, Gly, Lys, Pro, Cys, Ser, Met, trypsin, GOx, BSA and HRP had small effects on the emission wavelength of SQDs through the RSEW method, in contrast to obvious effects on the fluorescence intensity of SQDs by His, Lys, Met, trypsin, BSA and HRP when using the fluorescence intensity as the parameter. These results indicated that the RSEW method is superior to the fluorescence method in selectivity for the SQDs–ALP system.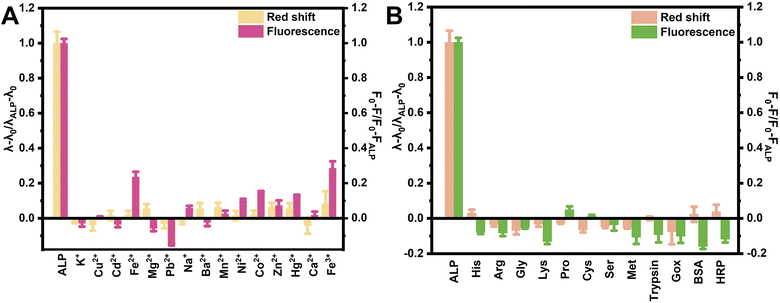 | ||
| Fig. 3 Selectivity of ALP (5.0 U L−1, 5.55 μg mL−1) detection in the presence of (A) metal ions (100 μM) and (B) amino acids (100 μM), trypsin, GOx, HRP (50 U L−1) and BSA (55.5 μg mL−1). | ||
2.4. Possible mechanism for ALP detection through RSEW and fluorescence quenching of SQDs
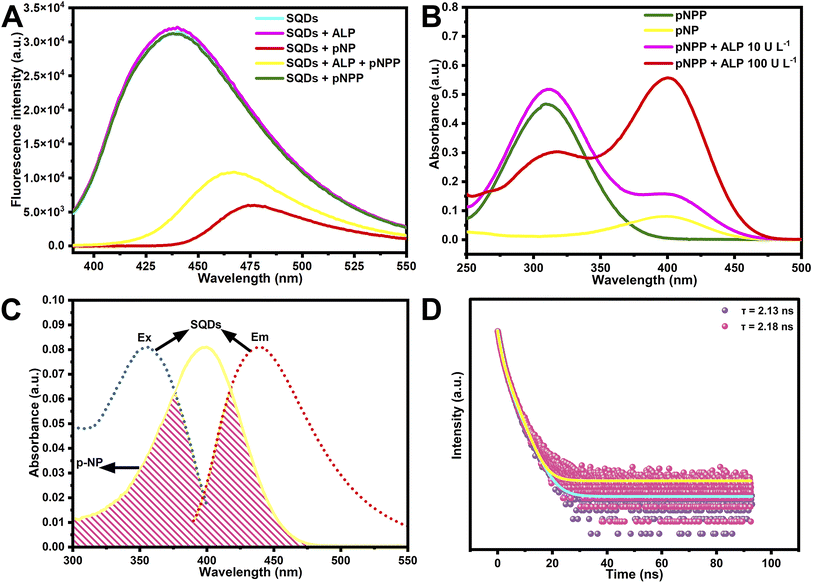
To explore the possible RSEW and fluorescence quenching mechanisms of SQDs in ALP detection, the fluorescence spectra of SQDs were investigated (Fig. 4A). SQDs, SQDs + ALP, and SQDs + p-NPP all showed no change in the fluorescence emission wavelength and fluorescence intensity, while SQDs + p-NP or SQDs + ALP + p-NPP displayed different degrees of RSEW and fluorescence quenching, indicating that p-NP might lead to the RSEW and quenching of SQDs. The UV-vis absorption spectra of p-NP and p-NPP with ALP were further investigated to elucidate the mechanism (Fig. 4B). The absorbance peak of p-NPP was located at 310 nm and the peak of p-NP at 400 nm. With an increase of ALP concentration, the p-NPP system changed. The decrease of UV-vis absorption spectrum at 310 nm indicates reduction of p-NPP concentration, and the enhancement of UV-vis absorption spectrum at 400 nm means the increase of p-NP concentration. The fluorescence excitation and emission spectra of SQDs displayed a broad overlap with the absorption of p-NP (Fig. 4C). These results indicated that the RSEW and fluorescence quenching of SQDs might have resulted from the IFE or Förster resonance energy transfer (FRET).32 Meanwhile, the zeta potential of SQDs was measured to be −18.4 mV, and p-NP was negatively charged in the alkaline environment. Therefore, the RSEW and fluorescence quenching could not be caused by electrostatic interactions between SQDs and p-NP for their negative charge properties, thereby precluding the mechanism of FRET or PET (photoinduced electron transfer).33 Simultaneously, the average lifetime varied in FRET and remained unchanged in the IFE.34 In Fig. 4D, SQDs were seen to show no significant difference in the absence (2.13 ns) and presence (2.18 ns) of p-NP. As previously reported,21 the absorption peak of p-NP overlapped with the emission spectrum of poly(p-phenylene) functionalized with oligo(oxyethylene) side chains (PPP–OR10), and the emission peak red-shift of PPP–OR10/p-NP was the result of the IFE. In Fig. 2B, the emission wavelength of SQDs was seen to red shift with the increase in the generation of p-NP, and in Fig. 4C, the absorption spectrum of p-NP showed a wide overlap with the fluorescence excitation and emission spectrum of SQDs. Therefore, the observed RSEW and fluorescence quenching of SQDs by p-NP might have resulted from the IFE. We further investigated whether the RSEW and fluorescence quenching caused by the IFE are buffer- or solvent-dependent. In Fig. S3,† four different pH 10.5 buffer solutions in the system all showed different degrees of RSEW and fluorescence quenching, suggesting that the mechanism was not caused by the buffer. In Fig. S4,† six different solvents were introduced into the system, which, as expected, exhibited RSEW and fluorescence quenching, confirming that the RSEW and fluorescence quenching of SQDs were caused by the IFE.2.5. Application of ALP sensors in the detection of bovine serum samples
In order to estimate the feasibility and accuracy of this nano-sensor probe, the standard addition method was used to detect ALP in bovine serum samples. As shown in Table S2,† the recoveries of ALP by the RSEW method ranged from 93.9% to 98.6%, with an RSD of 3.1% to 5.6%. In Table S3,† the recoveries of ALP via the fluorescence method were shown to range from 102.3% to 108.0%, with an RSD of less than 5.9%. These data indicated that both the RSEW method and the fluorescence method had good recovery, accuracy, and repeatability for monitoring ALP in biological matrices. The comparison of the recovery and RSD of the two methods indicated that the results were satisfactory, and the lower LOD of RSEW indicated that it is better to adopt its results as the final detection value for real samples.2.6. Bioimaging of SQDs and monitoring of ALP in MCF-7 cancer cells
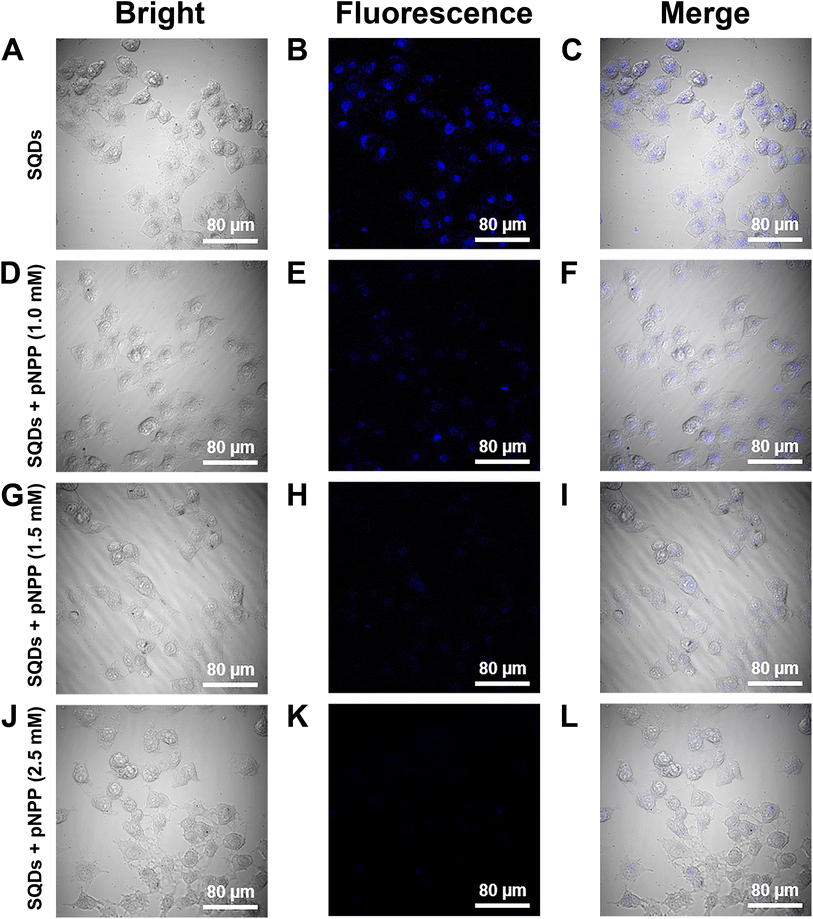
The cytotoxicity of SQDs was examined by the MTT assay with MCF-7 cancer cells. After incubation for 24 h, the cell viabilities were over 95% with 0–2.0 mg mL−1 of SQDs (Fig. S5A†), demonstrating the low cytotoxicity of SQDs. Additionally, the SQDs were used as a fluorescence agent to dye MCF-7 cells for cell imaging, and CLSM was used to evaluate the performance of SQDs in the imaging of endogenous ALP in MCF-7 cells. Fig. 5 presents the bright field (A, D, G and J), fluorescence (B, E, H and K), and merge field images (C, F, I and L), corresponding to MCF-7 cells incubated with SQDs under four different concentrations of p-NPP. In Fig. 5B, the strong blue fluorescence from SQDs in carcinoma cells under a 345 nm excitation wavelength illustrated that numerous SQDs were internalized into cells, indicating that SQDs could effortlessly penetrate cell membranes and/or enter cells by endocytosis. Besides, it proved that there really exists the IFE between SQDs and ALP. With the increase of the uptake concentration of p-NPP in cells, more and more p-NP was generated via the hydrolysis of p-NPP by endogenous ALP, leading to the quenching of SQDs in cells. The blue fluorescence showed a sharp decrease and 2.5 mM p-NPP almost caused fluorescence quenching in the cells (Fig. 5K). The fluorescence intensity of the cells could be measured by using ImageJ35 and the mean gray value in Fig. S5B† displayed gradual reduction with the increase of p-NPP concentration. These results proved that the SQDs–p-NPP sensor could monitor ALP in cells.In this work, the interaction of SQDs with p-NP generated via the hydrolysis of p-NPP by ALP led to wavelength shift and fluorescence quenching, which achieved the detection of ALP. The RSEW method with wavelength shift as the parameter had better anti-interference ability and LOD than the fluorescence method with intensity as the parameter. The probes, such as MOFs, conjugated polymers, CdTe QDs and gold–silver nanoclusters, also achieved substance detection through red-shift sensing, but they suffer from the defects of a complicated synthesis process, poor aqueous dispersion, use of hazardous organic solvents, containing toxic heavy metal elements or high cost. Unlike these aforementioned probes, the SQDs have the major advantages of a simple synthetic method, excellent aqueous solubility, and low cytotoxicity, enabling SQDs to act as a promising probe for red-shift sensing. Meanwhile, the wavelength changes caused by intermolecular interactions are recorded, which could be used to determine environmental changes, such as temperature, molecular structure, pH, and concentration suggesting the potential use of SQDs as a red-shifted probe in these fields.
3. Conclusions
In summary, IFE-based ALP detection was achieved by combining novel metal-free element SQDs (synthesized by a H2O2-assisted top-down method) with p-NP (generated via the hydrolysis of p-NPP by ALP). Due to the IFE, not only the RSEW of SQDs was induced, but also the fluorescence of SQDs was quenched, enabling us to obtain both the RSEW and fluorescence methods to detect ALP, with the linear range of 0.25 to 100 U L−1 and LODs of 0.08 and 0.10 U L−1, respectively. The dual-sensor platforms were successfully applied in ALP detection of bovine serum samples. Meanwhile, the excellent optical properties of SQDs enabled monitoring of ALP in cells. The IFE-based strategy proposed in this work provided a novel approach for facile and fast detection of enzymatic activity using SQDs.Author contributions
Keke Ning: conceptualization, methodology, data curation, software, visualization, and writing–original draft. Yao Fu: methodology and data curation. Jianghong Wu: validation and data curation. Yujie Sun: investigation and software. Ke Liu: methodology and visualization. Kang Ye: software and visualization. Jiaxin Liu: data curation. Yuan Wu: funding acquisition. Jiangong Liang: conceptualization, methodology, resources, review & editing, project administration, and funding acquisition.Conflicts of interest
The authors declare that they have no known competing interests or personal relationships that could have appeared to influence the work reported in this paper.Acknowledgements
This study was supported by the National Natural Science Foundation of China (22074048 and 21904046).References
- Z. M. Huang, Y. Gao, Z. Y. Huang, D. L. Chen, J. H. Sun and L. Zhou, Microchem. J., 2021, 170, 106656 CrossRef.
- S. Liu, J. W. Wang, Y. E. Shi, Y. Q. Zhai, Y. K. Lv, P. Zhang and Z. G. Wang, Spectrochim. Acta, Part A, 2022, 265, 120365 CrossRef PubMed.
- Y. Wang, Y. N. Zhao, J. L. Wu, M. Li, J. Tan, W. S. Fu, H. Tang and P. Zhang, Nano Lett., 2021, 21, 9433–9441 CrossRef PubMed.
- S. X. Li, D. J. Chen, F. Y. Zheng, H. F. Zhou, S. X. Jiang and Y. J. Wu, Adv. Funct. Mater., 2014, 24, 7133–7138 Search PubMed.
- P. X. Gao, Z. Y. Huang, J. S. Tan, G. S. Lv and L. Zhou, ACS Sustainable Chem. Eng., 2022, 10, 4634–4641 CrossRef.
- L. Fu, A. W. Wang, K. F. Xie, J. W. Zhu, F. Chen, H. G. Wang, H. W. Zhang, W. T. Su, Z. G. Wang, C. T. Zhou and S. C. Ruan, Sens. Actuators, B, 2020, 304, 127390 CrossRef.
- T. T. Han, J. L. Yang, Y. Wang, Y. Cao, Y. Y. Wang, H. Y. Chen and J. J. Zhu, Electrochim. Acta, 2021, 381, 138281 CrossRef.
- H. Y. Chen, X. J. Zhu, H. Huang, H. B. Wang, T. Wang, R. B. Zhao, H. G. Zheng, A. M. Asiri, Y. L. Luo and X. P. Sun, Chem. Commun., 2019, 55, 3152–3155 RSC.
- C. F. Lu, Y. Wang, B. Y. Xu, W. Zhang, Y. Xie, Y. Y. Chen, L. Z. Wang and X. X. Wang, Food Chem., 2022, 366, 130613 CrossRef PubMed.
- Y. R. Zhuang, B. X. Lin, Y. Yu, Y. M. Wang, L. Zhang, Y. J. Cao and M. L. Guo, Food Chem., 2021, 356, 129720 CrossRef.
- C. X. Wang, Z. T. Wei, C. W. Pan, Z. W. Pan, X. M. Wang, J. Liu, H. Z. Wang, G. Y. Huang, M. Wang and L. Q. Mao, Sens. Actuators, B, 2021, 344, 130326 CrossRef.
- H. X. Lu, H. Q. Zhang, Y. F. Li and F. Gan, RSC Adv., 2021, 11, 22960–22968 RSC.
- M. K. Xia, H. Mei, Q. H. Qian, R. A. Dahlgren, M. Gao and X. D. Wang, RSC Adv., 2021, 11, 10572–10581 RSC.
- P. Wu, X. D. Hou, J. J. Xu and H. Y. Chen, Nanoscale, 2016, 8, 8427–8442 RSC.
- J. Zhu, Z. J. Zhao, J. J. Li and J. W. Zhao, J. Lumin., 2017, 192, 47–55 CrossRef CAS.
- U. Alexiev and D. L. Farrens, Biochim. Biophys. Acta, 2014, 1837, 694–709 CrossRef CAS PubMed.
- S. L. Yao, H. Xu, T. F. Zheng, S. J. Liu, J. L. Chen and H. R. Wen, Cryst. Growth Des., 2021, 21, 5765–5772 CrossRef CAS.
- J. Othong, J. Boonmak, N. Wannarit, F. Kielar, T. Puangmali, W. Phanchai and S. Youngme, Sens. Actuators, B, 2021, 343, 130066 CrossRef CAS.
- L. Q. Li, S. L. Yao, X. M. Tian, T. F. Zheng, J. Y. Li, S. J. Liu, J. L. Chen, M. H. Yu and H. R. Wen, CrystEngComm, 2021, 23, 2532–2537 RSC.
- L. H. Wu, S. L. Yao, H. Xu, T. F. Zheng, S. J. Liu, J. L. Chen, N. Li and H. R. Wen, Chin. Chem. Lett., 2022, 33, 541–546 CrossRef CAS.
- Y. L. Tang, Y. Liu and A. L. Cao, Anal. Chem., 2013, 85, 825–830 CrossRef CAS PubMed.
- J. Wang, J. G. Liang, Z. H. Sheng and H. Y. Han, Microchim. Acta, 2009, 167, 281–287 CrossRef.
- T. Feng, Y. Chen, B. B. Feng, J. L. Yan and J. W. Di, Spectrochim. Acta, Part A, 2019, 206, 97–103 CrossRef PubMed.
- K. Shao, Y. Yang, S. Y. Ye, D. Y. Gu, T. Wang, Y. J. Teng, Z. L. Shen and Z. F. Pan, Talanta, 2020, 208, 120460 CrossRef PubMed.
- S. L. Moura, A. P. Rusinol, L. Sappia, M. Marti and M. I. Pividori, Biosens. Bioelectron., 2022, 198, 113826 CrossRef PubMed.
- M. R. Kateshiya, N. I. Malek and S. K. Kailasa, Spectrochim. Acta, Part A, 2022, 268, 120659 CrossRef PubMed.
- H. F. Sha and B. Yan, Anal. Chim. Acta, 2022, 1194, 339434 CrossRef PubMed.
- H. B. Wang, B. B. Tao, N. N. Wu, H. D. Zhang and Y. M. Liu, Spectrochim. Acta, Part A, 2022, 271, 120948 CrossRef PubMed.
- M. Madhu, C. M. Chao, C. Y. Ke, M. M. Hsieh and W. L. Tseng, Anal. Bioanal. Chem., 2022, 414, 1909–1919 CrossRef PubMed.
- G. J. Qin, L. X. Zuo, Y. L. Wei, L. Wang and G. Bodwell, Colloids Surf., B, 2021, 206, 111968 CrossRef PubMed.
- L. Xiao, Q. Du, Y. Huang, L. Wang, S. Cheng, Z. Wang, T. N. Wong, E. K. L. Yeow and H. Sun, ACS Appl. Nano Mater., 2019, 2, 6622–6628 CrossRef.
- Y. Z. Fan, Y. Zhang, N. Li, S. G. Liu, T. Liu, N. B. Li and H. Q. Luo, Sens. Actuators, B, 2017, 240, 949–955 CrossRef CAS.
- G. L. Li, W. H. Kong, M. Zhao, S. M. Lu, P. W. Gong, G. Chen, L. Xia, H. Wang, J. M. You and Y. N. Wu, Biosens. Bioelectron., 2016, 79, 728–735 CrossRef.
- H. J. Liu, M. Li, Y. N. Xia and X. Q. Ren, ACS Appl. Mater. Interfaces, 2016, 9, 120–126 CrossRef.
- E. Jensen, Anat. Rec., 2013, 296, 378–381 CrossRef.
Footnote |
| † Electronic supplementary information (ESI) available. See DOI: https://doi.org/10.1039/d2ay01658c |
| This journal is © The Royal Society of Chemistry 2023 |

