Nanocrystalline β-NiS: a redox-mediated electrode in aqueous electrolyte for pseudocapacitor/supercapacitor applications†
Vishal
Kushwaha
a,
Asha
Gupta
*a,
Ram Bilash
Choudhary
b,
K. D.
Mandal
a,
Rakesh
Mondal
c and
Preetam
Singh
 *c
*c
aDepartment of Chemistry, Indian Institute of Technology (Banaras Hindu University), Varanasi, Uttar Pradesh 221005, India. E-mail: asha.chy@itbhu.ac.in; toashagupta@gmail.com; Tel: +91-6390363140
bDepartment of Physics, Indian Institute of Technology (Indian School of Mines), Dhanbad 826004, India
cDepartment of Ceramic Engineering, Indian Institute of Technology (Banaras Hindu University), Varanasi, Uttar Pradesh 221005, India. E-mail: preetamsingh.cer@itbhu.ac.in; preetamchem@gmail.com; Tel: +91-9473720659
First published on 14th November 2022
Abstract
Currently, enhancing the performance of electrochemical supercapacitors is the subject of intense research to fulfill the ever-increasing demand for grid-scale energy storage and delivery solution, thereby utilizing the full potential of renewable energy resources and decreasing our dependence on fossil fuels. Metal sulfides, such as cobalt sulfide (CoS), nickel sulfide (NiS), molybdenum sulfide (MoS), copper sulfide (CuS), and others, have recently emerged as a promising class of active electrode materials, alongside other supercapacitor electrode materials, due to their relatively high specific capacitance values and exceptional reversible redox reaction activities. The synthesis, characterizations, and electrochemical performances of single-phase nanocrystalline β-NiS are presented here and the electrode based on this material shows a specific capacitance of 1578 F g−1 at 1 A g−1 from the galvanostatic discharge profile, whereas a capacitance of 1611 F g−1 at 1 mV s−1 was obtained through the CV curve in 2 M KOH aqueous electrolyte. Additionally, the electrode also performs well in neutral 0.5 M Na2SO4 electrolytes resulting in specific capacitance equivalent to 403 F g−1 at 1 mV s−1 scan rate. The high charge storage capacity of the material is due to the superior intercalative (inner) charge storage coupled with the surface (outer) charges stored by the β-NiS electrode and was found to be 72% and 28%, respectively, in aqueous 2 M KOH electrolyte. This intercalative charge storage mechanism is also responsible for its excellent cycling stability. Additionally, we assembled aqueous asymmetric supercapacitors (ASCs) with activated carbon (AC) as the negative electrode and the β-NiS electrode as the positive electrode. The combination of the β-NiS electrode and AC with excellent cycling stability resulted in the highest specific energy equivalent to ∼163 W h kg−1 and a specific power of ∼507 W kg−1 at 1 A g−1 current rate.
Introduction
The tremendous growth of the worldwide economy resulting in climate changes, a rise in pollution, a steady depletion of fossil resources, and the energy crisis due to the demand vs. supply gap has boosted and pushed the demand for clean, renewable energy resources that are both sustainable and efficient. The most significant technological challenge the world is facing today is the efficient utilization of renewable energy resources and, for that, the grid-scale energy storage/delivery solution is required due to the fluctuating nature of power generation through renewables. In recent years, because of their outstanding characteristics of long cycling life, high power density, rapid recharge capability, higher capacitance, and flexibility, electrochemical supercapacitors (ECs) have received much attention for application in electric vehicles, portable devices, and other electronic devices that require tremendous electrical energy at elevated power levels in tiny pulses.1–5ECs are the subject of intense research in order to enhance their performance and they are capable of bridging the performance gap between dielectric capacitors and rechargeable batteries by providing higher power and energy density values. ECs are divided into two categories based on the charge storage mechanisms and active materials: electric double-layer capacitors (EDLCs) and pseudocapacitors. The capacity of EDLCs is derived from electrostatic charges accumulating at the electrode/electrolyte interface. In addition to using an electrostatic electric double layer, pseudocapacitors store electrical energy in a faradaic component, which is the insertion of the electrolyte's mobile cation into the host electrode, reducing the host-electrode cation.6,7
Various materials such as carbonaceous materials, transition metal oxides or hydroxides, and conducting polymers have all been investigated for use as supercapacitor electrodes but are constrained by their low rate capability. Carbon materials in actual supercapacitors typically have specific capacity (Cs) values of 75–175 F g−1 for aqueous electrolytes and 40–100 F g−1 for organic electrolytes,8 which are lower than that of transition metal oxides or hydroxides. As pseudocapacitors have a greater theoretical specific capacitance than ordinary EDLCs, they find more applications as cathodes for supercapacitors. In this regard, considerable research efforts have been made towards designing and synthesizing various high-performance pseudocapacitive anode materials, such as Fe2O3,9 Fe3O4,10 Co3O4,11 V2O5,12 MoO3,13 and transition-metal sulfides,14,15 in recent times. Among them, transition metal sulfides such as WS2,16 FeS2,17 MoS2,18 CuS,19 CoS,20 and NiS21–31 have recently gained more interest and have been widely used as the anode materials for supercapacitors due to their low electronegativity, excellent electrical conductivity, high specific capacitance, and rich electrochemical redox sites in comparison with their oxide counterparts. Hou et al.21 reported the first use of NiS as a supercapacitor electrode. Further, they proposed an electrochemical reaction mechanism. Zhu et al.22 designed and fabricated hierarchical hollow structures to examine the increased electrochemical performance of nickel sulfide.
NiS has drawn much attention because of its exceptional electrical conductivity, low toxicity, affordability, simplicity of manufacture, and variety of valence states.23–28 For instance, it is frequently used as a catalyst in hydrogenation and carbon liquefaction processes and to store solar energy.29 Additionally, its impacts on toughened glass and its carcinogenic effects have drawn much attention.
NiS, NiS2, Ni3S2, Ni3S4, and Ni9S8, as well as amorphous and nanocrystalline phases, are among the known solid phases of nickel sulfides. The most prevalent nickel sulfide minerals among these solid phases are millerite (NiS), heazlewoodite (Ni3S2), polydymite (Ni3S4), and vaesite (NiS2). There are two types of nickel(II) monosulfide (NiS): NiAs-type NiS (also known as α-NiS; space group: P63/mmc)30 and millerite (also known as β-NiS; space group: R3m). At low temperatures (below 652 K), millerite is the stable form of NiS, but at higher temperatures, NiAs-type NiS is more stable. Millerite is the most prevalent nickel sulfide mineral and nickel ore mineral.31
In this article, we present the synthesis, characterizations, and electrochemical performances of β-NiS nanoparticles, and they show the phonon confinement effect confirmed by Raman and UV-visible spectra. The β-NiS electrode shows a specific capacitance of 1578 F g−1 at 1 A g−1 from the galvanostatic discharge profile, whereas a capacitance of 1611 F g−1 at 1 mV s−1 was obtained through CV curves in 2 M KOH aqueous electrolyte. Additionally, we assembled aqueous asymmetric supercapacitors (ASCs) with activated carbon (AC) as the negative electrode and the β-NiS electrode as the positive electrode. The ASCs type full cell containing the β-NiS active electrode and AC (counter electrode) show excellent cycling stability resulting in the highest specific energy equivalent to ∼163 W h kg−1 and a specific power of ∼507 W kg−1.
Experimental
Synthesis
For the synthesis of β-NiS, 5.94 g (1 M) of nickel(II) chloride hexahydrate (NiCl2·6H2O) was dissolved in 250 mL of deionized water with continuous stirring for 4–5 hours to obtain a homogeneous solution, followed by passing H2S gas (synthesized by the Kipp generator method) into the solution. A black precipitate of the product β-NiS was obtained after a while, which was then filtered and washed several times with deionized water. The product was dried in a hot air oven at 120 °C for 12 h under a N2 atmosphere. The final product was further characterized and tested for its electrochemical performance.| NiCl2·6H2O + H2S → NiS + 2HCl + 6H2O. | (1) |
Characterization
The phase purity and structure of the material were examined through a Rigaku MiniFlex desktop X-ray diffractometer (XRD) with Cu-Kα radiation (λ = 0.154 nm) in the 2θ range of 15°–65° with a step size of 0.02°. The Rietveld refinement of the powder XRD patterns was carried out using FullProf Suite. X’Pert HighScore (PANalytical) software was used to identify the critical phase. SEM (EVO-Scanning Electron Microscope MA15/18, CARL ZEISS Microscopy Ltd) was used to determine the surface morphology and structure of the sample. Microstructural investigations were performed on a high-resolution transmission electron microscope (FEI Tecnai G2 20 TWIN, USA) at a 200 kV acceleration voltage. For TEM imaging, the samples were dispersed in 20 mL of anhydrous ethanol and sonicated for 30 minutes; then, a drop was placed onto a holey-carbon-coated copper grid (Pelco International, USA). HRTEM micrographs were recorded and analyzed with Gatan Microscopy Suite (DigitalMicrograph). The optical properties were studied in the 200–800 nm range using an Agilent Cary 60 UV-visible spectrophotometer. The thermal stability of the as-prepared sample was examined using a TGA thermal analyzer (STA 6000, PerkinElmer Pvt. Ltd); the analysis was carried out at a heating rate of 10 °C min−1 in the temperature range of 30 to 700 °C. The Raman spectra of the samples were determined using a Renishaw inVia Raman microscope under laser irradiation of 633 nm. The infrared spectra of the samples were recorded using a Nicolet iS5 FT-IR spectrometer in the range of 400 to 4000 cm−1. The pore size distribution and specific surface area of the sample were measured by BET (BELCAT-II, MicrotracBEL Corp.). All electrochemical performances of the sample, including cyclic voltammetry (CV), galvanostatic charge–discharge (GCD), and electrochemical impedance spectroscopy (EIS), were conducted using a conventional three-electrode arrangement and measured using a Metrohm Autolab (PGSTAT204) equipped with the FRA32M module; electrochemical measurements were analyzed using NOVA 1.1 software.Preparation of electrodes
The working electrode was prepared by taking the required amounts of the active material, activated carbon, and polyvinylidene difluoride (PVDF) binder in a ratio of 7![[thin space (1/6-em)]](https://www.rsc.org/images/entities/char_2009.gif) :
:![[thin space (1/6-em)]](https://www.rsc.org/images/entities/char_2009.gif) 2
2![[thin space (1/6-em)]](https://www.rsc.org/images/entities/char_2009.gif) :
:![[thin space (1/6-em)]](https://www.rsc.org/images/entities/char_2009.gif) 1 in N-methyl-2-pyrrolidone (NMP) solvent. The homogeneous viscous slurry was prepared in a mortar and pestle to prepare the working electrode, accompanied by casting over a 1 cm2 area of Toray carbon paper. Further, the coated electrode was dried at 80 °C for 12 h. Activated carbon was used to increase the conductivity of the electrodes in electrode preparation. The electrode loading was calculated by taking the weight of the electrode on an electronic balance (error limit: 0.01 mg). For that, first, the weight of Toray paper was taken and then the weight of Toray paper coated with electrode ink (after drying the ink on the Toray paper on a 1 × 1 cm2 area). The total electrode load was found to be ∼1 mg (0.7 mg active material
1 in N-methyl-2-pyrrolidone (NMP) solvent. The homogeneous viscous slurry was prepared in a mortar and pestle to prepare the working electrode, accompanied by casting over a 1 cm2 area of Toray carbon paper. Further, the coated electrode was dried at 80 °C for 12 h. Activated carbon was used to increase the conductivity of the electrodes in electrode preparation. The electrode loading was calculated by taking the weight of the electrode on an electronic balance (error limit: 0.01 mg). For that, first, the weight of Toray paper was taken and then the weight of Toray paper coated with electrode ink (after drying the ink on the Toray paper on a 1 × 1 cm2 area). The total electrode load was found to be ∼1 mg (0.7 mg active material![[thin space (1/6-em)]](https://www.rsc.org/images/entities/char_2009.gif) :
:![[thin space (1/6-em)]](https://www.rsc.org/images/entities/char_2009.gif) 0.2 mg activated carbon
0.2 mg activated carbon![[thin space (1/6-em)]](https://www.rsc.org/images/entities/char_2009.gif) :
:![[thin space (1/6-em)]](https://www.rsc.org/images/entities/char_2009.gif) 0.1 mg PVDF binder). Similarly, activated carbon (AC) electrodes were prepared by taking the required amounts of activated carbon and PVDF binder in a ratio of 9
0.1 mg PVDF binder). Similarly, activated carbon (AC) electrodes were prepared by taking the required amounts of activated carbon and PVDF binder in a ratio of 9![[thin space (1/6-em)]](https://www.rsc.org/images/entities/char_2009.gif) :
:![[thin space (1/6-em)]](https://www.rsc.org/images/entities/char_2009.gif) 1 in N-methyl-2-pyrrolidone (NMP) solvent.
1 in N-methyl-2-pyrrolidone (NMP) solvent.
Results and discussion
Structural properties
The XRD peak pattern of the as-prepared powder sample confirms the purity and formation of the β-phase of NiS nanoparticles. Fig. 1a shows the Rietveld refined XRD profile of β-NiS nanoparticles; refinement was done using the program FullProf Suite. Parameters were refined in the space group R3m and converged to a final RBragg = 4.22%, Rf = 3.25%, Rp = 21.4%, Rwp = 14.8 and a goodness of fit (χ2) of 1.53. The sharp prominent diffraction peaks at 2θ values of 18.46, 30.52, 32.25, 35.9, and 40.66 represent the [110], [101], [300], [021], and [211] planes of β-NiS nanoparticles in the rhombohedral cell (space group: R3m) with lattice parameters a = 9.61(3) Å, b = 9.61(3) Å, c = 3.13(7) Å, α = β = γ = 90° and match very well with the diffraction peaks obtained for β-NiS nanoparticles of ICDD file no. 00-003-0760. Table 1 shows the crystallographic diffraction data of β-NiS nanoparticles, and the crystallite size was calculated using the Debye–Scherrer equation, and the average crystallite size was found to be ∼12.6 (±1) nm. The VESTA image in Fig. 1b shows that β-NiS nanoparticles adopt a rhombohedral millerite phase.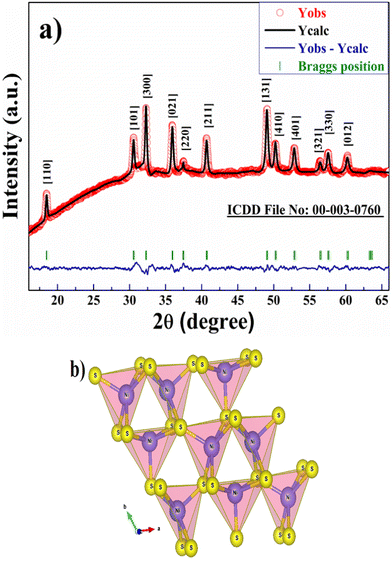 | ||
| Fig. 1 (a) Rietveld refinement of the XRD profile of β-NiS nanoparticles and (b) VESTA image of β-NiS nanoparticles. | ||
| Position (2θ) | d-spacing (Å) | hkl (plane) | Crystallite size (nm) |
|---|---|---|---|
| 18.457 | 4.803092 | 1 1 0 | 33.18836 |
| 30.521 | 2.926489 | 1 0 1 | 18.67821 |
| 32.255 | 2.773067 | 3 0 0 | 17.44846 |
| 35.904 | 2.499140 | 0 2 1 | 15.22944 |
| 37.416 | 2.401546 | 2 2 0 | 14.43066 |
| 40.662 | 2.216989 | 2 1 1 | 12.90767 |
| 49.028 | 1.856471 | 1 3 1 | 9.88285 |
| 50.213 | 1.815398 | 4 1 0 | 9.534162 |
| 52.825 | 1.731624 | 4 0 1 | 9.062734 |
| 56.440 | 1.628991 | 3 2 1 | 7.942084 |
| 57.516 | 1.601031 | 3 3 0 | 7.702197 |
| 60.185 | 1.536270 | 0 1 2 | 7.145272 |
| 63.260 | 1.468781 | 0 5 1 | 6.563816 |
| 63.528 | 1.463245 | 2 0 2 | 6.515981 |
| Average crystallite size (nm) | 12.58799 | ||
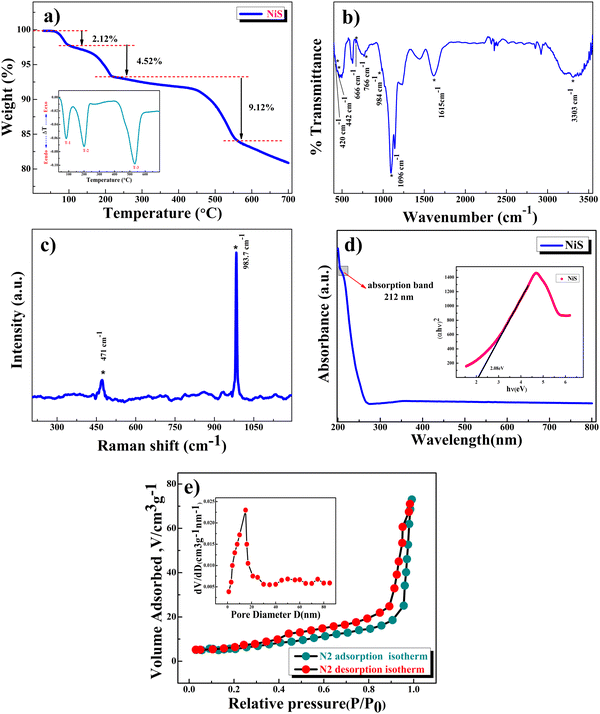
Thermogravimetric analysis (TGA) under a N2 atmosphere (Fig. 2a) was performed to understand the thermal stability of β-NiS nanoparticles. The as-precipitated black powder was utilized for the TGA study. The first two decomposition stages are located between 30 °C and 220 °C (weight loss of about 6.64%, equivalent to ∼0.3H2O molecules), which could be due to the removal of residual moisture and the hydroxide group. The third stage of weight loss, about 9.12% (equivalent to ∼0.4 sulfur loss), occurs in the temperature range of 220–550 °C and is attributed to the structural collapse and gradual decomposition of the sample and release of sulfur.32 The DTA (differential thermogravimetry analysis) curve in the inset clearly shows two endothermic peaks at 83 °C and 200 °C which are attributed to the desorption of the absorbed water and the removal of the structural water molecule, while the endothermic peak at 530 °C may be attributed to structural collapse and the gradual loss of sulfur in which a weight loss of 9.12% was observed. Hence the samples were dried at 120 °C in a N2 atmosphere to remove the water present in the sample to make it moisture free. The weight losses that were observed in the TGA study are represented by eqn (2) and (3):
| NiS·xH2O → NiS + xH2O; x ∼ 0.3 (T ∼ 220 °C) | (2) |
| NiS → NiSy + (1 − y)S; y ∼ 0.6 (T ∼ 550 °C) | (3) |
Raman lines (Fig. 2c) for β-NiS nanoparticles (<10 nm) are asymmetrically widened and shifted toward lower wavenumbers due to the quantum confinement of optical phonons related to the particle size of the materials, i.e., red-shifted, indicating the phonon confinement effect. β-NiS nanoparticles show a stretching vibration band around 471 cm−1 due to the presence of NiS nanocrystals and a high intensity stretching band at 1087 cm−1 confirms the phonon confinement effect31 due to the nanosize of β-NiS particles.35,36Fig. 2d presents the UV-visible spectrum showing an absorption peak around 212 nm, confirming the formation of β-NiS nanoparticles,24 while their uniformity and narrow particle size distribution are confirmed based on the narrow width of this absorption peak which is in good agreement with the results of XRD and Raman spectroscopy.
The band gap of β-NiS nanoparticles was obtained using the Tauc plot (inset of Fig. 2d) and was found to be 2.08 eV. Fig. 2e presents the BET surface area measurements of the β-NiS nanoparticles. The nitrogen adsorption and desorption isotherms exhibit type IV isotherm characteristics, which correlate with a complex mixture of micro- and mesoporous structures for β-NiS nanoparticles. The calculated BET specific surface area is 64 m2 g−1, and both micropores and mesopores with an average diameter of 23 nm. The high surface area and mesoporous structure of β-NiS nanoparticles will offer better contact for the electrolyte and contribute to excellent electrochemical kinetics due to increasing charge carriers.37 The calculated mesopore diameter of β-NiS is much bigger than that of the OH− ions in an aqueous KOH electrolyte.38
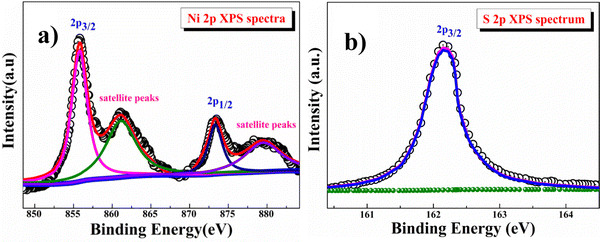
The electronic structure of the β-NiS sample was studied by X-ray photoelectron spectroscopy (XPS). The high-resolution Ni (2p) spectrum shown in Fig. 3a could be assigned to 2p3/2 of Ni2+ (855.82 eV) and 2p1/2 of Ni2+ (873.32 eV) ions, as well as the corresponding satellite peaks at 861.09 and 873.31 eV. The high-resolution S (2p) spectrum shown in Fig. 3b could be assigned to 2p3/2 of S2− at 162.16 eV.39
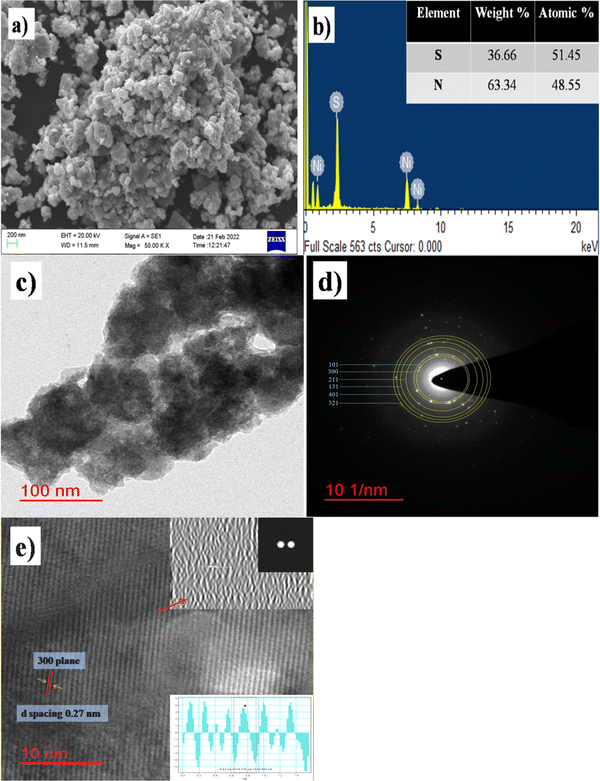
The SEM image in Fig. 4a displays the particle distribution and sponge-like arrangement of the β-NiS nanoparticles. β-NiS nanoparticles are highly agglomerated, and sub-micron size grains are visible in the SEM image. Fig. 4b shows the EDX (energy dispersive X-ray) analysis image confirming the composition of the material. The HRTEM image in Fig. 4c of the as-synthesized β-NiS nanoparticles under optimum conditions shows atomic arrangements in localized regions within the sample. Fig. 4d shows the selected area electron diffraction (SAED) pattern showing clear well-aligned diffraction spots, with lattice spacing of 0.29, 0.27, 0.22, 0.18, 0.17 and 0.16 nm corresponding to [101], [300], [211], [131], [401], and [321] planes, respectively. Fig. 4e shows the lattice fringes of β-NiS nanoparticles confirming the crystalline nature of the nanoparticles. Insets (i, ii, and iii) show the FFT (fast Fourier transform) image, inverse FFT, and d-spacing of β-NiS nanoparticles measured with Gatan Microscopy Suite (Digital Micrograph). The calculated d-spacing value was 0.276 nm, which matches the [300] plane of the β-NiS nanoparticles.
Electrochemical studies
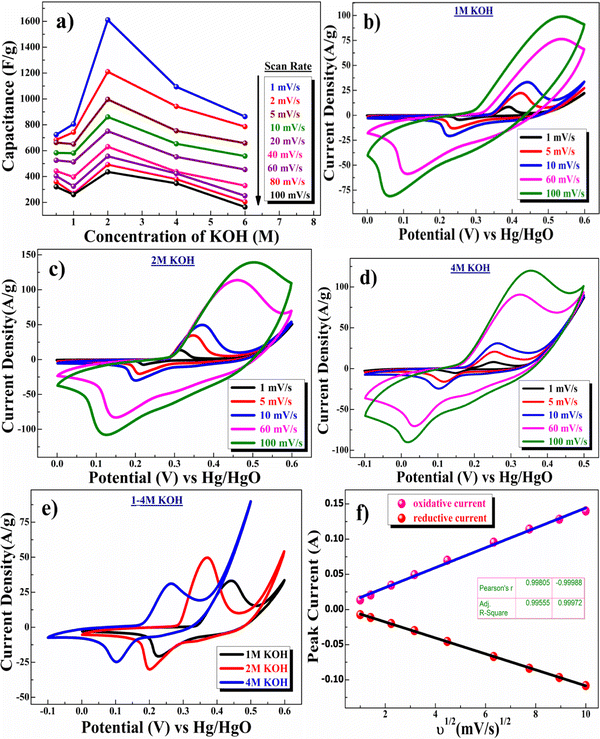
The charge-storage capacity of the β-NiS nanoparticle electrodes was first evaluated by cyclic voltammetry (CV) in a three-electrode system where β-NiS nanoparticles were employed as the working electrode, a platinum electrode as the counter electrode, and saturated Hg/HgO (1 M KOH) as the reference electrode in KOH electrolyte. The CV curves were measured in KOH of different concentrations, namely 0.5, 1, 2, 4, and 6 M. From the KOH concentration vs. mass-specific capacitance plot depicted in Fig. 5a, the mass-specific capacitance was calculated using eqn (4); the mass-specific capacitances are 723 F g−1, 806 F g−1, 1611 F g−1, 1094 F g−1, and 864 F g−1 at 1 mV s−1 in 0.5, 1, 2, 4 and 6 M KOH. The specific capacitance initially rises as the OH− concentration increases and reaches its maximum in a 2 M KOH solution and then falls as the OH− concentration increases further.40 | (4) |
 is the total voltammetric charge obtained by the integration of both positive and negative sweeps in a CV curve. Hence, a factor of 1/2 is used to calculate the charge in either the forward or backward scan, i(E) is the instantaneous current (A), m is the mass (g) of the active material and υ is the scan rate (V s−1).
The CV curve shown in Fig. 5c (2 M KOH) depicts the presence of one pair of well-separated redox peaks at +0.37/+0.20 V. The nature of the curve explains the pseudocapacitive behavior coupled with surface redox (electrosorption).41 Redox peaks originated due to the reversible transformation of Ni2+ to Ni3+ through electrosorption (redox) of OH− ions, as represented in eqn (5).42
| Ni2+S2− + KOH ↔ K+[Ni3+S2−–OH−]e− | (5) |
Fig. 5e shows the comparative CV study in electrolytes of different concentrations ranging from 1 M to 4 M. According to this study, the redox potential is shifted to a lower value with increasing concentration of the electrolyte KOH, which is not desirable for high-voltage supercapacitor applications. Further, the current density values also confirmed an increase in capacitance value from 0.5 M to 2 M KOH concentration and then a decrease in the capacitance value above 2 M KOH concentration.43
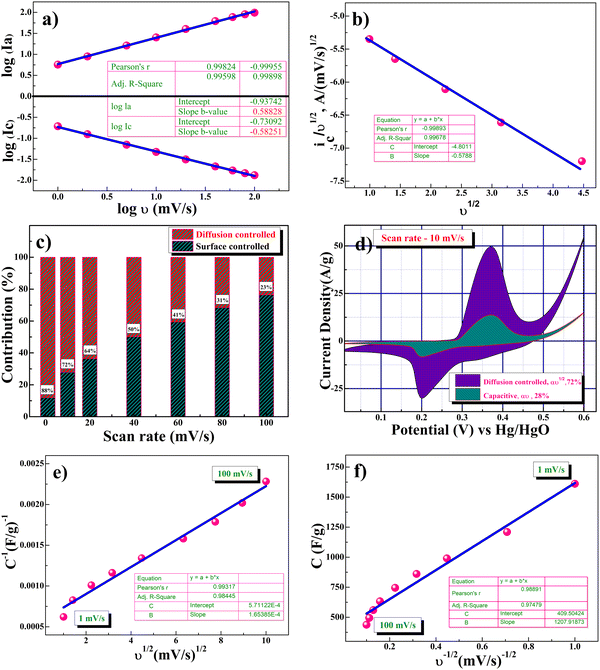
Fig. 5f shows the linear relationship between cathodic and anodic peak currents concerning the square root of scan rate (υ1/2), showing that the CV curve exhibits a semi-infinite diffusion-controlled process. Furthermore, the diffusion kinetics of electrodes can be better understood by determining the diffusion coefficient. The diffusion coefficient for the electrode was determined using the Randles–Sevcik equation as represented in eqn (6):44,45
| ip = 2.686 × 10⁵ × n3/2AD1/2C0υ1/2 | (6) |
The power law provided in eqn (7) was employed to further evaluate the qualitative contribution of the various charge storage kinetics/mechanisms of the β-NiS electrode:46
| i = aυb | (7) |
From Fig. 6a, the slopes of the corresponding log(υ) versus log(i) plots for the b-values of oxidative and reductive currents were found to be 0.58 and 0.58, respectively, indicating the dominance of semi-infinite diffusion-controlled intercalative processes during the electrochemical reaction resulting in battery-type supercapacitor behavior. The high specific capacitance of β-NiS nanoparticles is attributed to both semi-infinite diffusion-controlled and surface-control redox (non-diffusion) mediated pseudocapacitance processes. Trasatti48 and Dunn's49 methods are adopted to evaluate the contributions of diffusion-controlled and non-diffusion-controlled capacitance concerning the experimental data.
Fig. 6b shows the quantitative voltammetry sweep rate dependence which can distinguish the capacitive contribution to the current response. The current response at a fixed potential is the contribution of two separate mechanisms: surface capacitive effects and diffusion-controlled insertion or intercalation.
| i(υ) = k1υ + k2υ1/2 | (8) |
 | (9) |
The representative curve {(V)/υ1/2vs. υ1/2} shown in Fig. 6c represents the contribution of surface capacitance and diffusion-controlled intercalation at different scan rates. Fig. 6d represents a specific contribution at a 10 mV s−1 scan rate, and the contribution of surface capacitance or electrosorption was found to be 28%, and that of diffusion-controlled intercalation was found to be close to 72%. The Trasatti plot was further used to determine the amount of charge stored in the outer and inner surfaces. According to Trassati, the inner and outer surface capacitance of the electrode adds to the total specific capacitance. It can be expressed as
| CTotal = Cin + Cout (F g−1) | (10) |
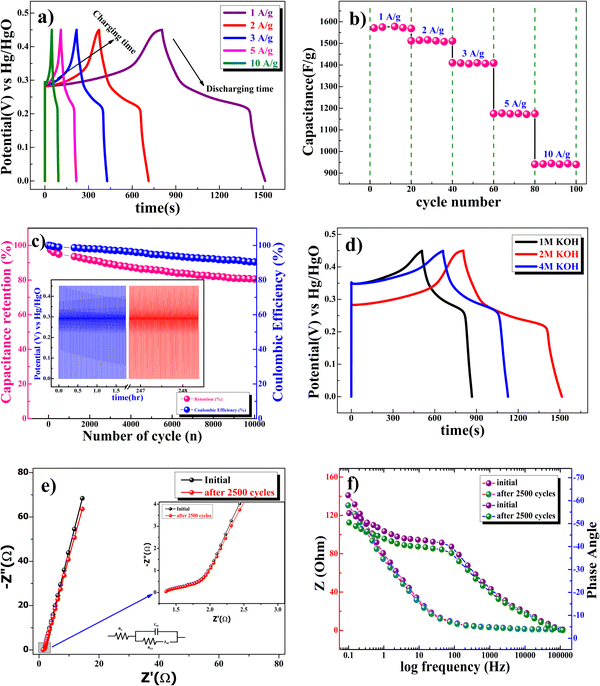
Galvanostatic studies were conducted for a more precise capacity assessment of β-NiS electrodes. The specific capacitance of the electrode can be calculated from the charge–discharge curve using eqn (11):26
 | (11) |
Fig. 7b shows the capacitance value of the cycle number with a different current density of the β-NiS electrode. Fig. 7c shows the excellent long-term cycling stability of the β-NiS electrode at 10 A g−1 for 10![[thin space (1/6-em)]](https://www.rsc.org/images/entities/char_2009.gif) 000 cycles. The 86% capacity retention reflects that the specific capacitance of the electrode did not change that much from the initial capacitance after 10
000 cycles. The 86% capacity retention reflects that the specific capacitance of the electrode did not change that much from the initial capacitance after 10![[thin space (1/6-em)]](https://www.rsc.org/images/entities/char_2009.gif) 000 cycles. The coulombic efficiency
000 cycles. The coulombic efficiency  of the electrode was 90.5% after 10
![[thin space (1/6-em)]](https://www.rsc.org/images/entities/char_2009.gif) 000 cycles of continuous charge/discharge, which reveals the high reversibility of the β-NiS electrode. Fig. 7d shows the comparative study of GCD at 1 M, 2 M, and 4 M KOH concentrations. It is clear from the discharge time that the electrode delivers a longer discharge time in 2 M KOH electrolyte compared to 1 M and 4 M KOH electrolyte concentrations at a 1 A g−1 current rate. The specific capacitances of the electrode calculated from the charge–discharge curve are 801 F g−1, 1578 F g−1, and 1042 F g−1 for 1 M, 2 M, and 4 M KOH electrolyte concentrations, respectively. According to comparative GCD observations, we confirmed an increase in the specific capacitance value from 1 M to 2 M KOH concentration and then a decrease in capacitance at 4 M KOH concentration which is in good agreement with the results of the CV study. In addition to electrochemical stability, we performed AC electrochemical impedance spectroscopy (EIS) in the frequency range of 100 kHz to 0.1 Hz at 10 mV applied potential, as shown in the Nyquist plot in Fig. 7e. The Bode plot shown in Fig. 7f illustrates the phase angle of the β-NiS electrode with respect to the applied frequency. The phase angle of the β-NiS electrode was 57.2° and 53.2° for the first cycle and after 2500 cycles, respectively. The lower phase angle (around 50°) affirms the pseudocapacitive nature of the β-NiS electrode, which is in good agreement with the Nyquist plot.51,52 The specific impedance contribution was attributed to the impedance distributions over charge transfer resistance (Rct), electric series resistance (Rs), and Warburg impedance (Rw). The Rs and Rct values for the β-NiS electrode were 1.34 Ω and 0.33 Ω, respectively (see the enlarged view in the inset of Fig. 7e). Lower frequency data show the Warburg diffusion resistance for the β-NiS electrode. The straight line in the low-frequency region indicates a fast OH− ion diffusion-controlled process. EIS spectra after 2500 repeated charge–discharge cycles compared with the first cycle demonstrate the good electrochemical stability of the β-NiS electrode.
000 cycles of continuous charge/discharge, which reveals the high reversibility of the β-NiS electrode. Fig. 7d shows the comparative study of GCD at 1 M, 2 M, and 4 M KOH concentrations. It is clear from the discharge time that the electrode delivers a longer discharge time in 2 M KOH electrolyte compared to 1 M and 4 M KOH electrolyte concentrations at a 1 A g−1 current rate. The specific capacitances of the electrode calculated from the charge–discharge curve are 801 F g−1, 1578 F g−1, and 1042 F g−1 for 1 M, 2 M, and 4 M KOH electrolyte concentrations, respectively. According to comparative GCD observations, we confirmed an increase in the specific capacitance value from 1 M to 2 M KOH concentration and then a decrease in capacitance at 4 M KOH concentration which is in good agreement with the results of the CV study. In addition to electrochemical stability, we performed AC electrochemical impedance spectroscopy (EIS) in the frequency range of 100 kHz to 0.1 Hz at 10 mV applied potential, as shown in the Nyquist plot in Fig. 7e. The Bode plot shown in Fig. 7f illustrates the phase angle of the β-NiS electrode with respect to the applied frequency. The phase angle of the β-NiS electrode was 57.2° and 53.2° for the first cycle and after 2500 cycles, respectively. The lower phase angle (around 50°) affirms the pseudocapacitive nature of the β-NiS electrode, which is in good agreement with the Nyquist plot.51,52 The specific impedance contribution was attributed to the impedance distributions over charge transfer resistance (Rct), electric series resistance (Rs), and Warburg impedance (Rw). The Rs and Rct values for the β-NiS electrode were 1.34 Ω and 0.33 Ω, respectively (see the enlarged view in the inset of Fig. 7e). Lower frequency data show the Warburg diffusion resistance for the β-NiS electrode. The straight line in the low-frequency region indicates a fast OH− ion diffusion-controlled process. EIS spectra after 2500 repeated charge–discharge cycles compared with the first cycle demonstrate the good electrochemical stability of the β-NiS electrode.
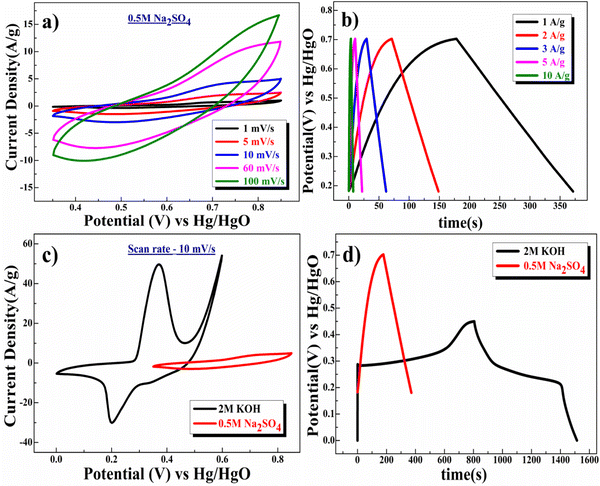
Further, studies were conducted to understand the charge storage behavior of β-NiS electrodes in a neutral electrolyte of 0.5 M Na2SO4. The CV curve at various scan rates, shown in Fig. 8a, indicates well-separated redox peaks (+0.68/+0.48 V at 1 mV s−1 scan rate). The specific capacitance, which is a function of the scan rate, values were estimated in 0.5 M Na2SO4 electrolyte, which were 403 F g−1, 323 F g−1, 238 F g−1, 117 F g−1, and 79 F g−1 at 1 mV s−1, 5 mV s−1, 10 mV s−1, 60 mV s−1, and 100 mV s−1, respectively, for the β-NiS electrode. Fig. 8b displays the findings of the quantitative galvanostatic charge/discharge storage measurement, and the values were found to be 386 F g−1, 308 F g−1, 195 F g−1, 115 F g−1, and 71 F g−1 at 1 A g−1, 2 A g−1, 3 A g−1, 5 A g−1, and 10 A g−1, respectively.
Subsequently, a comparative study was carried out to study the effects of anions present in the electrolyte. Fig. 8c shows the comparative CV curve of the β-NiS electrode in 0.5 M Na2SO4 and 2 M KOH electrolytes. There were changes in the redox peaks from KOH to Na2SO4 electrolyte. Further, in comparison to 0.5 M Na2SO4, the redox peaks were found to be more dominant in 2 M KOH; this may be due to the difference in the hydration radii of hydroxyl ions (3 Å) as compared to sulfate ions (3.79 Å). A larger SO42− hydrate sphere further reduces the number of ions that enter the pores, which results in slower diffusion and reduced production of electric double layers.53 Additionally, the greater molar conductance of the OH− ion (198 cm2 Ω mol−1) in the KOH electrolyte compared to SO42− (79.8 cm2 Ω mol−1) in Na2SO4 exhibits a more robust current response in the CV curve.53
GCD experiments were carried out in 2 M KOH and 0.5 M Na2SO4 electrolytes to determine the quantitative capacitance of the electrode. It is clear from Fig. 8d (see the discharge time) that the electrode delivers a longer discharge time in 2 M KOH electrolyte as compared to 0.5 M Na2SO4 electrolyte at a 1 A g−1 current rate. These studies corroborate the applicability of an aqueous 2 M KOH electrolyte for high electrode performance because the smaller OH− anions match the pore width of the electrode well, resulting in improved performance.
Two electrode test
Two electrode measurements were conducted in 2 M KOH to understand the useful charge storage behavior of the β-NiS electrode using activated carbon (AC) as the counter electrode. To evaluate the maximum specific capacitance during the full cell test, the storage capacity of positive and negative electrodes must be balanced as shown in eqn (12). | (12) |
 | (13) |
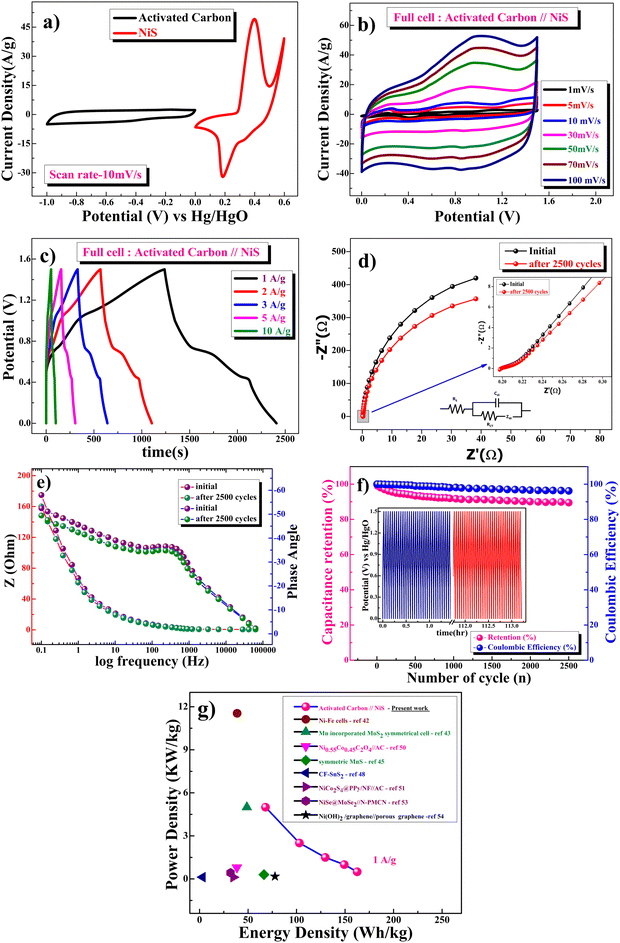
Fig. 9a shows CV curves at a 10 mV s−1 scan rate, where the β-NiS electrode was used as the positive electrode and AC (activated carbon) was used as the negative electrode. The electrochemical properties of the fabricated AC (activated carbon) electrode are shown in the ESI† (Fig. S1 and S2) using cyclic voltammetry and galvanostatic charge discharge. The specific capacitance of the AC electrode was 381 F g−1 from the GCD at 1 A g−1 and 384 F g−1 in CV at 1 mV s−1. As activated carbon is used to increase the conductivity of the active electrode, while calculating the electrochemical charge storage capacity of the NiS electrode, the contribution to capacitance due to activated carbon is extracted and it shows the capacitance value of the NiS electrode only. The calculated mass ratio (m+/m−) was 1![[thin space (1/6-em)]](https://www.rsc.org/images/entities/char_2009.gif) :
:![[thin space (1/6-em)]](https://www.rsc.org/images/entities/char_2009.gif) 1.67 for the asymmetric cell, and the weight of the active material was measured to be 4.45 mg (excluding the weight of acetylene black and PVDF). Fig. 9b shows the CV plot of the β-NiS electrode//AC, a two-electrode ASC [asymmetric supercapacitor cell at scan rates ranging from 1 to 100 mV s−1 in this potential window (0–1.5 V)]. Subsequently, Fig. 9c shows the GCD curve, and the specific capacitance values were calculated using eqn (11). The capacitance values were 780, 716, 622, 494 and 326 F g−1 at current densities of 1, 2, 3, 5, and 10 A g−1, respectively.
1.67 for the asymmetric cell, and the weight of the active material was measured to be 4.45 mg (excluding the weight of acetylene black and PVDF). Fig. 9b shows the CV plot of the β-NiS electrode//AC, a two-electrode ASC [asymmetric supercapacitor cell at scan rates ranging from 1 to 100 mV s−1 in this potential window (0–1.5 V)]. Subsequently, Fig. 9c shows the GCD curve, and the specific capacitance values were calculated using eqn (11). The capacitance values were 780, 716, 622, 494 and 326 F g−1 at current densities of 1, 2, 3, 5, and 10 A g−1, respectively.
Fig. 9d and e show the EIS (Nyquist and Bode) plots in the frequency range of 0.1 Hz to 100 kHz at 10 mV s−1 applied potential, confirming the retention of the electronic structure and resistance of the fuel cell (β-NiS electrode//AC) as the impedance of the material decreases after completion of 2500 cycles compared to the first cycle. From Fig. 9e, it is evident that the phase angle at the tail is 54.6° and 51.6° for the first cycle and after 2500 cycles, respectively, which further confirms the pseudocapacitive nature of the β-NiS//AC cell. The EIS results corroborate the cycling stability by demonstrating a little difference in the internal and charge transfer resistance of the cell before and after the test. The β-NiS electrode//AC (ASC) full cell shows brilliant long-term cycling stability with 90% capacity retention after 2500 cycles, as shown in Fig. 9c. The two-electrode cell has lost only 4% of its initial coulombic efficiency after 2500 cycles.
The specific power and specific energy of asymmetric cell capacitors were calculated using eqn (14) and (15).
 | (14) |
 | (15) |
| Material | Energy density (W h kg−1) | Power density (kW kg−1) | Ref. |
|---|---|---|---|
| Ni–Fe cells | 38.78 | 11.54 | 62 |
| Mn incorporated MoS2 | 48.8 | 5 | 56 |
| (Ni0.33Co0.67)Se2 complex | 29.1 | 0.799 | 57 |
| MnS thin films | 66.41 | 0.3 | 58 |
| CF-SnS2 | 3.1 | 0.123 | 60 |
| NiCo2S4 nanoplate | 35 | 0.12 | 59 |
| NiSe@MoSe2//N-PMCN | 32 | 0.425 | 63 |
| Ni(OH)2/graphene//porous graphene | 77.8 | 0.174 | 64 |
| β-NiS nanoparticles | 68 | 5 | Present work |
| 103 | 2.51 | ||
| 129.6 | 1.5 | ||
| 149.2 | 1 | ||
| 162.5 | 0.5 |
Conclusions
In summary, β-NiS nanoparticles were synthesized using a simple precipitation route where H2S generated through the Kipp generator method was used as the precipitating agent for sulfide formation in an aqueous medium. High diffusion of the gas into the liquid phase resulted in the formation of single-phase β-NiS nanoparticles. The XRD patterns show that the formation of more stable β-NiS nanoparticles is in the rhombohedral millerite phase, and the grain size estimated using the Debye–Scherrer equation was approximately 10 nm. Nanocrystalline β-NiS shows the quantum confinement effect due to the smaller/nanocrystalline size of the particles by Raman spectra and supported by XRD and UV-Visible spectroscopy data. The nanocrystalline β-NiS electrode showed high pseudocapacitive performance with a specific capacitance of 1611 F g−1 at 1 mV s−1 in the potential window of 0–0.6 V in CV and 1578 F g−1 at a current density of 1 A g−1 in the potential window of 0–0.45 V in the GCD measurement. Further, the excellent cycling stability and predominant intercalative mechanism seem to be the reasons behind the high charge storage capacity of the materials as the intercalative (inner) and surface (outer) charges stored by β-NiS electrodes were found to be 72% and 28%, respectively. In 2 M KOH electrolyte, the β-NiS//AC fuel cell resulted in a maximum specific energy of ∼163 W h kg−1 with a specific power equivalent to ∼507 W kg−1 in the voltage window of 1.5 V in 2 M KOH electrolyte at 1 A g−1 current density. The capacitances of different transition-metal-sulfide-based pseudocapacitors are summarized in Table 3, and the results show that the charge storage behavior and the capacitance value of the β-NiS electrode are comparable or superior to most of the transition-metal-sulfide-based pseudocapacitors reported to date. These findings demonstrate the potential of nanocrystalline β-NiS to serve as a pseudocapacitive electrode for large-scale energy storage applications.| Material | Capacitance (F g−1) | Current density or scan rate | Electrolyte | Ref. |
|---|---|---|---|---|
| Pyrite FeS2 nanobelts | 308 | 5 mV s−1 | 1 M Na2SO4 | 17 |
| Mn incorporated MoS2 | 430 | 5 mV s−1 | 0.5 M Na2SO4 | 56 |
| (Ni0.33Co0.67)Se2 complex | 828 | 1 A g−1 | 3 M KOH | 57 |
| MnS thin films | 747 | 1 mA cm−2 | 1 M KOH | 58 |
| NiS nanorods/nanoplates | 788 | 1 mA cm−2 | 1 M KOH | 26 |
| NiCo2S4 nanoplate | 437 | 1 A g−1 | 3 M KOH | 59 |
| Carnation flower-like SnS2 | 524 | 0.08 A g−1 | 1 M KCl | 60 |
| CoS-AC composite | 798 | 10 A g−1 | K3Fe(CN)6 and KOH | 61 |
| β-NiS nanoparticles | 1611 | 1 mV s−1 | 2 M KOH | Present work |
| 1578 | 1 A g−1 |
Conflicts of interest
The authors declare that they have no known competing financial interests or personal relationships that could have appeared to influence the work reported in this paper.Acknowledgements
The authors thank the Department of Chemistry, IIT (BHU), for its facility and support. The authors also gratefully acknowledge the use of characterization facilities and services at the Central Instrument Facility Centre (CIFC), IIT-BHU, Varanasi. Dr Preetam Singh thanks the Science and Engineering Research Board (SERB) India for the financial support (Project no. EMR/2016/006840). Dr Asha Gupta thanks the Science and Engineering Research Board (SERB) India for the financial support (Project no. R&D/SERB/Chy/19-20/03).References
- B. E. Conway, Electrochemical Supercapacitors: Scientific Fundamental and Technological Applications, Kluwer academic/Plenum Press, New York, 1999 Search PubMed.
- M. Winter and R. Brodd, What Are Batteries, Fuel Cells, and Supercapacitors?, Chem. Rev., 2004, 104, 4245–4269 CrossRef CAS PubMed.
- S. Meher and G. Rao, Ultralayered Co3O4 for High-Performance Supercapacitor Applications, J. Phys. Chem. C, 2011, 115, 15646–15654 CrossRef CAS.
- X. Xia, C. Zhu, J. Luo, Z. Zeng, C. Guan, C. F. Ng, H. Zhang and H. Fan, Synthesis of free-standing metal sulfide nanoarrays via anion exchange reaction and their electrochemical energy storage application, Small, 2014, 10, 766–773 CrossRef CAS PubMed.
- Q. Wang, L. Jiao, H. Du, J. Yang, Q. Huan, W. Peng, Y. Si, Y. Wang and H. Yuan, Facile synthesis and superior supercapacitor performances of three-dimensional cobalt sulfide hierarchitectures, CrystEngComm, 2011, 13, 6960–6963 RSC.
- P. Simon and Y. Gogotsi, Materials for electrochemicalcapacitors, Nat. Mater., 2008, 7, 845–854 CrossRef CAS.
- B. E. Conway and W. G. Pell, Double-layer and pseudocapacitance types of electrochemical capacitors and their applications to the development of hybrid devices, J. Solid State Electrochem., 2003, 7, 637–644 CrossRef CAS.
- G. Wang, L. Zhang and J. Zhang, A review of electrode materials for electrochemical supercapacitors, Chem. Soc. Rev., 2012, 41, 797–828 RSC.
- S. Cheng and Y. Zhang, et al., Energizing Fe2O3-based supercapacitors with tunable surface pseudocapacitance via physical spatial-confining strategy, Chem. Eng. J., 2021, 406, 126875 CrossRef CAS.
- C. C. Chen and C.-Y. Chen, et al., Influence of Fe3O4 nanoparticles on pseudocapacitive behavior of the charge storage process, J. Alloys Compd., 2015, 645, 250–258 CrossRef CAS.
- M. Mirzaeian and N. Akhanova, et al., Improvement of the Pseudocapacitive Performance of Cobalt Oxide-Based Electrodes for Electrochemical Capacitors, Energies, 2020, 13, 5228 CrossRef CAS.
- S. J. Patil and N. R. Chodankar, et al., Carbon alternative pseudocapacitive V2O5 nanobricks and δ-MnO2 nanoflakes @ α-MnO2 nanowires hetero-phase for high-energy pseudocapacitor, J. Power Sources, 2020, 453, 227766 CAS.
- H. S. Kim and J. B. Cook, Oxygen vacancies enhance pseudocapacitive charge storage properties of MoO3−x, Nat. Mater., 2017, 16, 454–460 CrossRef CAS PubMed.
- X. Rui, H. Tan and Q. Yan, Nanostructured metal sulfides for energy storage, Nanoscale, 2014, 6, 9889–9924 RSC.
- J. Theerthagiria and R. A. Senthil, et al., Recent progress and emerging challenges of transition metal sulfides based composite electrodes for electrochemical supercapacitive energy storage, Ceram. Int., 2020, 46, 14317–14345 CrossRef.
- O. Ola and K. Thummavichai, Layered tungsten-based composites and their pseudocapacitive and electrocatalytic performance, Mater. Chem. Front., 2022, 6, 737–747 RSC.
- J. Chen, X. Zhou, C. Mei, J. Xu, S. Zhou and C. P. Wong, Pyrite FeS2 nanobelts as high-performance anode material for aqueous pseudocapacitor, Electrochim. Acta, 2016, 222, 172–176 CrossRef CAS.
- S. S. Singha, S. Rudra, S. Mondal, M. Pradhan, A. K. Nayak, B. Satpati, P. Pal, K. Das and A. Sinha, Mn incorporated MoS2 nanoflowers: a high performance electrode material for symmetric supercapacitor, Electrochim. Acta, 2020, 338, 135815 CrossRef CAS.
- Y. Hu and L. Zhang, Boosting High-Rate Sodium Storage of CuS via a Hollow Spherical Nanostructure and Surface Pseudocapacitive Behavior, ACS Appl. Energy Mater., 2021, 4, 8901–8909 CrossRef CAS.
- X. Chen and Q. Liu, Nickel and cobalt sulfide-based nanostructured materials for electrochemical energy storage devices, Chem. Eng. J., 2021, 409, 127237 CrossRef CAS.
- L. Hou, C. Yuan, D. Li, L. Yang, L. Shen, F. Zhang and X. Zhang, Electrochemically induced transformation of NiS nanoparticles into Ni(OH)2 in KOH aqueous solution toward electrochemical capacitors, Electrochim. Acta, 2011, 56, 7454–7459 CrossRef CAS.
- T. Zhu, Z. Wang, S. Ding, J. Chen and X. W. Lou, Hierarchical nickel sulfide hollow spheres for high performance supercapacitors, RSC Adv., 2011, 1, 397–400 RSC.
- J. Yang, X. Duan, W. Guo, D. Li, H. Zhang and W. Zheng, Electrochemical performances investigation of NiS/rGO composite as electrode material for supercapacitors, Nano Energy, 2014, 5, 74–81 CAS.
- Y. Fazli and S. M. Pourmortazavi, et al., Synthesis, characterization and photocatalytic property of nickel sulfide nanoparticles, J. Mater. Sci.: Mater. Electron., 2016, 27, 7192–7199 CrossRef CAS.
- X. Lei, M. Li, M. Lu and X. Guan, Electrochemical Performances Investigation of New Carbon-Coated Nickel Sulfides as Electrode Material for Supercapacitors, Materials, 2019, 12, 3509 CrossRef CAS PubMed.
- P. Gaikar and S. P. Pawar, et al., Synthesis of nickel sulfide as a promising electrode material for pseudocapacitor application, RSC Adv., 2016, 6, 112589–112593 RSC.
- H. Wang, J. Wang and M. Liang, et al., Novel Dealloying-Fabricated NiS/NiO Nanoparticles with Superior Cycling Stability for Supercapacitors, ACS Omega, 2021, 6, 17999–18007 CrossRef CAS PubMed.
- L. Peng and X. Ji, et al., Nickel Sulfide Nanoparticles Synthesized by Microwave-assisted Method as Promising Supercapacitor Electrodes: An Experimental and Computational Study, Electrochim. Acta, 2015, 182, 361–367 CrossRef CAS.
- Y. Li and H. X. Zhang, et al., New design of oriented NiS nanoflower arrays as platinum-free counter electrode for high-efficient dye-sensitized solar cells, Superlattices Microstruct., 2019, 125, 66–71 CrossRef CAS.
- H. Sowa, H. Ahsbahs and W. Schmitz, X-ray diffraction studies of millerite NiS under non-ambient conditions, Phys. Chem. Miner., 2004, 31, 321–327 CrossRef CAS.
- F. Guillaume and L. Zhang, et al., Optical phonons in millerite (NiS) from single-crystal polarized Raman spectroscopy, J. Raman Spectrosc., 2008, 39, 1419–1422 CrossRef CAS.
- H. Guo and Y. Ke, et al., Efficient adsorption and photocatalytic degradation of congo red onto hydrothermally synthesized NiS nanoparticles, J. Nanopart. Res., 2013, 15, 1475 CrossRef PubMed.
- A. B. Vakylabad and M. Schaffie, et al., A procedure for processing of pregnant leach solution (PLS) produced from a chalcopyrite-ore bio-heap: CuO Nano-powder fabrication, Hydrometallurgy, 2016, 163, 24–32 CrossRef CAS.
- M. Kristl, B. Dojer, S. Gyergyek and J. Kristl, Synthesis of nickel and cobalt sulphide nanoparticles using a low cost sonochemical method, Heliyon, 2017, 3, e00273 CrossRef PubMed.
- M. Shajudheen and S. Kumar, et al., Structural and Optical Properties of NiS nanoparticles Synthesized by Chemical Precipitation Method, IJIRSET, 2016, 5(8), 2319–8753 Search PubMed.
- M. Indhumathy and A. Prakasam, Controllable Synthesis of NiS/rGO Hybrid Composite: An Excellent Counter Electrode for Dye Sensitized Solar Cell, J. Cluster Sci., 2020, 31, 91–98 CrossRef CAS.
- F. Behnoudnia and H. Dehghani, Anion effect on the control of morphology for NiC2O4·2H2O nanostructures as precursors for synthesis of Ni(OH)2 and NiO nanostructures and their application for removing heavy metal ions of cadmium(II) and lead(II), Dalton Trans., 2014, 43(9), 3471–3478 RSC.
- L. An, Q. Ren, W. Li, K. Xu, Y. Cao, T. Ji, R. Zou, Z. Chen and J. Hu, Highly ordered mesoporous NiCo2O4 with superior pseudocapacitance performance for supercapacitors, J. Mater. Chem. A, 2015, 3(21), 11503–11510 RSC.
- G. B. Shombe and M. D. Khan, et al., Direct solvent free synthesis of bare α-NiS, β-NiS and α-β-NiS composite as excellent electrocatalysts: effect of selfcapping on supercapacitance and overall water splitting activity, Sci. Rep., 2020, 10, 3260 CrossRef CAS PubMed.
- A. Gupta and V. Kushwaha, et al., SrFeO3−δ: a novel Fe4+–Fe2+ redox mediated pseudocapacitive electrode in aqueous electrolyte, Phys. Chem. Chem. Phys., 2022, 24, 11066–11078 RSC.
- B. Evanko, S. W. Boettcher, S. J. Yoo and G. D. Stucky, Redox-Enhanced Electrochemical Capacitors: Status, Opportunity, and Best Practices for Performance Evaluation, ACS Energy Lett., 2017, 2, 2581–2590 CrossRef CAS.
- S. Nachimuthu and K. Kannan, et al., Electrochemical and magnetic properties of 3D porous NiS/CuS nanocomposites, Appl. Surf. Sci. Adv., 2022, 7, 100209 CrossRef.
- N. K. Mishra and A. K. Singh, NiC2O4·2H2O Nanoflakes: A Novel Redox-mediated Intercalative Pseudocapacitive Electrode for Supercapacitor Applications in Aqueous KOH and Neutral Na2SO4 electrolytes, ChemistrySelect, 2022, 7(21), e202201134 CrossRef CAS.
- B. Ramkumar, S. Yuvaraj, S. Surendran, K. Pandi, H. V. Ramasamy, Y. S. Lee and R. K. Selvan, Synthesis and characterization of carbon coated LiCo1/3Ni1/3Mn1/3O2 and bio-mass derived graphene like porous carbon electrodes for aqueous Li-ion hybrid supercapacitor, J. Phys. Chem. Solids, 2018, 112, 270–279 CrossRef CAS.
- N. Mayedwa, N. Mongwaketsi, S. Khamlich, K. Kaviyarasu, N. Matinise and M. Maaza, Green synthesis of zinc tin oxide (ZnSnO3) nanoparticles using Aspalathus Linearis natural extracts: structural, morphological, optical and electrochemistry study, Appl. Surf. Sci., 2018, 446, 250–257 CAS.
- D. Su, A. McDonagh, S. Z. Qiao and G. Wang, High-Capacity Aqueous Potassium-Ion Batteries for Large-Scale Energy Storage, Adv. Mater., 2017, 29(1), 1–8 CrossRef.
- S. Fleischmann, J. B. Mitchell, R. Wang, C. Zhan, D. Jiang, V. Presser and V. Augustyn, Pseudocapacitance: From Fundamental Understanding to High Power Energy Storage Materials, Chem. Rev., 2020, 120, 6738–6782 CrossRef CAS.
- S. Ardizzone, G. Fregonara and S. Trasatti, ‘Inner’’ And ‘‘Outer’’ Active Surface of RuO2 Electrodes, Electrochim. Acta, 1990, 35, 263–267 CrossRef CAS.
- J. Wang, J. Polleux, J. Lim and B. Dunn, Pseudocapacitive Contributions to Electrochemical Energy Storage in TiO2 (Anatase) Nanoparticles, J. Phys. Chem. C, 2007, 111, 14925–14931 CrossRef CAS.
- S. H. Kim, B. J. Cook, H. Lin and B. Dunn, et al., Oxygen vacancies enhance pseudocapacitive charge storage properties of MoO3−x, Nat. Mater., 2017, 16, 454–460 CrossRef.
- D. Mohanadas and M. A. A. M. Abdah, Facile synthesis of PEDOT-rGO/HKUST-1 for high performancesymmetrical supercapacitor device, Sci. Rep., 2021, 11, 11747 CrossRef CAS PubMed.
- K. Krishnamoorthy, G. K. Veerasubramani, S. Radhakrishnan and S. J. Kim, One pot hydrothermal growth of hierarchical nanostructured Ni3S2 on Ni foam for supercapacitor application, Chem. Eng. J., 2014, 251, 116–122 CrossRef CAS.
- B. Pal, S. Yang, S. Ramesh, V. Thangadurai and R. Jose, Electrolyte selection for supercapacitive devices: a critical review, Nanoscale Adv., 2019, 1(10), 3807–3835 RSC.
- K. Subramani, N. Sudhan, R. Divya and M. Sathish, All-solidstate asymmetric supercapacitors based on cobalt hexacyanoferrate derived CoS and activated carbon, RSC Adv., 2017, 7, 6648–6659 RSC.
- S. Manoharan and P. Pazhamalai, et al., Proton conducting solid electrolyte-piezoelectric PVDF hybrids: novel bifunctional separator for self-charging supercapacitor power cell, Nano Energy, 2021, 83, 105753 CrossRef CAS.
- S. S. Singha, S. Rudra, S. Mondal, M. Pradhan, A. K. Nayak, B. Satpati, P. Pal, K. Das and A. Sinha, Mn incorporated MoS2 nanoflowers: a high performance electrode material for symmetric supercapacitor, Electrochim. Acta, 2020, 338, 135815 CrossRef CAS.
- L. Quan, T. Liu, M. Yi, Q. Chen, D. Cai and H. Zhan, Construction of hierarchical nickel cobalt selenide complex hollow spheres for pseudocapacitors with enhanced performance, Electrochim. Acta, 2018, 281, 109–116 CrossRef CAS.
- R. B. Pujari and A. C. Lokhande, Synthesis of MnS microfibers for high performance flexible supercapacitors, Mater. Des., 2016, 108, 510–517 CrossRef CAS.
- J. Pu and F. Cui, et al., Preparation and Electrochemical Characterization of Hollow Hexagonal NiCo2S4 Nanoplates as Pseudocapacitor Materials, ACS Sustainable Chem. Eng., 2014, 2, 809–815 CrossRef CAS.
- R. K. Mishra and G. W. Baek, One-step solvothermal synthesis of carnation flower-like SnS2 as superior electrodes for supercapacitor applications, Appl. Surf. Sci., 2017, 425, 923–931 CrossRef CAS.
- T. Xu and Z. Wang, et al., One-pot synthesis of a CoS–AC electrode in a redox electrolyte for high-performance supercapacitors, J. Appl. Electrochem., 2019, 49, 1069–1077 CrossRef CAS.
- J. Yao and Y. Liu, et al., Configuring Optimal FeS2@Carbon Nanoreactor Anod: TowardmInsights into Pyrite Phase Change/Failure Mechanism in Rechargeablees Ni–Fe Cells, ACS Appl. Mater. Interfaces, 2019, 11, 42032–42041 CrossRef CAS PubMed.
- H. Peng and J. Zhou, et al., High-Performance Asymmetric Supercapacitor Designed with a Novel NiSe@MoSe2 Nanosheet Array and Nitrogen-Doped Carbon Nanosheet, ACS Sustainable Chem. Eng., 2017, 5, 5951–5963 CrossRef CAS.
- Y. F. Liu, G. H. Yuan, Z. H. Jiang, Z. P. Yao and M. Yue, Preparation of Ni(OH)2-Graphene Sheet-Carbon Nanotube Composite as Electrode Material for Supercapacitors, J. Alloys Compd., 2015, 618, 37–43 CrossRef CAS.
Footnote |
| † Electronic supplementary information (ESI) available. See DOI: https://doi.org/10.1039/d2cp03847a |
| This journal is © the Owner Societies 2023 |

