Hydrogen evolution reaction of Ben + H2O (n = 5–9) based on density functional theory†
Kai
Diao
 a,
Shunping
Shi
*a,
Yong
Song
*a,
Leilei
Tang
a,
Jiabao
Hu
a,
Jing
Jiang
a,
Zhanjiang
Duan
a and
Deliang
Chen
b
a,
Shunping
Shi
*a,
Yong
Song
*a,
Leilei
Tang
a,
Jiabao
Hu
a,
Jing
Jiang
a,
Zhanjiang
Duan
a and
Deliang
Chen
b
aCollege of Mathematics and Physics, Chengdu University of Technology, Chengdu 610059, China. E-mail: shishunping13@cdut.edu.cn; songyong@cdut.edu.cn
bSchool of Physics and Electronic, Guizhou Education University, Guiyang 550018, China
First published on 29th November 2022
Abstract
The structural evolution of Ben clusters with n = 5–9, the adsorption energy created by the Ben@H2O (n = 5–9) complex, and the mechanism of the hydrogen evolution reaction of Ben + H2O (n = 5–9) were all studied using DFT calculations based on the PBE0-D3/Def2TZVP level. Excluding the Be7 cluster, the global minimum structures of beryllium clusters with n = 5–9 showed a higher point group pair formation. Be7 clusters’ high point group symmetry is unstable. Be9@H2O released the greatest energy during the complex's creation (−1.45 eV). Exothermic hydrogen evolution occurs in Ben + H2O (n = 5–9), and all transition states, intermediate stages, and products have energies lower than the equilibrium constant (EC). More energy is released when an O–H bond in the Ben@H2O (n = 5–9) complex is broken, and the energy release results in a change in the cluster structure, which is more pronounced in the Be7 + H2O reaction. Interestingly, there are eight transition states in the Be6 + H2O hydrogen evolution reaction, with the second O–H bond break requiring more energy than the first. There are only three transition states in the Be8 + H2O hydrogen evolution reaction, and the reaction energy is the greatest (−4.13 eV).
1. Introduction
Burning fossil fuels produces carbon dioxide emissions, and they are the primary drivers of global warming (coal, oil, and natural gas). Intensification of the greenhouse effect will cause serious consequences to the earth. Carbon dioxide emissions and the search for clean energy to replace fossil fuels have become extremely urgent.1 One of the most perfect renewable energy sources to replace conventional fossil fuels is hydrogen. Due to its high energy density (i.e., a low heating value of ∼120 MJ kg−1), the combustion product of hydrogen is water, and power plants that can use the existing industrial infrastructure or fossil fuel power generation have attracted unprecedented attention around the world.2–4 Separate water molecules are dissociated into H+ and OH−, and then hydrogen is generated,5 which requires 286 KJ mol−1 of energy to generate hydrogen from liquid water.6Beryllium metal exhibits many excellent properties, such as low density, high stiffness, and a low coefficient of thermal expansion, leading to alloys of beryllium metal that also have many excellent properties and exhibit unique quantum effects as the size of beryllium metal is reduced to the scale of clusters.7–11 Special quantum size effects and high specific surface areas have considerable application potential in the realm of catalysis because of the distinct electronic structure of beryllium clusters. The molecular geometry and characteristics of pure beryllium clusters and doped beryllium clusters have drawn a lot of interest because beryllium clusters have a distinctive electronic structure.12–17 Srinivas et al.12 investigated the geometric structure and electronic properties of small beryllium clusters in the gradient-corrected density functional theory. The advantage of higher multiplicity was found in the low-energy isomers of larger clusters, and the influence of cluster size on the structure and electronic properties was analyzed. Abyaz et al.13,14 used the USPEX method combined with density functional theory (DFT) calculations to obtain the global minimum structure of beryllium (Ben, n = 3–25) clusters. Thermodynamic stability, photoelectric and photocatalytic capabilities, and bonding qualities are taken into account for the most stable clusters. Based on ELF (electronic localization function) analysis, it can be concluded that the Be–Be bond in small clusters is mainly van der Waals type, while the Be–Be bond in large clusters has metal properties. Zhang et al.15 obtained the global minimum structure of carbon-doped Ben(n = 1–12) clusters at the B3PW91/6-311+G (d) level and compared it with that of pure beryllium clusters. The results show that the introduction of carbon doping strengthens the intra-cluster interaction of beryllium clusters. In addition, Be3C and Be8C clusters have special stability and are considered to be magic clusters in the BenC series. Li et al.16 obtained the lowest energy structure of oxygen-doped Ben(n = 1–12) clusters at the B3PW91 level based on density functional theory. The energy and electronic properties of phenoxy clusters were systematically studied using the QCISD(T) method and compared with those of pure Ben+1 clusters. Based on density functional theory, Ge et al.17 determined the minimum energy structure and electronic properties of MgBen (n = 2–12) clusters. It is found that MgBe3 and MgBe9 clusters have a higher binding energy and a larger HOMO–LUMO gap, which make them more stable than adjacent clusters. The stability of Be clusters is decreased by Mg doping, according to an analysis of the electrical characteristics of MgBen (n = 2–12) clusters.
In addition to investigating the lowest energy structure and electronic properties of beryllium clusters and doped beryllium clusters, the adsorption structure of beryllium clusters and doped beryllium clusters for small molecules and their related properties have been explored.18–21 Orlando et al.18 studied the adsorption of hydrogen molecules on (BeO)n (n = 2–7) clusters based on density functional theory. The effect of hydrogen doping on the beryllium cage structure was studied by Naumkin et al.19 Javad et al.20 reported the adsorption energy, structure, energy gap (Eg), charge transfer and electronic properties of several adsorption states of carbon monoxide (CO) on primary, cationic Li−, Li− and two kinds of Li− coated fullerene beryllium oxides (Be16O16, Li+@Be16O16, Li@Be16O16, and 2Li@Be16O16, respectively), and the results have been explained by DFT calculations. As doped, Be atoms effectively improve the NLO reaction, thermodynamics, and hydrogen adsorption properties of Al12N12 nanoclusters, which were found in the study of Mehboob et al.21
Recent studies on two-dimensional structures, clusters and visible-light-driven photocatalytic hydrogen evolution reactions are also effective methods for developing hydrogen energy.22–27 Vos et al.28,29 reported a high level of single-reference and multi-reference ab initio calculations showing that Be4 clusters exhibit very efficient Lewis acids when interacting with conventional Lewis bases such as ammonia, water, or hydrogen fluoride. The corresponding acid–base interactions trigger the sequential dissociation of all Lewis bases. Chakraborty et al.30 investigated the possibility of CO oxidation on the Al12Be cluster, dissociation, and addition of CH3F and C2H5F, decomposition of the NAH bond in NH3, dissociation of NO, and hydrogenation of C2H2.
Based on the above research, we studied the interaction between Ben(n = 5–9) clusters and H2O, including the lowest energy structure of Ben(n = 5–9) clusters, the lowest energy structure of H2O adsorbed by Ben(n = 5–9) clusters, and the hydrogen evolution reaction (HER) of water molecules on the surface of beryllium clusters.
2. Computational methodology
The structure of many isomers of Ben(n = 5–9) clusters was optimized, and the stability of the structure was analyzed by frequency analysis. The adsorption process of H2O is carried out based on the lowest energy structure obtained by the above operation. In the adsorption process, the adsorption sites of H2O were considered based on the symmetry of the lowest energy structure of the cluster. The structures after water molecule adsorption were optimized and frequency analyzed to determine the low-energy cluster adsorption structure. The HER of water molecules on the surface of beryllium clusters is conducted based on the lowest energy structure obtained after adsorption, which serves as the reactant of HER. The TS approach is used to determine the transition state in the hydrogen evolution reaction, and the intrinsic reaction coordinate (IRC) is used to determine the transition state. Considering the unique electronic structure of beryllium clusters, Perdew, Burke, and Ernzerhof (PBE) proposed in 1996 a pure functional,31 and Adamo created a hybrid functional PBE032 density functional theory for simulation calculations. The PBE0 functional uses 25% exchange and 75% correlation weight. Focus is on the weak interaction between water molecules and beryllium clusters, increasing the functional dispersion correction. To make the calculation structure more accurate, the base sets were selected as def2-TZVP.33–35 Finally, all the above operations were performed at the PBE0-D3/def2-TZVP level of Gaussian16.36To determine the mechanism underlying the hydrogen event, we thoroughly investigated the changes in electron distribution of the two interacting systems. For this purpose, we use the interaction region indicator function (IRI)37 in the Multiwfn38 program to provide the information we are looking for. Visualization of the information is completed by the VMD39 and Gnuplot40 programs.
During the formation of the Ben@H2O (n = 5–9) complex, the adsorption energy is a physical quantity that we are very concerned about. The formula for calculating the adsorption energy is as follows:
| Ea = EBen@H2O − (EBen + EH2O) | (1) |
The calculation formula for the energy barrier involved in the reaction process is as follows:
| Eb = ETS − Er | (2) |
| Erb = Ep − ETS | (3) |
| ER = Eproduct − Ereaction | (4) |
| G = ε0 + Hcorr − TStot | (5) |
3. Results and discussion
3.1. Lowest-energy structures of Ben(n = 5–9) clusters
The low-energy isomers of beryllium clusters (n = 5–9) and their symmetry and lowest frequency are shown in Fig. 1. The most stable structure of beryllium clusters and the magnetism of low-energy isomers were further studied. The spin-polarized DFT calculations show that the stable structures of beryllium clusters with n = 6,7 and n = 8,9 are the quintet ground state and triplet ground state, respectively, except that the clusters with n = 5 are favorable for the singlet ground state. These results are summarized in Fig. 1. As shown in Fig. 1, the Be5 cluster has D3h symmetry, and the Be–Be bond lengths are 2.01 Å and 2.06 Å, respectively (for bond length information see Table 1). The Be6 cluster has Oh symmetry, and the Be–Be bond lengths are 2.91 Å and 2.06 Å, respectively. The Be5 cluster has a tripartite structure and Be6 has a diamond structure, which is consistent with the calculation results of Abyaz et al13 and Sulka et al.41 Our calculation results show that Be7 has a pentagonal bipyramid shape with low symmetry, where the Be–Be bond lengths are 2.01 Å to 2.09 Å. It is worth noting that the highest symmetry of the pentagonal bipyramid structure of the Be7 cluster should be D5h, but our calculation results show that the symmetry of D5h is unstable, which is consistent with the results of Abyaz et al13 and Srinivas et al.12 According to our prediction, Be8 has D2d symmetry, and lateral bond lengths in the range of 1.89 Å to 2.72 Å. Be9 is a tricapped trigonal prism with D3h symmetry, in which the average Be–Be bond length in the trigonal prisms is about 2.15 Å.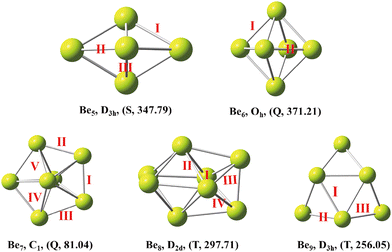 | ||
| Fig. 1 The lowest-energy structures of Ben(n = 5–9) clusters with exact symmetries, states (S = singlet, T = triplet and Q = quartet) and minimum vibrational frequency (cm−1) in parentheses. | ||
| Cluster size n | I | II | III | IV | V |
|---|---|---|---|---|---|
| 5 | 2.01 | 2.06 | |||
| 6 | 2.91 | 2.06 | |||
| 7 | 2.05 | 2.03 | 2.02 | 2.01 | 2.09 |
| 8 | 2.72 | 2.18 | 2.05 | 1.98 | |
| 9 | 2.22 | 2.15 | 2.07 |
3.2. Ben@H2O (n = 5–9) complexes
The Ben@H2O (n = 5–9) complex structures formed by beryllium clusters and water molecules are shown in Fig. 2. On the one hand, the adsorption sites of water molecules, the spin multiplicity of the complex and the electron transfer between beryllium clusters and water molecules are discussed using NBO analysis (see Fig. 3 for specific information). Furthermore, the adsorption energy of the adsorption process is also sorted out (see Table 2 for specific information).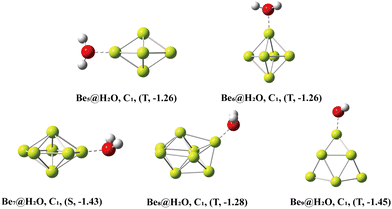 | ||
| Fig. 2 The lowest-energy structures of Ben@H2O (n = 5–9) clusters with exact symmetries, states (S = singlet, T = triplet and Q = quartet) and adsorption energy (eV) in parentheses. | ||
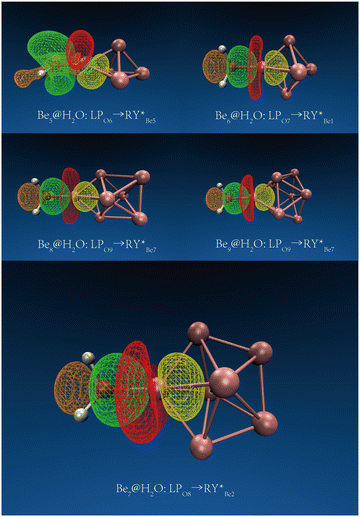 | ||
| Fig. 3 The main NBO donor–acceptor overlaps between H2O and Ben (n = 5–9). The orbit and direction of electron transfer. | ||
| Cluster size n | 5 | 6 | 7 | 8 | 9 |
|---|---|---|---|---|---|
| Adsorption Energy (eV) | −1.26 | −1.26 | −1.43 | −1.28 | −1.45 |
| Reaction Energy (eV) | −2.82 | −2.86 | −3.55 | −4.13 | −3.17 |
In NBO analysis, it was found that electron transfer occurred between two different OH bonds and an O atom to the clusters. The electron transfer between the O atom and Be atom at the adsorption site accounts for the main part of the electron transfer between water molecules and beryllium clusters. The second-order stabilization energy (E(2)) was positively correlated with the adsorption energy in the adsorption process.42 The adsorption energies of Be5@H2O and Be6@H2O complexes are about −1.26 eV. In NBO analysis, the E(2)s of Be5@H2O and Be6@H2O complexes are 2.00 kcal mol−1 and 3.33 kcal mol−1, respectively. The adsorption energies of Be7@H2O and Be9@H2O complexes are about −1.44 ev, and the E(2)s in the NBO analysis are 4.34 kcal mol−1 and 3.99 kcal mol−1, respectively. In NBO analysis, Be8@H2O has adsorption energy (−1.43 eV) and E(2) (3.84 kcal mol−1). Our calculation results are consistent with the rule that the second-order stabilization energy and adsorption energy are positively correlated.
3.3. The reaction path between Ben (n = 5–9) and H2O molecule
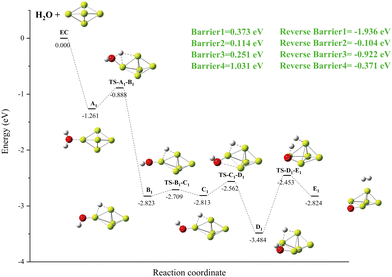
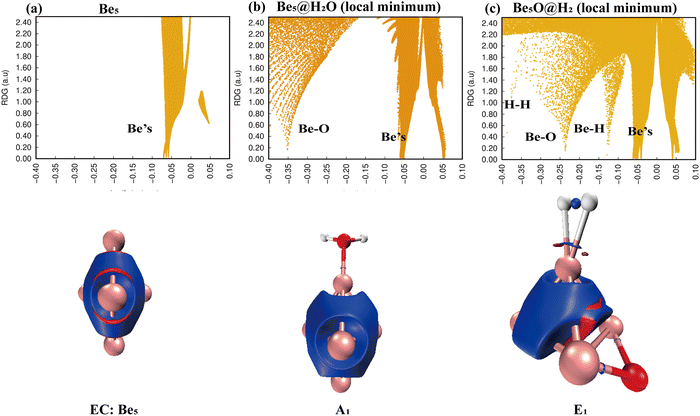
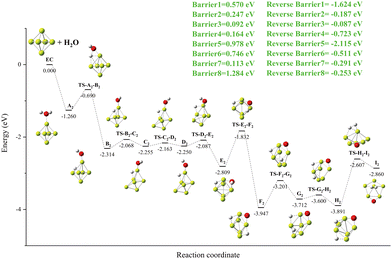
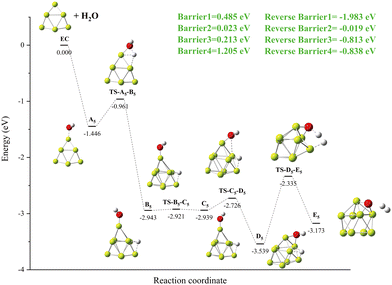
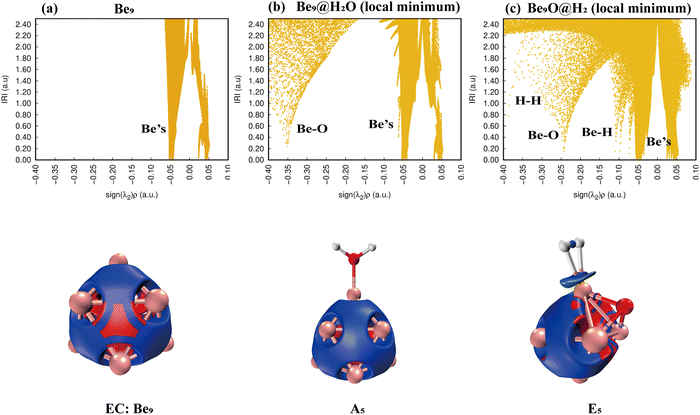
We concentrate on the modifications of chemical bonds in Ben@H2O (n = 5–9) complexes, the cleavage of OH bonds, the production of hydrogen molecules, the energy barriers in the dissociation process, and the reaction energy (see Table 2 for specific information) when predicting the reaction channels of Ben (n = 5–9) clusters and H2O molecules.Simply looking at the results shown in Fig. 5, we can clearly see that the electronic density of H2O has undergone profound changes, because its initial geometric structure with two O–H bonds has been completely destroyed, and eventually formed a stable Be–O–Be three-center bond and H–H bond. The IRI 3D plot in Fig. 5(a) shows that the Be5 double triangular pyramid cluster exhibits a structure, and five Be atoms share valence electron pairs, forming a typical metal bonding arrangement.
The symmetry of distribution is also reflected in the single spike in the corresponding IRI 2D plot. The IRI 3D plot around the Be5 group is not significantly disturbed by the attachment of H2O (Fig. 5(b)). This is well reflected in the IRI 2D plot. Two spikes have been clearly observed, one corresponding to the new Be–O bond and the other to the Be–Be interaction. The IRI 2D plot (Fig. 5(c)) clearly shows that the single spike observed by the Be5 cluster (Fig. 5(a)) has now been split into several spikes: one Be–Be, two Be–H and Be–O spikes, and one H–H spike. It is very important that the intensity of these new Be–H, Be–O, and H–H spikes is much higher than that of the corresponding Be–Be bonds, indicating that the driving force for the systematic and total dissociation of the initial O–H bond of H2O comes from the special intensity of the newly formed Be–O and Be–H bonds relative to the initial Be–Be bonds.
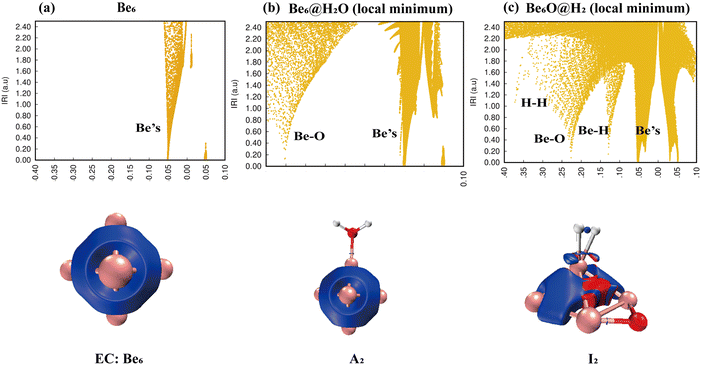
IRI analysis of the Be6 + H2O reaction is shown in Fig. 7. The electronic density of H2O also changed dramatically on the surface of the Be6 cluster. The cleavage of O–H bonds resulted in the formation of a stable Be–O–Be three-center bond and H–H bond. The IRI 3D plot in Fig. 7(a) shows that the Be6 cluster presents a biquadrangular pyramid structure and forms a typical metal bond. It can be clearly seen in the IRI 3D plot (see Fig. 7(b)) that H2O attached to the Be6 cluster has little interference with the surroundings. This shows two spikes (Be–O, Be) in the IRI 2D plot.
The dissociation of H2O on the surface of the Be6 cluster leads to changes in the structure of the Be6 cluster. This is evident in the IRI analysis. The single spike of Be splits into almost double spikes in the IRI 2D plot (Fig. 7(c)), and the geometry changes caused by the dissociation of H2O can be clearly seen in the IRI 3D plot.
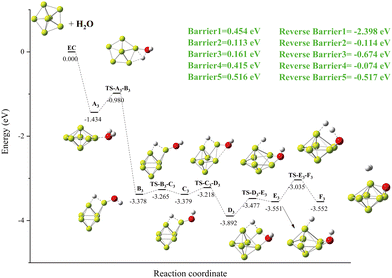
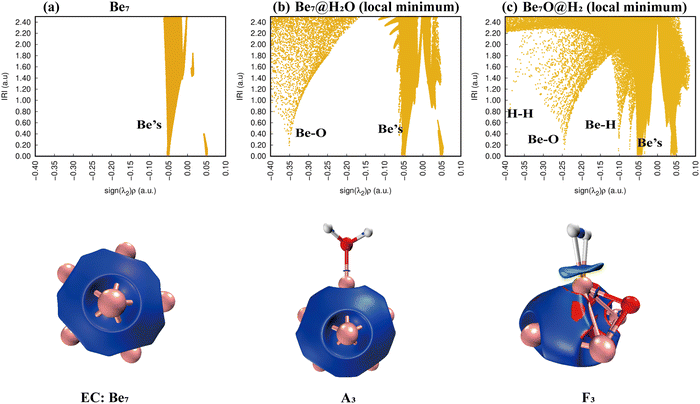
According to Fig. 9(a), only Be–Be bonds exist. Fig. 9(b) shows that the adsorption of a water molecule has little effect on the overall disturbance of Be7 clusters. Fig. 9(c) shows that H–H bonds appear in the IRI plots of product F3, whereas Be–H has two peaks, and the IRI 3D plot shows that the interaction between hydrogen molecules and the Be7O cluster is weaker than chemical bonds. This shows that F3 is easier to dehydrogenate than E1 and I2.
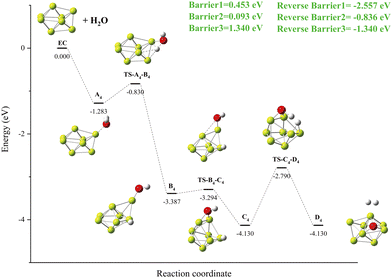
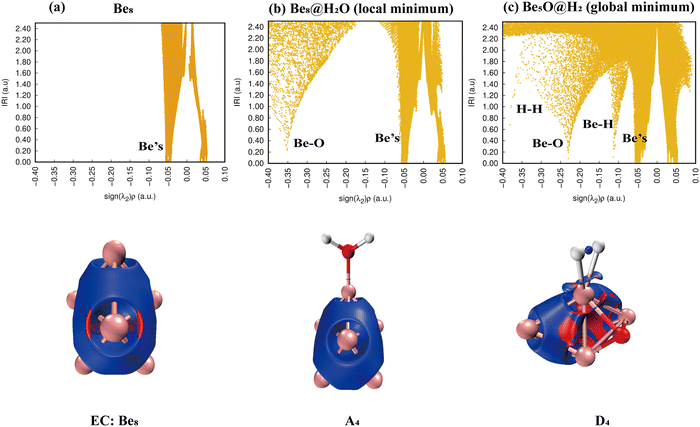
As shown in Fig. 11, the IRI 2D plot shows that Be8 has a continuous peak belonging to the Be bond (Fig. 11(a)), and Be8@H2O has one more spike belonging to the Be–O bond (Fig. 11(b)). There are several obvious spikes for the product D4 (Be8O@H2O), belonging to Be, Be–H, Be–O, and H–H, respectively, and the specific situation is shown in the IRI 3D plot (Fig. 11(c)). It is worth noting that the chemical bonding of the Be–H bond should be of a strong type, and the desorption of hydrogen molecules should be relatively difficult.
A strong steric hindrance effect appears in the center of the Be9 cluster, as shown in Fig. 13(a). When an H2O molecule is adsorbed on the Be9 cluster, the steric hindrance effect in the face center disappears (Fig. 13(b)). The IRI 2D plot in Fig. 13(c) shows that there are multiple peaks, including Bes bonds, Be–O bonds, H–H bonds, and Be–H bonds. Notable among them is the Be–H bond, which has three peaks in the IRI 2D plot and a bronze isosurface in the IRI 3D plot, indicating that the interaction is weaker than the chemical bond.
| Path | Be5 | Be6 | Be7 | Be8 | Be9 |
|---|---|---|---|---|---|
| EC | 0.000 | 0.000 | 0.000 | 0.000 | 0.000 |
| An | −0.868 | −0.877 | −0.747 | −0.825 | −1.048 |
| TS-An-Bn | −0.637 | −0.433 | −0.400 | −0.497 | −0.667 |
| Bn | −2.549 | −2.080 | −2.735 | −3.065 | −2.649 |
| TS-Bn-Cn | −2.482 | −1.828 | −2.655 | −2.908 | −2.621 |
| Cn | −2.540 | −2.000 | −2.738 | −3.701 | −2.648 |
| TS-Cn-Dn | −2.235 | −1.937 | −2.547 | −2.487 | −2.370 |
| Dn | −3.083 | −1.997 | −3.182 | −3.200 | −3.123 |
| TS-Dn-En | −2.191 | −1.794 | −2.829 | −2.053 | |
| En | −2.605 | −2.462 | −2.914 | −2.845 | |
| TS-En-Fn | −1.641 | −2.439 | |||
| Fn | −3.713 | −2.970 | |||
| TS-Fn-Gn | −2.993 | ||||
| Gn | −3.463 | ||||
| TS-Gn-Hn | −3.355 | ||||
| Hn | −3.642 | ||||
| TS-Hn-In | −2.502 | ||||
| In | −2.643 |
4. Conclusions
To investigate the structural evolution of Ben clusters with n = 5–9, the adsorption energy produced by the complex generated by Ben@H2O (n = 5–9), and the mechanism of the hydrogen evolution process of Ben + H2O (n = 5–9), DFT calculations were conducted based on the PBE0-D3/Def2TZVP level. Our calculation results show that Be5 and Be9 clusters have D3h point group symmetry, the Be6 cluster has Oh point group symmetry, the Be8 cluster has D2d point group symmetry, and the Be7 cluster has low C1 point group symmetry. During the formation of the Ben@H2O (n = 5–9) complex, the formation and adsorption energies of Be5@H2O and Be6@H2O were −1.26 eV, −1.28 eV, −1.43 eV and −1.45 eV, respectively. The adsorption reaction between Be clusters and water molecules are a barrierless reaction, which indicates that water molecules are more easily adsorbed on the surface of Be clusters, and the adsorption energy is larger, which can also reflect that the adsorption structure is more stable.The hydrogen evolution reaction in Ben + H2O (n = 5–9) is an exothermic reaction, and the energy of all transition states, intermediate states, and products is below EC.
When an O–H bond in the Ben@H2O (n = 5–9) complex is broken, more energy is released, and the release of energy brings about a change in the cluster structure, which is more obvious in the Be7 + H2O reaction. When the second O–H bond breaks, a high energy barrier needs to be overcome. It is worth noting that the hydrogen evolution reaction of Be6 + H2O has 8 transition states, and the second O–H bond breaks more energy than the first O–H bond breaks. The hydrogen evolution reaction of Be8 + H2O has only 3 transition states, and the reaction heat is the highest (−4.13 eV). It can be seen from the IRI analysis that the hydrogen molecules in the products of Ben + H2O (n = 5–9) are all adsorbed on the surface of the cluster in the form of chemical bonds. The weaker Be–H bond interaction in Be7O@H2 and Be9O@H2 is beneficial for the desorption of hydrogen molecules. The Gibbs free energy of the Ben + H2O (n = 5–9) reaction is consistent with the trend of electron energy change, revealing the spontaneity of the reaction to some extent, and can be compared with potential experiments.
Author contributions
Kai Diao: conceptualization, formal analysis, investigation, writing – original draft. Shun Ping Shi: conceptualization, writing – review & editing, supervision. Yong Song: supervision. Leilei Tang: data curation. Jiabao Hu: data curation. Zhanjiang Duan: writing – review & editing. Jing Jiang: writing – review & editing. De Liang Chen: software, resources.Conflicts of interest
The authors declare that they have no known competing financial interests or relationships that could have appeared to influence the work reported in the paper.Acknowledgements
This project is supported by the Open Research Fund of Computational Physics Key Laboratory of Sichuan Province, Yibin University (Grant No. YBXYJSWL-ZD-2020-005). This work is also supported by the Student's Platform for Innovation and Entrepreneurship Training Program (No. S202110616084 and G202210616030).References
- H. Song, S. Luo, H. Huang, B. Deng and J. Ye, ACS Energy Lett., 2022, 7, 1043–1065 CrossRef CAS.
- Y.-Q. Zou, N. von Wolff, A. Anaby, Y. Xie and D. Milstein, Nat. Catal., 2019, 2, 415–422 CrossRef CAS PubMed.
- S. Chu and A. Majumdar, Nature, 2012, 488, 294–303 CrossRef CAS PubMed.
- X. Liu, P. Wang, X. Liang, Q. Zhang, Z. Wang, Y. Liu, Z. Zheng, Y. Dai and B. Huang, Mater. Today Energy, 2020, 18, 100524 CrossRef CAS.
- P. Liao and E. A. Carter, Chem. Soc. Rev., 2013, 42, 2401–2422 RSC.
- W.-L. Xie, Z.-H. Zhang, C.-L. Yang, M.-S. Wang and X.-G. Ma, Int. J. Hydrogen Energy, 2017, 42, 4032–4039 CrossRef CAS.
- S. Dong, Z. Wang, Y. Wang and J. zhang, J. Alloys Compd., 2017, 727, 1157–1164 CrossRef CAS.
- N. Gong, C. Deng, L. Wu, B. Wan, Z. Wang, Z. Li, H. Gou and F. Gao, J. Alloys Compd., 2019, 781, 371–377 CrossRef CAS.
- C. Li, Z. Fan, H.-L. Jia, C. Wang, P.-K. Ma, M.-W. Ren and H.-Y. Wang, J. Alloys Compd., 2021, 888, 161477 CrossRef CAS.
- M. D. Milosavljević, U. Burkhardt, A. Leithe-Jasper, Y. Grin and H. Borrmann, J. Alloys Compd., 2022, 890, 161420 CrossRef.
- D. Zhu, Q. Zeng, Y. Liu, C. Li, L. Lu, T. Han, G. Xie and X. Shu, J. Alloys Compd., 2022, 919, 165780 CrossRef CAS.
- S. Srinivas and J. Jellinek, J. Chem. Phys., 2004, 121, 7243–7252 CrossRef CAS PubMed.
- B. Abyaz, Z. Mahdavifar, G. Schreckenbach and Y. Gao, Phys. Chem. Chem. Phys., 2021, 23, 19716–19728 RSC.
- R. Kawai and J. H. Weare, Phys. Rev. Lett., 1990, 65, 80–83 CrossRef CAS PubMed.
- D.-D. Zhang, D. Wu, H. Yang, D. Yu, J.-Y. Liu, Z.-R. Li and Y. Li, Eur. J. Inorg. Chem., 2017, 2428–2434 CrossRef CAS.
- J.-Y. Li, D. Wu, Y. Li and Z.-R. Li, Chem. Phys. Lett., 2017, 674, 1–5 CrossRef CAS.
- G.-x Ge, Y.-l Yan, F.-z Ren, X.-l Lei, Z. Yang, W.-j Zhao, Q.-l Wang and Y.-h Luo, Chin. J. Chem. Phys., 2007, 20, 518–524 CrossRef CAS.
- O. Roberto-Neto and E. F. V. de Carvalho, Theor. Chem. Acc., 2020, 139, 93 Search PubMed.
- F. Y. Naumkin and D. J. Wales, Int. J. Quantum Chem., 2012, 112, 3068–3075 CrossRef CAS.
- J. Beheshtian and I. Ravaei, Struct. Chem., 2018, 29, 231–241 CrossRef CAS.
- M. Y. Mehboob, R. Hussain, Z. Irshad, U. Farwa, M. Adnan and S. Muhammad, J. Comput. Biophys. Chem., 2021, 20, 687–705 CrossRef CAS.
- R. Sun, C. L. Yang, M. S. Wang and X. G. Ma, J. Power Sources, 2022, 547 DOI:10.1016/j.jpowsour.2022.232008.
- Q. Fu, F. Xin, X. Yin, Y. Song and Y. Xu, Int. J. Hydrogen Energy, 2021, 46, 22446–22453 CrossRef CAS.
- Q. K. Yin, C. L. Yang, M. S. Wang and X. G. Ma, J. Mater. Chem. C, 2021, 9, 12231–12238 RSC.
- S. Jayachitra, D. Mahendiran, P. Ravi, P. Murugan and M. Sathish, Appl. Catal., B, 2022, 307 DOI:10.1016/j.apcatb.2022.121159.
- L. L. Liu, B. W. Jiang, D. Sun, H. Y. Liu and Y. Xie, J. Mater. Chem. A, 2022, 10, 14060–14069 RSC.
- M. Ge, C.-L. Yang, M.-S. Wang and X.-G. Ma, Int. J. Hydrogen Energy, 2022, 47(100) DOI:10.1016/j.ijhydene.2022.09.249.
- E. Vos, I. Corral, M. M. Montero-Campillo, O. Mó, J. Elguero, I. Alkorta and M. Yáñez, Phys. Chem. Chem. Phys., 2021, 23, 6448–6454 RSC.
- E. Vos, I. Corral, M. M. Montero-Campillo and O. Mó, J. Chem. Phys., 2021, 154, 044302 CrossRef CAS PubMed.
- D. Chakraborty and P. K. Chattaraj, J. Comput. Chem., 2018, 39, 535–545 CrossRef CAS PubMed.
- J. P. Perdew, K. Burke and M. Ernzerhof, Phys. Rev. Lett., 1997, 78, 1396 CrossRef CAS.
- C. Adamo and V. Barone, J. Chem. Phys., 1999, 110, 6158–6170 CrossRef CAS.
- F. Weigend and R. Ahlrichs, Phys. Chem. Chem. Phys., 2005, 7, 3297–3305 RSC.
- F. Weigend, Phys. Chem. Chem. Phys., 2006, 8, 1057–1065 RSC.
- R. Peverati and D. G. Truhlar, Phys. Chem. Chem. Phys., 2012, 14(47), 16187–16191 RSC.
- M. J. Frisch, G. W. Trucks, H. B. Schlegel, G. E. Scuseria, M. A. Robb, J. R. Cheeseman, G. Scalmani, V. Barone, G. A. Petersson, H. Nakatsuji, X. Li, M. Caricato, A. V. Marenich, J. Bloino, B. G. Janesko, R. Gomperts, B. Mennucci, H. P. Hratchian, J. V. Ortiz, A. F. Izmaylov, J. L. Sonnenberg, D. Williams-Young, F. Ding, F. Lipparini, F. Egidi, J. Goings, B. Peng, A. Petrone, T. Henderson, D. Ranasinghe, V. G. Zakrzewski, J. Gao, N. Rega, G. Zheng, W. Liang, M. Hada, M. Ehara, K. Toyota, R. Fukuda, J. Hasegawa, M. Ishida, T. Nakajima, Y. Honda, O. Kitao, H. Nakai, T. Vreven, K. Throssell, J. A. Montgomery, Jr., J. E. Peralta, F. Ogliaro, M. J. Bearpark, J. J. Heyd, E. N. Brothers, K. N. Kudin, V. N. Staroverov, T. A. Keith, R. Kobayashi, J. Normand, K. Raghavachari, A. P. Rendell, J. C. Burant, S. S. Iyengar, J. Tomasi, M. Cossi, J. M. Millam, M. Klene, C. Adamo, R. Cammi, J. W. Ochterski, R. L. Martin, K. Morokuma, O. Farkas, J. B. Foresman and D. J. Fox, Gaussian 16, Revision C.01, Gaussian, Inc., Wallingford CT, 2016 Search PubMed.
- T. Lu and Q. Chen, Chem.: Methods, 2021, 1, 231–239 CAS.
- T. Lu and F. W. Chen, J. Comput. Chem., 2012, 33, 580–592 CrossRef CAS PubMed.
- W. Humphrey, A. Dalke and K. Schulten, J. Mol. Graphics Modell., 1996, 14, 33–38 CrossRef CAS PubMed.
- C. K. Thomas Williams Gnuplot. An Interactive Plotting Program.
- M. Šulka, D. Labanc, M. Kováč, M. Pitoňák, I. Černušák and P. Neogrády, J. Phys. B: At., Mol. Opt. Phys., 2012, 45, 085102 CrossRef.
- B. Samanta, T. Sengupta and S. Pal, J. Phys. Chem. C, 2018, 122, 28310–28323 CrossRef CAS.
Footnote |
| † Electronic supplementary information (ESI) available. See DOI: https://doi.org/10.1039/d2cp04647d |
| This journal is © the Owner Societies 2023 |

