A study of how solid–liquid interactions affect flow resistance and heat transfer at different temperatures based on molecular dynamics simulations†
Lin
Shi
 ,
Chengzhi
Hu
 *,
Changli
Yi
,
Minli
Bai
,
Jizu
Lyu
and
Linsong
Gao

Key Laboratory of Ocean Energy Utilization and Energy Conservation of Ministry of Education, School of Energy and Power Engineering, Dalian University of Technology, Dalian 116024, China. E-mail: shixdcs@163.com; Fax: +86-0411-84706305; Tel: +86-0411-84706305
First published on 13th December 2022
Abstract
Non-equilibrium molecular dynamics simulations of liquid flow through the surface were performed to investigate the flow resistance and thermal resistance under conditions of different solid–liquid interactions and surface temperatures. A novel phenomenon was observed in the simulation, namely the rise of surface temperature increases the flow resistance when solid–liquid interaction is weak, but decreases the flow resistance when solid–liquid interaction is strong. A higher density of the boundary layer brings a larger friction force to increase the flow resistance. For heat transfer, it is innovative to calculate the heat conduction and convection of the boundary region discretely. The results showed that the heat transfer performance of the interface is not positively correlated with the boundary liquid density, and the structure of the boundary liquid is also crucial. We believe that this research can improve the existing theory of flow heat transfer and provide a more effective method for analyzing the flow heat transfer of the solid–liquid interface.
1. Introduction
Velocity slip and thermal resistance exist at the solid–liquid interface when there are momentum and heat transfer. Velocity slip is often used to indicate the degree of flow resistance; according to the linear Navier boundary conditions, the slip length ls can be obtained by extending the velocity curve to the position of surface velocity as shown in Fig. 1, which is predicted as1 | (1) |
For the heat transfer in the solid–liquid interface, due to the mismatch of the electronic characteristics and vibration characteristics of the solid and liquid, scattering occurs when a carrier (phonon or electron, depending on the properties of the material) attempts to pass through the contact interface; hence there will be a thermal resistance in the interface.2–4 Similar to velocity slip length, thermal resistance can be represented by Kapitza length lK, which is shown in Fig. 1(b) and predicted as5
 | (2) |
In recent years, the problems of flow resistance and heat transfer have become increasingly prominent in various industrial fields. Surface wettability not only has a significant effect on flow resistance,6–12 but can also affect heat transfer.13,14 In general, the hydrophobic surface favors drag reduction15 but worsens heat transfer,16 while the hydrophilic surface improves heat transfer16,17 but deteriorates drag reduction. This phenomenon is attributed to the different surface energies under various wettability conditions, which result in different structures or phases of fluid in the boundary region. However, conventional macro-research methods are inapplicable to studying the microcosmic structure of fluid in the interface. Therefore, it is vital and urgent to study the flow resistance and heat transfer in the microscale.
As an alternative to experiments, molecular dynamics simulation (MDS) has been widely accepted as a powerful tool for interfacial studies due to its low cost and high resolution. In 1989, it was proved by Koplik18 that MDS can reproduce the interfacial properties of solid–liquid at a low Reynolds number. In recent years, many researchers have proved that wettability, which can be represented by solid–liquid interaction in MDS, is one of the important factors affecting flow resistance by MDS. Cao19 pointed out that a liquid can easily slip over poorly wetted surfaces. Sofos20 calculated the effective slip length using MDS and found that as the hydrophilicity increases, the effective slip length decreases. Zhang21 found that the extent of velocity slip is related to the solid–liquid interaction, and it is believed that there are different fluid structures in the solid–liquid boundary region, which bring about a change in energy dissipation and affect velocity slip. Nagayama22 and Zhang23 pointed out that when the solid–liquid interaction is weak, there is a low-density layer in the boundary region that can lead to slip. It is easy to find that a large slip length can be induced by a weak solid–liquid interaction, and most researchers attribute it to the low-density layer adjacent to the surface.
The above studies provide effective evidence for the effects of wettability on flow resistance by MDS. In addition to flow resistance, heat transfer at the solid–liquid interface has also attracted much attention. The interest in thermal transport through the solid–liquid interface began with the early findings of Kapitza24 who found a temperature discontinuity between the solid surface and liquid helium, but to date, there has been no theory that fully explains the mechanism of the thermal resistance at the interface. Thermal resistance is affected by several factors, including wettability,25 the internal structure of the solid surface,26 surface structures27,28 and others. Regarding the wettability (solid–liquid interaction), Kim5,29 investigated heat conduction between parallel plates separated by a thin layer of liquid argon using MDS, and the results showed that the thermal resistance decreases with increasing wettability. Jabbari30 investigated the heat transfer between liquid and carbon-based particles, and the results showed that the thermal resistance decreases with increasing solid–liquid interaction. Cao31 also pointed out that the hydrophilic surface enhances heat transfer in the solid–liquid interface by MDS. Generally, the influence of wettability on heat transfer is attributed to the change in liquid density at the interface.32 Furthermore, the study of heat transfer in non-equilibrium MDS usually needs to generate heat flux or temperature gradient in the system; hence the effects of temperature on heat transfer must also be explored. Barisik26 found that the effect of temperature on thermal resistance is related to the solid–liquid interaction; when the solid–liquid interaction is strong, the interface thermal resistance increases as the temperature rises, but under weak solid–liquid interaction conditions, the thermal resistance decreases as the temperature of the surface increases. In summary, the change in fluid density/structure near the surface affects the heat transfer properties of the interface.
A lot of flow and heat transfer phenomena often occur simultaneously, and heat transfer can be affected by flow, so it is necessary to combine the two phenomena for study. Khare33 investigated the relationship between velocity slip and temperature jump in laminar shear flows, and found that temperature jump could exist without velocity slip, and velocity slip enhances temperature jump. Sun34,35 found that the slip length and the Kapitza length can be correlated by a piecewise function that is separated at a critical solid–liquid interaction, the Kapitza length grows as a power function of the slip length when the interaction is weak, while it remains almost constant when the interaction is strong. Although the above research has summarized the relationship between velocity slip and temperature resistance, the physical mechanisms are still unclear.
In summary, the existing studies have tended to focus on the effects of wettability on velocity slip or thermal resistance independently. Although a few studies have combined flow and heat transfer, the physical mechanisms have not been fully explored. In particular, the influences of surface temperature on flow and heat transfer also need to be explored. Moreover, most existing studies pay more attention to the mathematical dependence between surface properties and flow characteristics, the discussion of mechanism only stays in the stage of speculation or qualitative, and the way the surface properties affect the flow characteristics is still unclear. Therefore, the purpose of this paper is to investigate how the solid–liquid interaction and the surface temperature affect the flow resistance and interfacial thermal resistance. By calculating the potential energy of the fluid in the boundary region, the physical mechanism of the influence of the fluid density on the flow resistance is explored. More importantly, by discretely studying the heat conduction and convection, the influence of the fluid structure in the boundary region on the thermal resistance is investigated in detail. We believe that this work can provide new ideas and methods for the study of flow heat transfer in micro/nano scales.
2. Simulation details
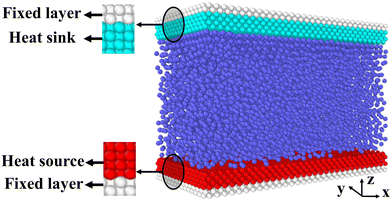
Fig. 2 is the schematic of the simulation model; the size of the simulation model is Lx × Ly × Lz = 112 Å × 55 Å × 82 Å, and a liquid with 7753 argon (Ar) atoms flows between two solid surfaces which are parallel. Both upper and lower copper (Cu) surfaces consist of 2 layers, the outside layers with 1953 atoms are fixed layers to avoid migration of atoms, and the inside layers with 3906 atoms are the heat source layer and the heat sink layer. In all cases, periodic boundary conditions were applied in x and y directions, and non-periodic boundary conditions were applied in the z direction.In the simulations, the 6-12 Lennard-Jones potential with cutoff distance 3.5 σll was applied between the fluid atoms:
 | (3) |
 | (4) |
 | (5) |
In this paper, density ρ and temperature T were represented by reduced units as shown below:
| ρ* = ρσ3 | (6) |
| T* = kT/ε | (7) |
 and
and  represented the reduced temperature of the lower surface (heat source) and upper surface (heat sink).
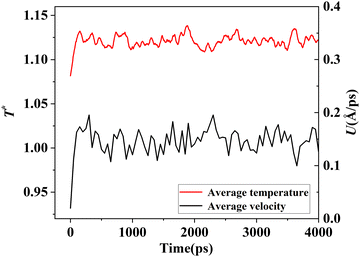
The simulation system was relaxed for 300 ps, and the temperature of system was held at T* = 0.73 by using a Nose–Hoover thermostat. Then the temperature of the lower surface was turned up to  , and the NVE assemble was applied in the fluid. The upper surface started moving with U = 0.25 Å ps−1. The shearing and temperature gradients were imposed simultaneously. After a few picoseconds the system was stable as shown in Fig. 3, and the data statistic was obtained in the last 2000 ps. In addition, the energy dissipation induced by the friction is ignored, which is discussed in S1 (ESI†). All simulations were carried out using a Large-scale Atomic/Molecular Massively Parallel Simulator (LAMMPS).
3. Results
3.1 Effects of solid–liquid interaction and surface temperature on the density and phase of fluid
For all cases, the reduced density of bulk liquid is around 0.8, which is smaller than the saturated density at the corresponding temperature, and the phase of bulk liquid is liquid based on Fig. 4(d), indicating that the properties of the liquid are stable and the model is reliable.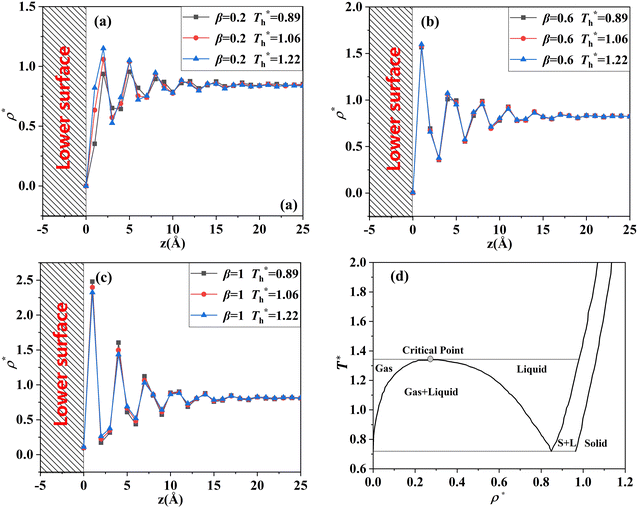 | ||
| Fig. 4 Density profile adjacent surface with different β and Th and coexistence curve for the LJ fluid.36 (a) β = 0.2; (b) β = 0.6; (c) β = 1; (d) coexistence curve. | ||
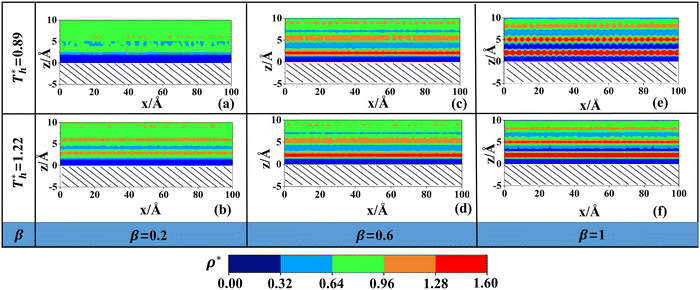
The amplitude and range of the density oscillations increase significantly as the β increases in Fig. 4(a)–(c), which is consistent with the previous research.22,23,44 The density profile is also dependent on surface temperature. It can be seen that the density near the surface increases as the temperature rises when β = 0.2. However, when β = 0.6, surface temperature has little influence on the density profile. When β = 1, the density near the surface decreases as the temperature rises.
Fig. 4(d) is the coexistence curve for the LJ fluid, it is easy to judge the phase of fluid by calculating the dimensionless temperature (T*) and density (ρ*) of Ar, and this method is widely used in enclosed systems.45,46 Based on Fig. 4(d),  (the density of fluid near the surface),
  (the temperature of fluid near the surface) and the phase states of fluid near the lower surface are summarized in Table S1 (ESI†). When β = 0.2, the phase of fluid near the lower surface is a mixture of gas and liquid or pure liquid, the density of which is lower than the bulk liquid. When β > 0.6, the phase of fluid adjacent to the surface is solid.
Fig. 5 shows in a more intuitive way the change in the liquid density near the surface at different solid–liquid interactions and temperatures. In Fig. 5(a), there are only 2 layers with higher density. The light blue part in the figure is the low-density region where the distribution of liquid atoms is sparse and random. In Fig. 5(c), the number of fluid layers with higher density increases obviously, and the distribution is more regular. In Fig. 5(e), the solid–liquid interaction is stronger, and an ordered liquid structure (solid-like layer) appears adjacent to the lower surface. The result is similar to previous studies.43 In essence, the distribution of fluid near the surface is the result of the competition between liquid–liquid and solid–liquid interactions. When β is small, the attraction between solid–liquid is relatively small, and the fluid atoms form a low-density layer near the surface under the attraction of the bulk liquid. When β is large, the attraction between solid and liquid atoms increases, the distribution of fluid adjacent to the surface will affected by the force field of solid surface, and the lattice arrangement of Cu leads to a regular force field, inducing the regular arrangement of fluid atoms near the surface.
On the other hand, surface temperature  also affects the distribution of the fluid near the surface. However, the effects of
  on the distribution of fluid near the surface are not the same when β changes. Fig. 6 shows how the fluid structure near the lower surface changes with increasing temperature under conditions with different solid–liquid interactions. The gap between the fluid and the solid surface becomes smaller as
  rises; when β = 0.2, the Brownian motion of the atoms increases in the bulk liquid with rising temperature, and more fluid atoms enter the gap in the boundary region and lead to the increase of density. When β = 0.6, the change in
  has little influence on the density, which is conjected to be due to the pressure of the bulk liquid and boundary region being always in equilibrium as
  rises. Comparing Fig. 5(e) with Fig. 5(f), it can be found that the ordered structure is destroyed as
  rises; when β = 1, the liquid with higher density acquires enough kinetics to get rid of the bonds of the solid atoms, resulting in a decrease in the density.
Furthermore, to quantitatively describe the influence of solid–liquid interaction and surface temperature on fluid structure, the radial distribution function (RDF) g(r) was calculated by eqn (8) to discuss the structure of fluid adjacent to the surface:
 | (8) |
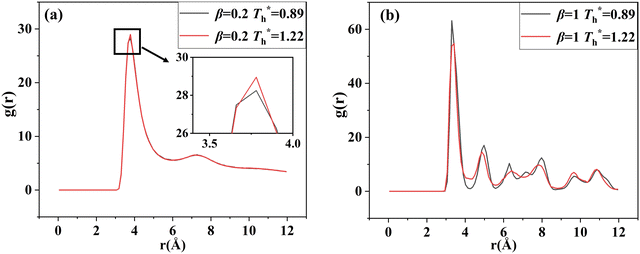
The curve in Fig. 7(a) agrees with the characteristics of the short-range order of amorphous structure. However, the curves in Fig. 7(b) and agree with the long-range order of crystal structure, indicating that there is a crystallized structure adjacent to the surface when β = 1. For the effects of surface temperature, there is a slight increase in the first peak of g(r) as  rises when β = 0.2 in Fig. 7(a), indicating that the distribution of atoms is more compact. When β = 1, the fluctuation degree of the curve decreases significantly as
  rises, and the solid-like structure is destroyed to a certain extent.
3.2 Effects of solid–liquid interaction and surface temperature on flow resistance
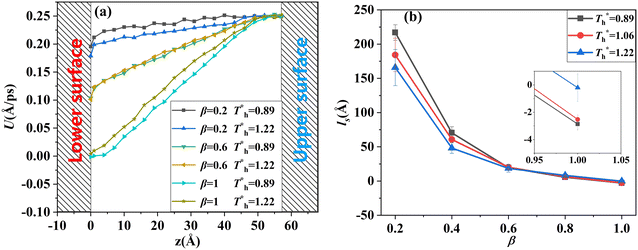
Fig. 8 shows the effects of β and  on velocity profiles and velocity slip length. The velocity near the lower surface decreases dramatically when β increases, and the change in the fluid structure near the surface is the main reason for this phenomenon. Based on the velocity profile, velocity slip length ls can be obtained easily by eqn (1), which is shown in Fig. 8(b). The results show that ls exceeds 200 Å when β = 0.2, and the negative slip occurs when β = 1, which is a typical feature of super-hydrophilic surface. This part of the results is consistent with the conclusion of other studies.20,43 In addition to the effects of solid–liquid interaction, the more interesting part in Fig. 8 is the effect of the surface temperature on the velocity and slip length. When β = 0.2, it can be found that ls decreases as
  rises, but ls increases When β = 1. For a detailed discussion of velocity and velocity slip length please refer to S3 (ESI†).
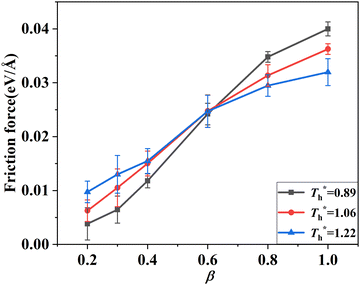
 when β < 0.6, but decreases when β > 0.6, suggesting that the surface temperature also affects the friction force. Obviously, the friction force is affected by the fluid structure near the surface described in Section 3.1. When the fluid structure near the surface becomes more regular under the influence of a solid–liquid force or surface temperature, the resistance will increase. For example, when the solid–liquid force is weak, the low-density layer blocks the fluid and solid surface, thus playing a lubricating role. When the solid–liquid force is strong, the atoms in the solid-like layer are difficult to move, resulting in greater friction.
3.3 Effects of solid–liquid interaction and surface temperature on heat transfer
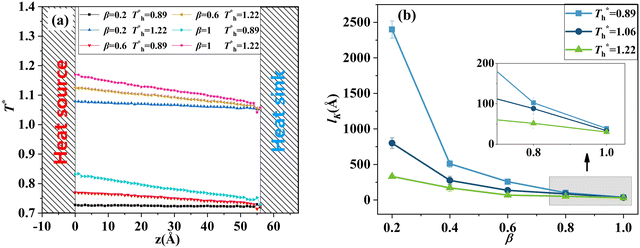
 . Obviously, the surfaces with stronger solid–liquid interaction have better heat transfer ability. The Kapitza length lK represents the thermal resistance of solid–liquid interface under different conditions is obtained by eqn (2) and is summarized in Fig. 10(b). Solid–liquid interaction has significant effects on lK; it is clear that lK decreases as β increases, and the larger fluid density in the boundary region improves the heat transfer of the interface. Meanwhile, it is not similar to velocity slip length, where no matter how the interaction changes, the rise of the surface temperature always leads to the reduction of lK, i.e., the heat transfer of fluid near the surface is not completely positively correlated with its density (please refer to Section 3.1). In traditional cognition, the main heat transfer mode in the boundary region is heat conduction, which is mainly related to the density; hence this phenomenon needs to be explored. For more discussion on the temperature profile please refer to S4 (ESI†).
 | (9) |
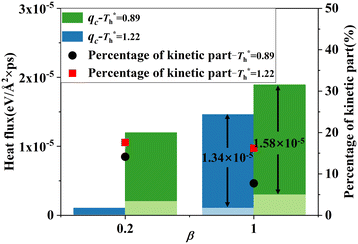
Fig. 11 shows q, qk and qc when β = 1 are significantly higher than that when β = 0.2. The percentage of kinetic part decreases with the increase of β, and heat conduction plays a more important role in the whole heat transfer process, suggesting that the low-density layer has relatively weak heat transfer capability, which blocks heat transfer from heat source to fluid, and the crystallized fluid near the surface has the characteristics similar to lattice vibration, thus improving its internal thermal conductivity near the surface.
The heat flux at different surface temperatures is also compared in Fig. 11. Although it is clear that q increases as  rises under both weak and strong solid–liquid interaction conditions, the mechanisms of the two conditions are different. When β = 0.2, due to fluid near the surface is gas–liquid mixed phase at
  , a small increase in density can significantly improve both qk and qc. When β = 1, it is noted that there is a slight increase in qc despite the density of the fluid in the boundary region decreasing as
  rises, which is conjected to be due to the melted solid-like structure improving the contact between the fluid and solid as shown in Fig. 6(b). Furthermore, qk increases remarkably as
  rises when β = 1; the fluidity of the liquid atom is significantly enhanced due to high temperature, which enhances heat convection. Therefore, the main reason for the improved heat transfer by increasing the surface temperature under strong solid–liquid interaction is the enhancement of heat convection, which is caused by the change in the fluid structure in the boundary region.
4. Conclusions
Liquid flows over surfaces with different solid–liquid interactions and surface temperature were investigated by non-equilibrium molecular dynamics simulations. The flow resistance and heat transfer are directly related to the density and structure of the fluid in the boundary region. The main conclusions are summarized as follows:(1) For flow resistance, the low-density layer reduces the flow resistance when the solid–liquid interaction is weak. With the increase of solid–liquid interaction, the fluid density in the boundary region increases, and the arrangement of fluid atoms is more regular, resulting in a greater flow resistance. The influence of surface temperature on flow resistance should be divided into two conditions. When the solid–liquid interaction is weak, the rise in surface temperature leads to the increase of fluid density in the boundary region then the resistance increases; when the solid–liquid interaction is strong, the higher surface temperature destroys the solid-like structure in the boundary region and reduces the resistance.
(2) For heat transfer, the thermal resistance decreases as the solid–liquid interaction increases. The larger fluid density in the boundary region mainly enhances heat conduction as the solid–liquid interaction increases. More importantly, under both the strong and weak interaction conditions, the increase of surface temperature reduces the thermal resistance, which is inconsistent with the change in density. When the solid–liquid interaction is weak, the increase in the surface temperature leads to the increase of fluid density in the boundary region and both heat conduction and heat convection are enhanced; when the solid–liquid interaction is strong, despite the density of the fluid in the boundary region decreasing, the destroyed solid-like structure will enhance both heat conduction and heat convection.
Conflicts of interest
There are no conflicts to declare.Acknowledgements
This work is supported by the National Natural Science Foundation of China (Grant no. 52106226, 51876027, 51806028, and 52176058) and the Fundamental Research Funds for the Central Universities (DUT20RC(3)095 and DUT20JC21).References
- G. H. Mohamed, The fluid mechanics of microdevices, J. Fluids Eng., 1999, 121(5), 5–33 Search PubMed.
- B. Jean-Louis and C. Francois, Kapitza resistance at the liquid–solid interface, Mol. Phys., 2003, 101(11), 1605–1610 CrossRef.
- L. J. Challis, Kapitza resistance and acoustic transmission across boundaries at high frequencies, J. Phys. C-Solid State Phys., 1974, 7, 481 CrossRef CAS.
- C. Oligschleger and J. C. Schön, Simulation of thermal conductivity and heat transport in solids, Phys. Rev. B: Condens. Matter Mater. Phys., 1999, 6(59), 4125 CrossRef.
- B. H. Kim, A. Beskok and T. Cagin, Molecular dynamics simulations of thermal resistance at the solid–liquid interface, J. Chem. Phys., 2008, 129(17), 551 CrossRef PubMed.
- H. Dong, M. Cheng and Y. Zhang, et al., Extraordinary drag-reducing effect of a superhydrophobic coating on a macroscopic model ship at high speed, J. Mater. Chem. A, 2013, 1(19), 5886 RSC.
- Z. Yu, X. Liu and G. Kuang, Water slip flow in superhydrophobic microtubes within laminar flow region, Chin. J. Chem. Eng., 2015, 23(5), 763–768 CrossRef CAS.
- N. Guan, Z. Liu and G. Jiang, et al., Experimental and theoretical investigations on the flow resistance reduction and slip flow in super-hydrophobic micro tubes, Exp. Therm. Fluid Sci., 2015, 69(3), 45–57 CrossRef CAS.
- H. Zhang, L. Yin and X. Liu, et al., Wetting behavior and drag reduction of superhydrophobic layered double hydroxides films on aluminum, Appl. Surf. Sci., 2016, 380, 178–184 CrossRef CAS.
- B. Bhushan, Y. Wang and A. Maali, Boundary Slip Study on Hydrophilic, Hydrophobic, and Superhydrophobic Surfaces with Dynamic Atomic Force Microscopy, Langmuir, 2009, 25(14), 8117–8121 CrossRef CAS PubMed.
- J. W. Tyrrell and P. Attard, Images of nanobubbles on hydrophobic surfaces and their interactions, Phys. Rev. Lett., 2001, 87(17), 176104 CrossRef CAS PubMed.
- K. Park, H. J. Choi and C. Chang, et al., Nanotextured Silica Surfaces with Robust Superhydrophobicity and Omnidirectional Broadband Supertransmissivity, ACS Nano, 2012, 6(5), 3789–3799 CrossRef CAS PubMed.
- Z. Ge, D. G. Cahill and P. V. Braun, Thermal conductance of hydrophilic and hydrophobic interfaces, Phys. Rev. Lett., 2006, 96(18), 186101 CrossRef PubMed.
- B. Wang, M. He, H. Wang, et al., Flow boiling heat transfer in wettability patterned microchannels[C]. Thermal and Thermomechanical Phenomena in Electronic Systems. IEEE, 2017.
- M. Liravi, H. Pakzad and A. Moosavi, et al., A comprehensive review on recent advances in superhydrophobic surfaces and their applications for drag reduction, Prog. Org. Coat., 2020, 140, 1055537 CrossRef.
- H. J. Jo, H. S. Ahn and S. H. Kang, et al., A study of nucleate boiling heat transfer on hydrophilic, hydrophobic and heterogeneous wetting surfaces, Int. J. Heat Mass Transfer, 2011, 54(25), 5643–5652 CrossRef CAS.
- S. J. Kim, et al., Effects of nanoparticle deposition on surface wettability influencing boiling heat transfer in nanofluids, Appl. Phys. Lett., 2006, 89(15), 718 Search PubMed.
- J. Koplik, J. R. Banavar and J. F. Willemsen, Molecular dynamics of fluid flow at solid surfaces, Phys. Fluids A, 1989, 1(5), 781–794 CrossRef CAS.
- B. Y. Cao, J. Sun and M. Chen, et al., Molecular Momentum Transport at Fluid-Solid Interfaces in MEMS/NEMS: A Review, Int. J. Mol. Sci., 2009, 10(11), 4638–4706 CrossRef CAS PubMed.
- F. Sofos, T. E. Karakasidis and A. Liakopoulos, Surface wettability effects on flow in rough wall nanochannels, Microfluid. Nanofluid., 2012, 12(1–4), 25–31 CrossRef CAS.
- C. Zhang and Y. Chen, Slip behavior of liquid flow in rough nanochannels, Chem. Eng. Process., 2014, 85, 203–208 CrossRef CAS.
- G. Nagayama and P. Cheng, Effects of interface wettability on microscale flow by molecular dynamics simulation, Int. J. Heat Mass Transfer, 2004, 47(3), 501–513 CrossRef CAS.
- H. Zhang, Z. Zhang and H. Ye, Molecular dynamics-based prediction of boundary slip of fluids in nanochannels, Microfluid. Nanofluid., 2012, 12(1–4), 107–115 CrossRef.
- P. L. Kapitza, The study of heat transfer in helium II, J. Phys., 1941, 4(1–6), 181–210 Search PubMed.
- S. Maruyama and T. Kimura, A study on thermal resistance over a solid–liquid interface by the molecular dynamics method, Therm. Sci. Eng., 1999, 7(1), 63–68 CAS.
- M. Barisik and A. Beskok, Temperature dependence of thermal resistance at the water/silicon interface, Int. J. Therm. Sci., 2014, 77(1), 47–54 CrossRef CAS.
- Y. Wang and P. Keblinski, Role of wetting and nanoscale roughness on thermal conductance at liquid-solid interface, Appl. Phys. Lett., 2011, 99(7), 73112 CrossRef.
- L. Shi, C. Z. Hu, C. L. Yi, J. Z. Lyu, M. L. Bai and D. W. Tang, A study of interface evolution-triggering different nucleate boiling heat transfer phenomenon on the structured surfaces, Int. J. Heat Mass Transfer, 2022, 190, 122754 CrossRef.
- H. K. Bo, A. Beskok and T. Cagin, Thermal interactions in nanoscale fluid flow: molecular dynamics simulations with solid–liquid interfaces, Microfluid. Nanofluid., 2008, 5(4), 551–559 CrossRef.
- F. Jabbari, A. Rajabpour and S. Saedodin, et al., The effect of water/carbon interaction strength on interfacial thermal resistance and the surrounding molecular nanolayer of CNT and graphene nanoparticles, J. Mol. Liq., 2019, 282, 197–204 CrossRef CAS.
- Q. Cao, W. Shao and X. Ren, et al., Molecular dynamics simulations of the liquid film evaporation heat transfer on different wettability hybrid surfaces at the nanoscale, J. Mol. Liq., 2020, 314, 113610 CrossRef CAS.
- Y. Ueki, Y. Miyazaki and M. Shibahara, et al., Molecular dynamics study of thermal resistance of solid–liquid interface in contact with single layer of nanoparticles, Int. J. Heat Mass Transfer, 2018, 120, 608–623 CrossRef CAS.
- R. Khare, P. Keblinski and A. Yethiraj, Molecular dynamics simulations of heat and momentum transfer at a solid–fluid interface: Relationship between thermal and velocity slip, Int. J. Heat Mass Transfer, 2006, 49(19/20), 3401–3407 CrossRef CAS.
- J. Sun, W. Wang and H. S. Wang, Dependence between velocity slip and temperature jump in shear flows, J. Chem. Phys., 2013, 138(23), 5 CrossRef PubMed.
- J. Sun, W. Wang and H. S. Wang, Dependence of nanoconfined liquid behavior on boundary and bulk factors, Phys. Rev. E: Stat., Nonlinear, Soft Matter Phys., 2013, 87(2–1), 023020 CrossRef PubMed.
- J. J. Nicolas, K. E. Gubbins and W. B. Streett, et al., Equation of state for the Lennard-Jones fluid, Mol. Phys., 1979, 37(5), 1429–1454 CrossRef CAS.
- X. D. Din and E. E. Michaelides, Kinetic theory and molecular dynamics simulations of microscopic flows, Phys. Fluids, 1997, 9, 3915–3925 CrossRef CAS.
- J. L. Barrat and L. Bocquet, Large slip effect at a nonwetting fluidsolid interface, Phys. Rev. Lett., 1999, 82, 4671–4674 CrossRef CAS.
- J. Delhommelle and P. Millie, Inadequacy of the Lorentz−Berthelot combining rules for accurate predictions of equilibrium properties by molecular simulation, Mol. Phys., 2001, 99, 619–625 CrossRef CAS.
- M. S. Daw and M. I. Baskes, Semiempirical, Quantum Mechanical Calculation of Hydrogen Embrittlement in Metals, Phys. Rev. Lett., 1983, 50(17), 1285–1288 CrossRef CAS.
- M. S. Daw and M. I. Baskes, Embedded-atom method: Derivation and application to impurities, surfaces, and other defects in metals, Phys. Rev. B: Condens. Matter Mater. Phys., 1984, 29(12), 6443–6453 CrossRef CAS.
- X. Yin, C. Hu, M. Bai and J. Lv, An investigation on the heat transfer characteristics of nanofluids in flow boiling by molecular dynamics simulations, Int. J. Heat Mass Transfer, 2020, 162, 120338 CrossRef CAS.
- L. Shi, C. Hu and M. Bai, et al., Molecular dynamics study on drag reduction mechanism of nonwetting surfaces, Comput. Mater. Sci., 2019, 170, 109127 CrossRef CAS.
- F. Sofos, T. E. Karakasidis and A. Liakopoulos, Surface wettability effects on flow in rough wall nanochannels, Microfluid. Nanofluid., 2012, 12(1–4), 25–31 CrossRef CAS.
- C. Ji and Y. Yan, A molecular dynamics simulation of liquid-vapor-solid system near triple-phase contact line of flow boiling in a microchannel, Appl. Therm. Eng., 2008, 28(2–3), 195–202 CrossRef CAS.
- Y. Chen, Y. Zou, Y. Wang, D. Han and B. Yu, Bubble nucleation on various surfaces with inhomogeneous interface wettability based on molecular dynamics simulation, Int. Commun. Heat Mass Transfer, 2018, 98, 135–142 CrossRef CAS.
Footnote |
| † Electronic supplementary information (ESI) available. See DOI: https://doi.org/10.1039/d2cp03905b |
| This journal is © the Owner Societies 2023 |


