Effects of pressurization on the enthalpy of vaporization for the SiO2 nanofluid
Zahra
Baniamerian
 *a,
Amir Sadra
Jafari
b and
Noel
Perera
c
aDepartment of Mechanical Engineering, Tafresh University, Tafresh, Iran. E-mail: amerian@tafreshu.ac.ir
bDepartment of Chemical Engineering, Tafresh University, Tafresh, Iran
cSchool of Engineering and the Built Environment, Birmingham City University, UK
First published on 29th November 2022
Abstract
Using a microchannel heatsink is an advanced cooling technique to meet the cooling needs of electronic devices installed with high-power integrated circuit packages (microchips). These heat sinks utilize microchannel heat exchangers (MCHEs) with boiling-mode cooling (BMC) and nanofluids. Such MCHEs usually have high operating pressures (3–13 bar). In spite of a large number of studies carried out on other thermo-physical properties of nanofluids, few studies have been carried out on the latent heat of evaporation (LHE) of nanofluids. The limited published literature all reports the LHE under atmospheric conditions, which are outside of the operating range of MCHEs. The precise estimation of the LHE is essential for the appropriate design of MCHEs. In the present study, a novel experimental setup is applied for the measurement of LHE under high operating pressure and temperature conditions (90–180 °C and 80–880 kPa) and for investigating the effects of pressure on the LHE. It has been shown that by exposing a nanofluid under pressure some new hydrogen bonds are formed increasing the LHE, which significantly improves the performance of boiling cooling of MCHEs. Based on the obtained results by pressurizing a 2 vol% (4.6 wt%) SiO2 nanofluid, the LHE can be increased by about 17% in comparison with that of a similar non-pressurized sample. On the other hand, pressurization can improve nanofluid stability. Finally, a correlation is proposed for the calculation of enthalpy of evaporation of SiO2 nanofluids.
I. Introduction
The world is moving toward miniaturization in almost all areas of technology. Hence, the removal of high heat flux from highly compact systems such as high-performance computer/electronic chips and laser diodes is essential to ensure their long-term consistent performance. Using boiling mode cooling systems (BMCSs) in microchannel heat exchangers (MCHEs) is the most effective cooling method for compact systems like electronic chips. Such MCHEs operate at high pressures (about 3–13 bar).1 Nanofluids, due to their improved thermo-physical potentials, have been recently welcomed as a new generation of coolants in MCHEs. Not only in MCHEs but also in other industrial applications, nanofluids are becoming a good replacement for conventional coolants to achieve a better convective heat transfer performance.2–5 Nanofluids are suspensions of nanoparticles in a base fluid such as water, oil, and ethylene glycol. The nanoparticles are typically made of metals, oxides, or carbon nanotubes.Steam generation with nanofluids under solar radiation is presently applied widely, similar to MCHEs associated with boiling. Due to the strong absorption of solar energy, solar vapor generation by nanofluids could have wider applications in many areas including desalination, sterilization, and power generation.6 One of the most important criteria in the efficiency of the boiling phenomenon is the latent heat of evaporation (LHE). The higher the LHE, the better its thermal performance. In boiling systems that employ working fluids of larger LHEs, longer lengths of dryout,† higher critical heat fluxes (CHF) as well as higher heat transfer coefficients may be achieved.7,11 Published literature9–11 reports an increase in the latent heat of nanofluids in comparison with a pure fluid and also highlights a reduction in the latent heat as a result of adding nanoparticles.9 In some cases,11,12 different trends have been observed for the same nanoparticles of various volume fractions or when they are subjected to different operating conditions.
To employ nanofluids as the working fluid for boiling-mode cooling systems, a comprehensive investigation is required to clarify their thermo-physical properties under varying operating pressure conditions. Unlike other thermo-physical properties of nanofluids for which a definite correlation/trend is reported in several studies,13–16 there is no clear trend/correlation obtained for variation of LHE of nanofluids. Also presently researchers17,18 have not yet identified a nanoparticle that can increase the LHE to extend the dryout length. The limited number of published articles in this area is also restricted to the pressure under standard conditions which is outside the operating range of boiling-mode applications.
There is much published literature on simulations of boiling nanofluids that assume the LHE of nanofluids is similar to that of a pure fluid. Such a hypothesis exerts a significant error in the simulations as reported by Baniamerian et al.8,19–21 where the LHE of nanofluids, in some cases, could have a difference of up to 40% when compared with that of the base fluid.
Measurement of LHE at high pressures is difficult hence requiring more advanced equipment and technology. This study assessed the LHE for the high-pressure operating conditions between 80 and 880 kPa. This study is divided into two main sections. The first section assesses the effects of suppression on the LHE. It is shown in this study, after performing so many tests that by suppressing a nanofluid, some new hydrogen bonds form enhancing the LHE. The formed hydrogen bonds also improve the stability of the nanofluid. The second section is devoted to the measurement of enthalpy of evaporation of SiO2 nanofluids under various saturation conditions to obtain a correlation for the LHE of SiO2 nanofluids.
The novelties of the present study are measuring the LHE of nanofluids at high pressures. Presently there is no published literature on LHE correlations for nanofluids at high pressures. All available correlations are reported under atmospheric conditions which are outside the operating range of boiling-mode applications. The second novelty concerns the enhancement of LHE by suppression which can significantly improve the performance of boiling cooling of MCHEs.
II. Experimental measurements
A. Experimental apparatus
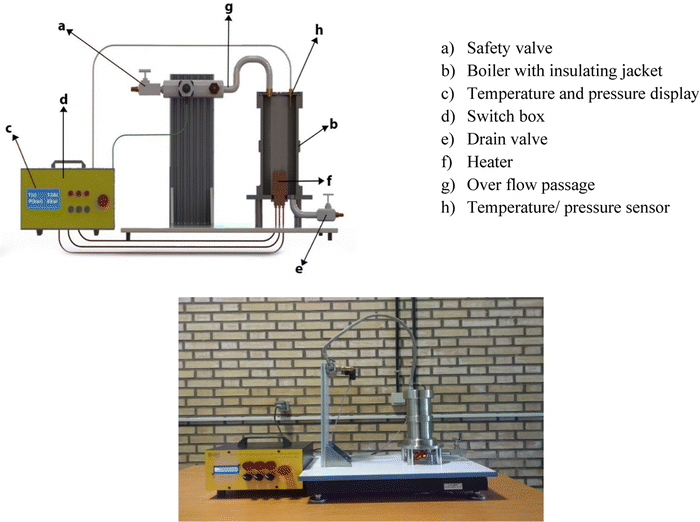
In the present study, using a novel test rig, the pressure-temperature values are measured under saturation conditions. This setup is designed to demonstrate the thermodynamic basic principle of the boiling phenomenon. It consists of a stainless steel pressure vessel equipped with an immersion electrical heater. The unit also comes with a safety valve, a glass thermometer, and a Bourdon-type pressure gauge. The setup is equipped with transducers for temperature and pressure so that the respective values on a digital indicator can be read. The pressure is measured using a pressure transducer with an accuracy of ±0.1 Pa. The temperatures before the inlet of the pre-heater and within the test section were measured with the thermocouples (± 0.05 °C). The schematic and real picture of the present experimental setup is shown in Fig. 1.By filling the boiler vessel with a liquid and turning the heater on, the liquid warms up to its boiling point then gradual evaporation will cause pressure in the vessel which is measured by the pressure transducer. The saturation temperature as well as the saturated vapor pressure are visualized to be employed for the calculation of the LHE. The vessel content during the LHE measurement is compressed, hence during the LHE measurement for a nanofluid to a certain pressure, the nanofluid is practically pressurized to that pressure. Therefore, the pressurized nanofluids to 4 bar, for instance, are in fact the sample for which the LHE has been measured up to 4 bar and set aside. This explanation will be needed in the following sections.
III. Preparation of nanofluids
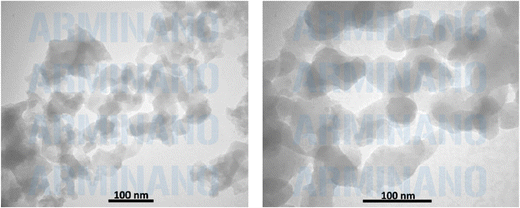
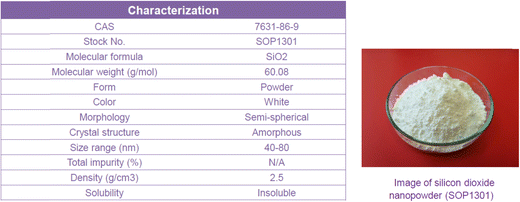
In the present study, a SiO2-water nanofluid is prepared by dispersing SiO2 nanoparticles of 40–80 nm in the deionized water (DI). An ultrasonic bath as well as pH controlling to prevent agglomeration is used. Nanoparticles were found to be stable and the stability lasted over 2 months; no intermediate mixing was considered necessary.First, the experimental measurements are accomplished for the pure DI water as the baseline experiment, then the measurements are repeated for the nanofluid of SiO2-water at various volume concentrations of 0.006–2 vol% (0.014–4.6 wt%). The characterization of nanofluids, as reported by the supplier, is shown in Fig. 2 and 3.
IV. Methodology
In the present study, we want to test whether pressurizing a nanofluid to a certain pressure and leaving it aside can lead to any change in the structure of molecules and their potentials or not. If yes, we can practically pressurize nanofluids before their application for making some improvement on their stability, LHE, and potential. We investigated if pressurization is a useful method for having nanofluids with higher LHE and fortunately we found by the experimental results that pressurization can make some new bonds and lead to higher potentials and in turn higher LHEs. This is very useful for boiling-mode thermal absorption like in direct steam generation solar collectors or boiling-mode coolers where higher LHE fluids are welcomed.The present study contains two principal sections: The first section of the study assessed the effects of pressurization on the LHE. For this purpose, the prepared nanofluid was filled in equal amounts in 4 separate containers. Each container containing the nanofluid was pressurized to a selected pressure and the effects of the applied pressure on the LHE of the nanofluid were assessed three times. In other words, after pressurizing each container the LHE was measured for the pressurized content three times to investigate if pressurization leads to a fixed change in the structure of the fluid or not. In this regard, the content of the first container was suppressed up to 280 kPa, then it was left to cool down. As it cooled down, the suppressed nanofluid was filled into the test rig to measure its LHE. LHE measurements were performed 3 times once 1 day after pressurization, the second and third times were accomplished two weeks and two months after pressurization.
To investigate the effect of pressurization, the content of a second container was suppressed up to a pressure of 480 kPa and after it cooled down its LHE was measured. This process was repeated for other suppressed containers to assess the effects of various suppressions. In this regard, the contents of the third and fourth containers were pressurized up to 680 kPa and 880 kPa, respectively. And after they were cooled down, their LHE was similarly measured one day, two weeks, and two months after pressurization. A container containing nanofluid that was not suppressed (i.e. no applied pressure) was used as the benchmark for this study.
In the second section of the study, the LHE for the SiO2 nanofluid is measured and reported under various saturation conditions and compared with that of pure water as the benchmark. A correlation for the LHE of SiO2 at different saturated pressures is derived finally.
V. Calculation of the LHE
When the liquid content of the container heats up to its boiling point, a phase change occurs which results in a change in its volume. The Clausius–Clapeyron relation can be used for characterizing a discontinuous phase transition between two phases of matter. During the phase change, temperature and pressure magnitudes are measured. The enthalpy of evaporation can be calculated by considering any two points along the coexistence curve between the two phases, together with the Calsius-Clapeyron relation. This relation is written as follows: | (1) |
 | (2) |
VI. Uncertainty analysis
Uncertainty analysis can determine the accuracy of model outcomes. When a measurement is determined, it is assumed that the exact or true value exists based on a predefined scale. The accuracy of the determined measurement is usually dependent on the measurement method and its repeatability. Hence, it is vital that an uncertainty analysis is carried out to enhance the confidence levels of the obtained experimental measurement. In systems or models with relatively few inputs and with a simple structure, uncertainty analysis may be straightforward.The authors identified some potential sources of error in the experiments conducted in this study which were attributed to the data acquisition, data reduction, and calibration. To reduce these experimental errors, all measuring instruments were calibrated before performing the experiments. The uncertainty of temperature data acquisitions (T) is ±0.05 °C. The pressure (P) is measured by a pressure transducer with the uncertainty of ±0.005 Pa.
The Moffat method23 is employed in this study to analyze uncertainty for the present range of measurements (90–180 °C and 80–880 kPa). Based on this method, the main correlation for calculation of the concerning factor (for instance, R) is written as follows:
| R = Xa1Xb2Xc3…XmM | (3) |
 | (4) |
As previously mentioned, the main correlation for calculation of the LHE in this study is the correlation of Clasius–Clapeyron (eqn (1) and (2)). Therefore, based on the Moffat method, the relative uncertainty can be written as follows:
 | (5) |
VII. Potentials between the particles
The pair potential between two molecules can be expressed as the sum of Lennard-Jones (LJ) and coulombic potential functions. The Lennard-Jones potential approximates the interaction between a pair of neutral atoms or molecules. Both Lennard-Jones and coulombic potentials are reverse functions of pair particle distance. As the distance within the atoms increases the potentials between them decrease. The most important role of pressure increase in the present study is on reducing the distance between the particles and consequently increasing the pair potentials between particles.VIII. Results and discussion
A. Baseline experiment
The results of experiments with pure water are considered as the baseline. In this regard variations of LHE, obtained from the performed experiment, for different saturation conditions are plotted against the corresponding results of ASHRAE24 (Fig. 4 and 5). These graphs highlight the maximum error of about 4.8% and the average relative error of 2.7% between the experimental results of pure water and the corresponding ASHRAE results. Once the baseline testing and validation were completed, the container was charged with various nanofluids introduced in the first column of Table 1. The tests were then carried out to achieve saturation pressure-temperature variations to determine the LHE.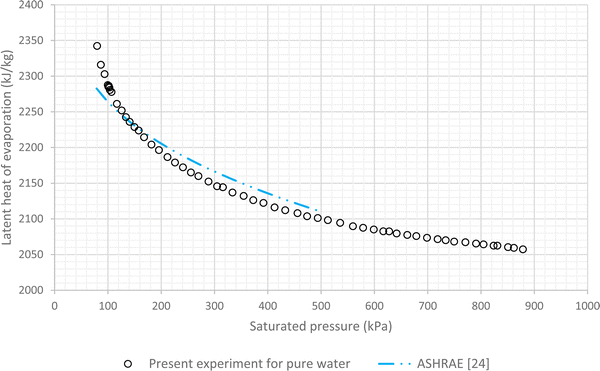 | ||
| Fig. 4 Variation of LHE against pressure for pure deionized water, comparison between experimental results and ASHRAE results.24 | ||
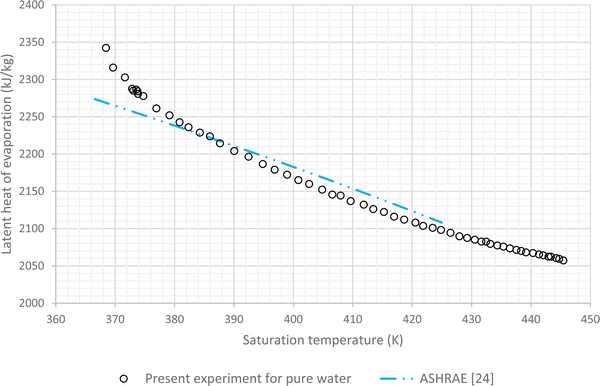 | ||
| Fig. 5 Variation of LHE against temperature for pure deionized water, comparison between experimental results and ASHRAE results.24 | ||
| SiO2 nanofluid | Pressure increase up to 280 kPa (2 bar) | Pressure increase up to 480 kPa (4 bar) | Pressure increase up to 680 kPa (6 bar) | Pressure increase up to 880 kPa (8 bar) |
|---|---|---|---|---|
| 0.05 vol% (0.11 wt%) | 0.3% | 1.2% | 1.1% | 0.1% |
| 0.1 vol% (0.23 wt%) | 0.3% | 1.7% | 2.8% | 2.3% |
| 0.2 vol% (0.47 wt%) | 0.4% | 1.8% | 3% | 2.1% |
| 0.5 vol% (1.1 wt%) | 1.6% | 5% | 5.7% | 4.6% |
| 1 vol% (2.3 wt%) | 3.3% | 8.5% | 9.8% | 9.6% |
| 1.5 vol% (3.5 wt%) | 4% | 13.1% | 13.4% | 9.8% |
| 2 vol% (4.6 wt%) | 5.3% | 15.3% | 17.2% | 10.1% |
B. Description of pressure experiments
Based on the performed tests and obtained data, suppressing nanofluids can change their stability behavior (due to structure change) and some of their characteristics such as the LHE. To investigate the effects of pressure on nanofluids and also to prove that pressure exerts some effects on the hydrogen bonds of nanoparticles, some tests were performed. In this section, the effect of pressure is assessed, against the non-pressurized nanofluid which is applied as the benchmark instead of pure water. This is because the pressure affects the water LHE simultaneously as it affects the nanofluid LHE. So water may not be a good benchmark sample for studying the effect of pressure on the evaporation enthalpy of nanofluids. Therefore, to assess the effects of pressure in more detail, the LHE of pressurized nanofluids was compared with that of their corresponding non-pressurized version.As mentioned in the Methodology section, each volume concentration of SiO2 (0.05–2 vol%) nanofluid was subjected to four sets of suppression, 280, 480, 680 and 880 kPa.
Based on the accomplished measurements in this study, it was found that by suppressing the nanofluid to a specific pressure (which will be described in the following sections), changes in the hydrogen bonds may take place and fix. This conclusion is based on the fact that when the pressurization was applied, the LHE of nanofluid was changed (due to structure change) subsequent measurements (which were performed two weeks and two months later) gave the same result for the same suppression range, so the resulting change in the structure might be fixed (Table 1).
C. Effects of pressure on formation/destruction of hydrogen bonds
The mentioned procedure in the previous section is accomplished for all volume concentrations of SiO2 nanofluids; although only results of 0.1 vol% (0.23 wt%) and 1.5 vol% (3.5 wt%) (as representative of low and high volume concentrations) are plotted. The results of other tests are reported in Table 1.The results of non-pressurized and various pressurized samples of 1.5 vol% (3.5 wt%) SiO2 are shown in Fig. 6a. Based on the obtained results, two important conclusions were drawn. The first reveals the role of pressure on the overall potential of the nanofluid. As observed in Fig. 6a, the increase in pressure might have brought the particles closer together and therewith increases the potentials. Therefore, the pressurized nanofluid shows higher LHE values than the non-pressurized one. The test with a non-pressurized sample showed that by increasing the pressure of the nanofluid, the LHE reaches a steady state when the pressure is between 580 kPa and 880 kPa, and the first conclusion shown in Fig. 6a is the margin for the pressurization which leads to a higher LHE. As observed in Table 1, the LHE of the nanofluid that was exposed to pressures of 480 kPa and 680 kPa has increased by an average of about 13.1% and 13.4% for the 1.5 vol% (3.5 wt%) SiO2 nanofluid. Further suppression has led to a reduction in the LHE to 9.8% for the SiO2 nanofluid which was pressurized up to 880 kPa. The results of these tests confirmed the postulated pressure theory that an increase of pressure up to 280 kPa had no sensible effect. However, by suppressing samples up to 480 kPa, the particles were forced, thereby increasing the potentials and causing a rise in the LHE. The same occurred with an increase in pressure up to 680 kPa. However, increasing the pressure up to 880 kPa might have possibly destroyed some of the newly formed hydrogen bonds which resulted in the decrease in the LHE value. The second conclusion, as the determination of an operating pressure for a nanofluid, can assure its stable performance specially in cyclic applications. This pressure is defined for the boiling-mode application of nanofluids and may differ for various volume fractions and nanoparticles.
The results of the pressurized and non-pressurized 0.1 vol% (0.23 wt%) SiO2 are shown in Fig. 6b. As observed in Fig. 6b and Table 1, the LHE values for the SiO2 nanofluids exposed to the 480 kPa, 680 kPa and 880 kPa pressures have no sensible increment when compared to the test with a non-pressurized sample.
As observed in Table 1, the increase in the applied pressure for pressurization increased the LHE of the higher volume concentration nanofluid and by reducing the volume concentrations of nanoparticles, the pressure effect on LHE enhancement decreased. The maximum average LHE increase of 17.2% was achieved by the 2 vol% (4.6 wt%) SiO2 nanofluid subjected to an applied pressure up to 680 kPa.
As mentioned before, when nanoparticles are added to the water some hydrogen bonds break to make some room for the added nanoparticles. The higher the number of added particles the higher the broken bonds may result. A broken bond, in practice, is a potential loss and therefore LHE decreases. We found that exerting pressure can compensate for some of the lost potentials because of making some new hydrogen bonds between the nanoparticles and water molecules. However in some cases, exerted pressures break additional hydrogen bonds and the number of broken bonds exceeds the newly formed bonds and therefore results in a decrease in LHE. This issue is more probable for lower volume concentrations. At higher volume concentrations, pressure sounds more effective in the formation of new bonds rather than the construction of bonds. So in higher volume concentrations, by exerting more compressing pressure, much more new bonds may form but as can be found in both Fig. 6 and Table 1, there is a margin for pressurization. Because pressurizing the samples over a certain value makes no sense. For Fig. 6a, pressurization up to 2 bar made a slight increase in LHE (means making some new bonds formation) although pressurization up to higher amounts like 4 bar, 6 bar provides higher LHEs due to the formation of more amount of new bonds. By exerting higher pressures, a slight decrease happens that shows the destructive effect of pressurization. So 6 bar is reported as the optimum pressure for compression of 1.5 vol% SiO2. In other words, 2 bar pressurization makes some new hydrogen bonds between nanoparticles and water molecules so the LHE curve shifts a little up; while higher pressurizing the sample up to 4 bar and 6 bar provides conditions for the formation of many more hydrogen bonds and therefore much more increase in the LHE occurs and the LHE curve shifts upper.
Another important aspect of the pressure effect was the stability of the pressurized nanofluid. The nanofluids that were subjected to pressures up to 680 kPa have become more stable with no observed agglomeration or sedimentation after 9 months. The non-pressurized sample, however, experienced sedimentation after 4 months. Hence, it can be concluded that pressure potentially can increase the nanofluid stability when employed alongside the ultrasonic bath and appropriate mixing procedures.
D. Calculation of LHE for various concentrations of SiO2
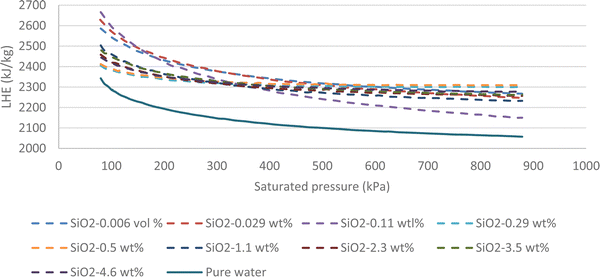
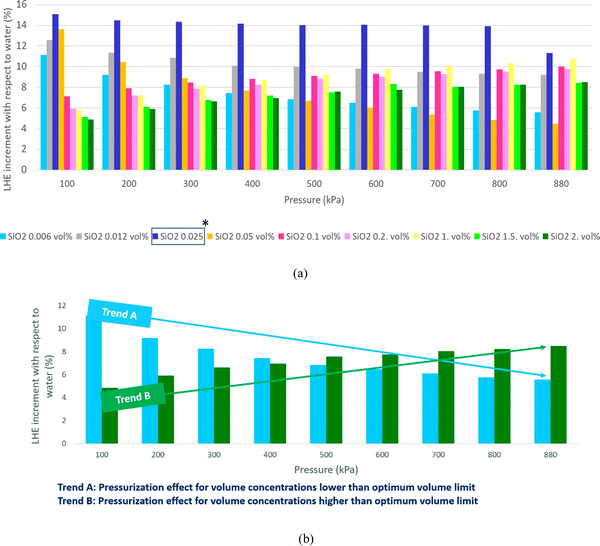
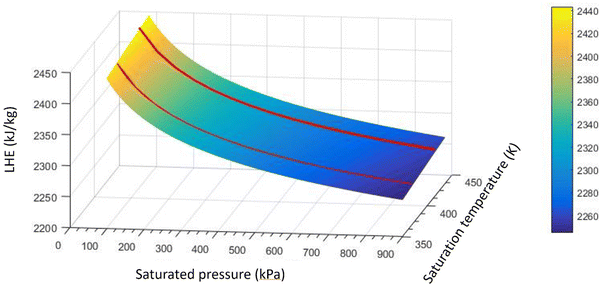
Fig. 7 highlights that all volume concentrations of SiO2 nanoparticles have greater LHE values when compared to pure water. It is worth noting that at a pressure of 320 kPa, the graphs of all the different volume concentrations of the nanofluid converged except the 0.029% and 0.11% volume concentrations. For pressures less than 320 kPa, the low-volume concentration nanofluids possessed higher LHE values and vice versa. This demonstrates the effects of pressure on the evaporative behavior of the nanofluid.By adding SiO2 nanoparticles to pure water some hydrogen bonds may be broken to make room for the SiO2 molecules.25 As a consequence of the layering effects of water molecules around the SiO2 molecules and the corresponding potentials,26,27 an interaction occurs between the molecules. It is possible that the newly formed potentials could compensate for the broken bonds as the LHE for the SiO2 nanofluid is higher than that of pure water.28,29 Based on this study, it can be concluded that the addition of nanoparticles at selected volume concentrations to a base fluid can increase the LHE. However further increasing the volume concentration of the nanofluid can destroy the hydrogen bonds with no more newly formed bonds created which results in a fluid with weaker potentials and lower LHE values. Fig. 8a shows the vaporization enthalpy enhancement with respect to pure water (ΔLHE) at different pressures and volume concentrations of SiO2. The results showed that by increasing the volume concentration of SiO2 nanoparticles from 0.006 vol% (0.0142 wt%) to 0.025 vol% (0.05 wt%), the ΔLHE increased for the entire range of considered pressures. However, for the 0.05 vol% (0.11 wt%) and higher concentrations, the ΔLHE decreased. The 0.025 vol% (0.11 wt%) is the optimum volume limit for the SiO2 nanofluid. It was also highlighted that an applied pressure increase in low volume concentrations of SiO2 (lower than 0.025 vol%, 0.11 wt%) produced lower ΔLHE but the opposite was noted for higher volume concentrations. This relationship is shown in Fig. 8b.
This confirms the postulation of the influence of pressure. Pressure can influence the formation of new hydrogen bonds in a higher concentration of nanoparticles. For higher concentrations of nanoparticles for which the cutoff distance becomes low, pressure increment plays an effective role in further decreasing the distance between the particles and therefore enhancing the potentials. For low-volume concentrations of nanoparticles, some hydrogen bonds may break and the existing potentials between the nanoparticles and water molecules may weaken. A pressure increase in this condition may have a negative effect and may even destroy some of the hydrogen bonds.
E. Development of a correlation for enthalpy of evaporation of SiO2 nanofluids
The optimal design of boiling-mode cooling systems requires an accurate estimation of dryout length and CHF, which is dependent on an accurate LHE value. Available correlations for the LHE in the literature approximate the LHE at standard pressure or in some cases12,25 low pressures which are far from the operating conditions of boiling systems. In this study, based on the obtained experimental results, a new empirical model was developed by the authors to predict the enthalpy of evaporation of SiO2 nanofluids using the curve-fitting method. The following correlation was proposed: | (6) |
 | (6a) |
| χ = Ln(ϕ) | (6b) |
| B = −0.1739χ3 − 0.4618χ2 − 0.1781χ + 0.2406 | (6c) |
Due to the large quantity of data, further evaluation of the proposed correlation was carried by comparing the experimental data and the results of the proposed correlations under different saturation conditions. The deviations are reported in a pie diagram, as shown in Fig. 10. It should be noted that no data were excluded to achieve the correlation and the maximum deviation of the correlation from the experimental results was 3%.
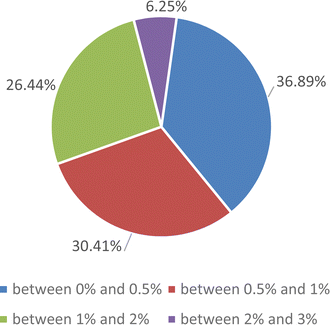 | ||
| Fig. 10 Pie diagrams to estimate the accuracy of proposed correlation for the enthalpy of evaporation of the SiO2 nanofluid. | ||
IX. Concluding remarks
The application of nanofluids as a coolant in boiling-mode cooling applications has progressed in the last decade. One of the key parameters in the optimal design of systems for such applications is the enthalpy of evaporation. In this study, the enthalpy of evaporation was measured for SiO2 nanofluids. The operating pressure i.e. 80–880 kPa of this reported study was set similar to the real-life application of the boiling-mode systems. In this paper, we investigated if pressurization changes the nanofluid's potentials and in turn LHE. Based on the obtained results, we found that pressurization can make some new bonds and lead to higher potentials and in turn higher LHEs. This is very useful for boiling-mode thermal absorption applications like direct steam generation solar collectors or boiling-mode coolers where working fluids with higher LHE are welcomed. With the proposed novel idea and apparatus, we could enhance the LHE of nanofluids by compressing them before use and this LHE enhancement is permanent because it results from the formation of some new bonds due to pressurization.From the obtained data, the concluding remarks are as follows:
(1) 0.025 vol% SiO2 nanofluid could enhance the LHE by about 15% in comparison with pure water.
(2) By pressurizing a nanofluid, the particles grow closer together increasing their interacting potentials which enhance the LHE. It was found that the new arrangement of particles, due to the pressure increase, does not change because repeating the test with the pressurized nanofluid at various time intervals produces similar results. Evaluating this phenomenon for other nanofluids will be greatly beneficial to the wider academic and industrial community.
(3) Pressurization of the nanofluid can create more stable nanofluids. For the pressurized SiO2 nanofluids, no sedimentation took place after 9 months; However, the non-pressurized SiO2 nanofluid samples sedimented after 4 months.
(4) While pressurization affected the high-volume-concentrative nanofluids, it had almost no influence on the lower volume concentration nanofluids. For example, pressurizing a 2 vol% SiO2 nanofluid can increases its LHE up to 12 percent while for the 0.006 vol% SiO2 nanofluid, pressurization can just lead to about 5% increase in the LHE.
(5) Increasing the volume concentration of SiO2 nanoparticles from 0.006 vol% to 0.025 vol% increased the ΔLHE for the entire range of considered pressures. However, for the 0.05 vol% and the higher volume concentrations, the ΔLHE decreased. The 0.05 vol% was the optimum volume limit for the SiO2 nanofluid. This demonstrated the reverse effect of pressure on the enthalpy of vaporization. An increase in pressure in low volume concentrations (lower than 0.05 vol%) reduced the ΔLHE while the same increased the ΔLHE for higher volume concentrations.
(6) In this study, a new correlation for calculating the LHE was proposed which is applicable for a wide range of pressure and temperature conditions required for the application of nanofluids in boiling-mode cooling.
Nomenclature
| h fg | Latent Heat of Evaporation, LHE (kJ kg−1) |
| P | Pressure (kPa) |
| T | Temperature (K) |
| v | Specific volume (m3 kg−1) |
| R | Specific gas constant (kJ kg−1 K−1) |
| R (eqn (3) and (4)) | A sample factor which its uncertainty is supposed to be calculated |
| X i | Variables in a sample correlation |
| ϕ | Volume concentration of SiO2 nanoparticles (%) |
Indices
| f | Saturated liquid |
| g | Saturated vapor |
| Sat | Saturation condition |
Conflicts of interest
There are no conflicts to declare.References
- T. C. Hunga, W. M. Yan, X. D. Wang and C. Y. Chang, Heat transfer enhancement in microchannel heat sinks using nanofluids, Int. J. Heat Mass Transfer, 2012, 55, 2559–2570 CrossRef.
- P. K. Kanti, K. V. Sharma, Z. Said and M. Gupta, Experimental investigation on thermo-hydraulic performance of water-based fly ash–Cu hybrid nanofluid flow in a pipe at various inlet fluid temperatures, Int. Commun. Heat Mass Transfer, 2021, 124, 105238 CrossRef CAS.
- P. K. Kanti, K. V. Sharma, A. A. Minea and V. Kesti, Experimental and computational determination of heat transfer, entropy generation and pressure drop under turbulent flow in a tube with fly ash–Cu hybrid nanofluid, Int. J. Therm. Sci., 2021, 167, 107016 CrossRef CAS.
- P. K. Kanti, K. V. Sharma, Z. Said and V. Kesti, Entropy generation and friction factor analysis of fly ash nanofluids flowing in a horizontal tube: Experimental and numerical study, Int. J. Therm. Sci., 2021, 166, 106972 CrossRef.
- P. K. Kanti, K. V. Sharma, C. G. Ramachandra and M. Gupta, Thermal performance of fly ash nanofluids at various inlet fluid temperatures: An experimental study, Int. Commun. Heat Mass Transfer, 2020, 119, 104926 CrossRef CAS.
- J. Haichuan, L. Guiping, Z. Aimen, B. Lizhan and W. Dongsheng, Nanoparticle-based solar vapor generation: An experimental and numerical study, Energy, 2019, 178, 447–459 CrossRef.
- Z. Baniamerian, Analytical Modeling of Boiling Nanofluids, J. Thermophys. Heat Transfer, 2017, 31(1), 136–144 CrossRef CAS.
- M. Borzuei and Z. Baniamerian, Role of nanoparticles on critical heat flux in convective boiling of nanofluids: Nanoparticle sedimentation and Brownian motion, Int. J. Heat Mass Transfer, 2020, 150, 119299 CrossRef CAS.
- M. M. Ameen, K. Prabhul, G. Sivakumar, P. P. Abraham, U. B. Jayadeep and C. B. Sobhan, Molecular Dynamics Modeling of Latent Heat Enhancement in Nanofluids, Int. J. Thermophys., 2010, 31(6), 1131–1144 CrossRef CAS.
- D. Zhu, S. Wu and N. Wang, Thermal Physics and Critical Heat Flux Characteristics of Al2O3–H2O Nanofluids, Heat Transfer Eng., 2010, 31(14), 1213–1219 CrossRef CAS.
- J. Haichuan, L. Guiping, Z. Aimen, B. Lizhan and W. Dongsheng, “Nanoparticle-based solar vapor generation: An experimental and numerical study”, Energy, 2019, 178, 447–459 CrossRef.
- S. Lee, P. E. Phelan, L. Dai, R. Prasher, A. Gunawan and R. A. Taylor, Experimental Investigation of the Latent Heat of Vaporization in Aqueous Nanofluids, Appl. Phys. Lett., 2014, 104(15), 151908 CrossRef.
- S. Hashimoto, K. Yano, Y. Hirota, H. Uchiyama and S. Tsutsui, Analysis of enhancement mechanism for thermal conductivity of nanofluids by inelastic X-ray scattering, Int. J. Heat Mass Transfer, 2021, 173, 121245 CrossRef CAS.
- R. Bakhtiari, B. Kamkari, M. Afrand and A. Abdollahi, Preparation of stable TiO2-Graphene/Water hybrid nanofluids and development of a new correlation for thermal conductivity, Powder Technol., 2021, 385, 466–477 CrossRef CAS.
- V. Ya Rudyak, A. V. Minakov and M. I. Pryazhnikov, Preparation, characterization, and viscosity studding the single-walled carbon nanotube nanofluids, J. Mol. Liq., 2021, 329, 115517 CrossRef.
- A. B. Colak, A novel comparative analysis between the experimental and numeric methods on viscosity of zirconium oxide nanofluid: Developing optimal artificial neural network and new mathematical model, Powder Technol., 2021, 381, 338–351 CrossRef CAS.
- C. Y. Tso and C. Y. H. Chao, Study of Enthalpy of Evaporation, Saturated Vapor Pressure and Evaporation Rate of Aqueous Nanofluids, Int. J. Heat Mass Transfer, 2015, 84, 931–941 CrossRef CAS.
- Z. Baniamerian and M. Mashayekhi, Experimental Assessment of Saturation Behavior of Boiling Nanofluids: Pressure and Temperature, J. Thermophys. Heat Transfer, 2017, 31(3), 732–738 CrossRef CAS.
- Z. Baniamerian, R. Mehdipour and S. Murshed, An experimental investigation of heat of vaporization of nanofluids, J. Therm. Anal. Calorim., 2020, 138, 645–657 CrossRef.
- Z. Baniamerian and M. Mashayekhi, Experimental Assessment of Latent Heat of Evaporation for Hybrid Nanofluids, J. Eng. Thermophys., 2019, 27(4), 560–579 CrossRef.
- Z. Baniamerian, M. Mashayekhi and R. Mehdipour, “Evaporative behavior of gold-based hybrid nanofluids.”, J. Thermophys. Heat Transfer, 2019, 32(2), 284–291 CrossRef.
- Y. A. Cengel and M. A. Boles, Thermodynamics and engineering approach, 8th edn, 2015, pp. 662–665 Search PubMed.
- R. J. Moffat, Describing the Uncertainties in Experimental Results, Exp. Therm. Fluid Sci., 1988, 1(1), 3–17, DOI:10.1016/0894-1777(88)90043-X.
- ASHRAE Handbook: Fundamentals, 2009.
- J. Garai, Physical Model for Vaporization, Fluid Phase Equilib., 2009, 283(1–2), 89–92 CrossRef CAS.
- C. Gerardi, D. Cory, J. Buongiomo, L. Hu and T. McKrell, Nuclear Magnetic Resonance-Based Study of Ordered Layering on the Surface of Alumina Nanoparticles in Water, Appl. Phys. Lett., 2009, 95(25), 253104 CrossRef.
- Y. I. Tarasevich, State and Structure of Water in Vicinity of Hydrophobic Surfaces, Colloid J., 2011, 73(2), 257–266 CrossRef CAS.
- M. M. Heyhat, M. Abbasi and A. Rajabpour, Molecular dynamic simulation on the density of titanium dioxide and silver water-based nanofluids using ternary mixture model, J. Mol. Liq., 2021, 333, 115966 CrossRef CAS.
- J. N. Israelachvili, Intermolecular and Surface Forces, Academic Press, Burlington, MA, 3rd edn, 2011, pp. 13–15 Search PubMed.
Footnote |
| † Dryout length accounts for the distance of the pipe, in the flow direction, at which the whole amount of liquid is evaporated/entrained and the vapor phase is in direct contact with the pipe wall. |
| This journal is © the Owner Societies 2023 |

