Boosting the terahertz absorption spectroscopy based on the stretchable metasurface
Dexian
Yan
 abc,
Qinyin
Feng
ab,
Ji
Yang
ab,
Xiangjun
Li
*ab,
Le
Zhang
ab,
Yang
Zhao
ab and
Jining
Li
d
aCentre for THz Research, China Jiliang University, Hangzhou 310018, Zhejiang, China. E-mail: xiangjun_li@cjlu.edu.cn
bKey Laboratory of Electromagnetic Wave Information Technology and Metrology of Zhejiang Province, College of Information Engineering, China Jiliang University, Hangzhou 310018, Zhejiang, China
cCollege of Information Science and Electronic Engineering, Zhejiang University, Hangzhou, Zhejiang 310027, China
dCollege of Precision Instrument and Optoelectronic Engineering, Tianjin University, Tianjin 300072, Tianjin, China
First published on 22nd November 2022
Abstract
Terahertz (THz) absorption spectroscopy is widely used for molecular label-free fingerprinting detection, but it is not capable of efficiently analyzing trace-amount sample materials. For improving the efficiency of terahertz absorptance spectroscopy detection, we propose a sensing strategy by treating the geometry sweeping spoof surface plasmon polariton (SSP) of the stretchable metasurface. For the first time, the geometry sweeping can be realized by dynamically stretching the polydimethylsiloxane (PDMS) flexible substrate, leading to the resonant frequency variation of the unit cell. This design provides a significant absorption enhancement factor about 270 times for a 0.1 μm lactose film in a broad terahertz band, enabling the unambiguous identification of different trace-amount samples. The designed method exhibits a novel solution for the enhancement of broad-band terahertz absorption spectroscopy and great application potential in the field of detecting trace-amount samples.
Introduction
Terahertz (THz) absorption spectroscopy shows huge potential for many novel applications, including biomedical,1,2 gas sensing,3 and security detecting.4 Different from the measurement mechanism in which the resonant peaks shift with the refractive index of the analyte,5–8 absorption spectroscopy measurements are based on the change of resonance peaks with the absorption spectrum. Traditional absorption spectroscopy measurement facilities usually use more sample materials since the diffraction of terahertz waves.9 The current measurement of the terahertz absorption spectrum of solid samples processed by the tablet-pressing technique usually requires several hundred milligrams to several grams of the material to be measured. The interaction distance between the terahertz waves and the sample may limit the necessary amount of the samples.For improving the sensitivity of terahertz absorption spectroscopy detection, additional enhanced structures, including photonic crystal fibers, resonant cavity, metal gratings, metal split ring resonators, and dielectric metasurface structures, are required to boost the interaction between the electromagnetic wave and sample material. Among these structures, the waveguides9–11 and metasurfaces12–15 have been treated in the sensing applications. Terahertz dielectric waveguides exhibit the merits of small measurement volume, long interaction length, high signal-to-noise ratio (SNR), and so on. In this case, it is not conducive to the efficient direct coupling of terahertz waves into the waveguides.9 In addition, dielectric metagratings13 and metamaterial structures16 have been treated to boost the wide-band terahertz absorption spectroscopy of thin film samples. In general, a series of resonance peaks can be obtained by changing the incident angles of the electromagnetic waves or adopting different unit cells in the super cells. These methods are defined as multiplexing technologies. The absorptance of the thin-film samples can be greatly improved across the wide spectra by linking a battery of resonance peaks caused by sweeping the incident angles or geometrical parameters of unit cell structures. However, sweeping the incident angle at very small intervals is not easy to achieve in the actual experiments, and it is also difficult to precisely manufacture different unit cell structures with a thickness of tens of micrometers and a resolution of a few micrometers.16,17
As one of the important mechanisms for realizing the local electric field, spoof surface plasmon polariton (SSP) on graphene18 and metal-based metamaterials19,20 have been diffusely used to detect the refractive index changes of the samples in the terahertz region. Ding et al. proposed a thickness-multiplexed method to enhance the terahertz absorption via an evanescent wave.17 In this design, a bulk prism is required to couple the terahertz waves. Niknam et al. proposed a metamaterial structure composed of metal stripe unit cells to support the SSP modes with the normal incident of terahertz waves.21 Very recently, our group realized the 200-fold enhancement of the terahertz absorption spectrum using the geometry-multiplexing of metallic SSP metamaterials.22 In order to realize the enhancement effect, we used various detection unit cell structures with different geometric parameters to construct the device.
Here, we design a novel method to boost the terahertz absorption spectroscopy based on the Au-coated polydimethylsiloxane (PDMS) structure. Compared with previous reports, the designed structure exhibits three primary merits, which are: (1) the geometry multiplexing can be realized by dynamically stretching the PDMS flexible substrate, resulting in the resonant frequency variation of the unit cells; (2) the normal incident wave excites the SSP modes through the grid array to boost the absorption spectrum of the thin-film sample; (3) wide-band trace-amount terahertz absorption enhancement factor can reach about 270 times for the 0.1 μm thick lactose film. The designed terahertz absorption-enhancing structure for the trace-amount sample provides the advantages of easy fabrication and measurement, providing a novel avenue for efficient terahertz fingerprint sensing with reconfigurable metamaterials in the future.
Structure design
Fig. 1(a) depicts the schematic structural diagram of the designed stretchable SSP metamaterial. The unit cell structure consists of a hollow PDMS substrate partially coated with an Au thin film. Terahertz waves are perpendicularly incident on the surface of the metasurface structure, and the electric field is parallel to the x-axis. The substrate is composed of the PDMS material with a dielectric constant of 2.35 and the loss tangent of 0.04, and it exhibits high transmittance in the terahertz region.23 The optimized structural sizes of the unit cell structure marked in Fig. 1(b) are chosen as: Px = 410 μm, Py = 150 μm, p = 120 μm, d = 37.5 μm, a = 25 μm, wx = 30 μm, and wy = 18.75 μm. In addition, the thickness of the PDMS substrate is tp = 50 μm. The operation performances of the designed metasurface structure are evaluated on the basis of the finite element method (FEM). The Floquet boundary conditions are set along the x- and y-axes. | ||
| Fig. 1 SSP metamaterial structure for boosting terahertz absorptance. (a) Operating mechanism of the SSP metamaterial structure. (b) Geometrical parameters of the unit cell. | ||
Results and discussions
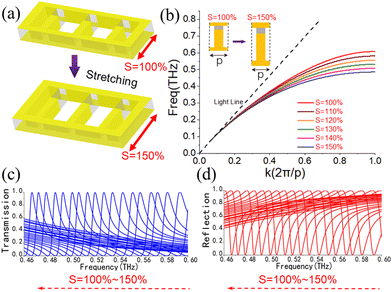
When the dimensions of all unit cell structures remain the same, the resonant frequency of the metamaterial unit cell structures can be shifted by stretching the unit cell structure along the y direction with the stretch factor S, as illustrated in Fig. 2(a). PDMS is widely treated as the substrate material for stretchable electronics due to its advantages of stable chemical properties, good thermal stability, and transparency.24 The Au-coated PDMS device has been successfully used to construct the stretchable strain sensors, which lays the foundation for the scheme designed in this paper.25 As illustrated in Fig. 2(b), the asymptotic frequency corresponding to the proposed SSP metasurface structure is affected by the stretching factor S. The black diagonal dashed line represents the terahertz dispersion properties in free space. As the frequency increases, the wavevector of SSP mode deviates from the air line in free space, and the dispersion properties exhibit a flat trend when approaching a certain frequency value. When the stretch factor S increases from 100% to 150% in a step of 3%, the deviation degree of the SSP wavevectors from the air line increases, and the frequency corresponding to the flat tendency of the dispersion curve decreases.The transmissive and reflective properties of the designed metasurface with different stretch factors S have been investigated and are shown in Fig. 2(c) and (d). The resonance peaks of the transmissive and reflective spectra exhibit the same amplitudes for each other under normal incident of the terahertz wave. When S increases from 100% to 150%, the asymptotic frequency of the dispersion curve decreases from 0.598 THz to 0.454 THz. Transmissive spectra exhibit an asymmetric Fano resonant line property. The results indicate the existence of coupling between the local SSP resonant modes and the continuum states. When the stretch factor S increases, the SSP dispersion gradually approaches the lower frequency, showing the larger SSP mode volume. In addition, the high Q-factors of resonant peaks means that the related electromagnetic wave related to the peak frequency can form a strong localized field around the metal metasurface structure. Thus, the interaction between the electromagnetic waves and the trace amount of samples can be enhanced, which is an important physical basis for the enhancement of the absorption spectrum. The Q-factors can be expressed as Q = f/Δf, where f is the frequency of the resonant peak, and Δf is defined as the full width at half maxima of the resonant peak. The SSP resonance modes can boost the electromagnetic wave-matter interactions and yield high Q-factors (>58) for sensing applications.
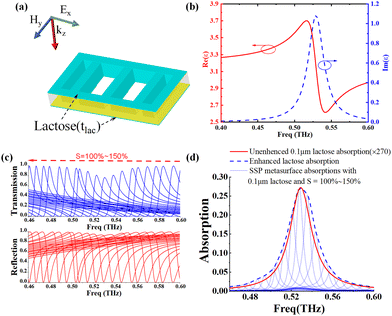
In order to demonstrate the excellent sensing of the metasurface structure, α-lactose is chosen as the analytical sample. α-Lactose can provide narrow linewidth resonant characteristics in low terahertz region around 0.52 THz, which can be used as a kind of standard test material for boosting the absorption spectrum of trace-amount samples.13 As depicted in Fig. 3(a), the air-exposed part of the SSP metasurface unit cell structure is coated with a uniform layer of α-lactose (dipped in the solution and then dry). The permittivity expression of α-lactose can be determined based on the Lorentzian model:26
 | (1) |
In eqn (1), εr = 2.08 represents the high-frequency dielectric constant of lactose, ωp and γp represent the resonant angular frequency and damping rate, respectively. Also, Δεp represents the oscillation strength factor. Here, ωp = 0.52 × 2π × 1011 rad s−1, γp = 1.59 × 10¹¹ rad s−1 and Δεp = 6.54 × 10⁻³. The real and imaginary parts of the dielectric constant of the α-lactose material in the frequency band of 0.40–0.60 THz are illustrated in Fig. 3(b).
The change of the stretch factor S results in the geometry parameters multiplexing, achieving a series of reflectance and transmittance spectra of α-lactose-coated metasurface structures with different stretch factors S, as given in Fig. 3(c). Different from the results achieved from Fig. 2, the amplitudes of the different transmission and reflection resonant peaks are different, which may be caused by the absorption of α-lactose material. Here, the absorption A of the metasurface structure can be calculated as:
| A = 1 − T − R | (2) |
In Fig. 3(c), the resonance frequency decreases linearly when the stretch factor S increases from 100% to 150%. Then, the boosted absorptance spectrum obtained by connecting the resonant peaks of absorption is investigated, as illustrated in Fig. 3(d). When the stretch factor S increases from 100% to 150%, the resonant absorption peaks (gray solid lines) caused by the SSP modes decrease from 0.60 THz to 0.46 THz. From the blue dashed line in Fig. 3(d), the boosted absorption spectrum of the metasurface structure loaded with 0.1 μm α-lactose is established by connecting the SSP-induced absorption resonant peaks with S = 100–150% in Fig. 3(d). Compared with the 270 times unenhanced absorption curve of the 0.1 μm α-lactose without the metasurface structure marked by the red solid curve, it can be deduced that the enhancement factor is about 270.
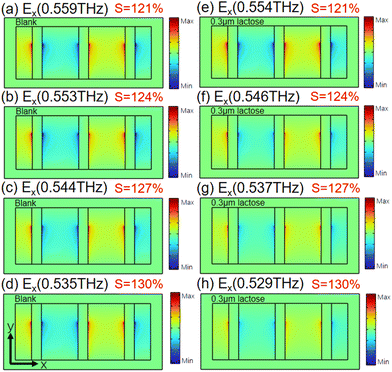
To further understand the resonant mechanism, the electric field (Ex) distributions in the x–y plane around 0.53 THz are studied without and with the 0.1 μm thick α-lactose layers. In Fig. 4, four stretch factors S, including 121%, 124%, 127% and 130%, are chosen to investigate the electric field distributions. It can be seen that the terahertz electric fields are localized in the grooves at the resonant frequencies, which demonstrates that there is a large interaction between the terahertz wave and the analytes. Fig. 4(a)–(d) show the electric field distributions of the SSP metamaterial structure without the α-lactose film coating. In this case, the intensity of the electric fields Ex remains almost the same at each resonant peak, further confirmed by the results from Fig. 2(c). Fig. 4(e)–(h) present the electric field distributions of the SSP metamaterial structure coated with the α-lactose film. The absorption enhancement effects are further demonstrated by the electric field distributions at resonant peaks near 0.53 THz coated with a 0.1 μm α-lactose film. As the resonant frequency approaches 0.53 THz, the electric field strength reduces when the stretch factor S augments. Furthermore, there are very little shifts in the resonant frequencies between the metamaterial structures coated and uncoated with α-lactose films. The electric field distribution with S = 130% indicates that the electric field strength of the metamaterial structure coated with α-lactose is significantly reduced by 40% compared to the result without lactose coating. The decrease may be due to the fact that the resonant peaks of the metamaterial approach the characteristic absorption bands of α-lactose, and more energy can be absorbed by the α-lactose material. The absorption spectrum enhancement may also be caused by the localization of the SSP electrical fields excited on the metasurfaces. By sweeping the stretch factor S, a set of absorptance spectra can be achieved. Then, the wide-band absorptance can boost the sensing of terahertz fingerprint characteristics of the trace-amount analytes through the envelopes of the resonant peaks. These envelopes can be formed by connecting the resonant peaks of the series of absorption spectra. Thus, the strengthened electric fields inside the grooves and at the edges of the microstructure play a strong part in the detection of trace-amount analytes, and can interpret the absorption enhancement of the SSP metamaterial structures. In addition, the size of the terahertz beam is usually about 2–5 mm, the normal incident wave excites the SSP modes through the microstructure array to enhance the absorption spectrum of the thin film sample in the area range of 2 mm × 2 mm.
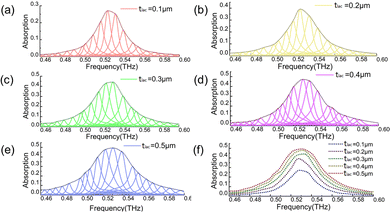
Next, the effects of the α-lactose thickness tlac on the absorption enhancement are studied, as illustrated in Fig. 5. When the thickness of the α-lactose sample increases from 0.1 μm to 0.5 μm in the step of 0.1 μm, the absorption also augments. Fig. 5(a)–(e) show the absorption spectra envelops resulting from different thicknesses tlac. When the thickness tlac increases, there are some absorption saturation trends on the envelope profile. These saturation phenomena should be caused by the limit strength of the localized field in the microstructures of the metamaterial, which determines the upper limit of the absorptance properties of the thin-film samples. When the film is thicker, more energy will be absorbed. When all the energy inside the metamaterial is depleted, there is no further change in the intensity of the absorptance peak. The enhancing factors are 270, 196, 147, 120, 99 times for 0.1, 0.2, 0.3, 0.4, 0.5 μm lactose films. Fig. 5(f) illustrates the comparison of the enhancement effects of absorption spectra with different thicknesses of α-lactose. When the thickness is close to 0.5 μm, the increasing trend of enhancement ratio decreases.
To clearly emphasize the excellent operation characteristics of the designed metamaterial structure, the comparison between the previous work and this work is given in Table 1. For the first time, we demonstrate the stretching-based geometry multiplexing method to enhance the terahertz absorption spectrum. The proposed SSP metamaterial achieves a maximum enhancement factor with greater than 270 times at the absorptance peak of the sample material. Sensors with larger enhancement ratios can detect samples with smaller volumes.
| Ref. | Cell structure | Analyte | Multiplexing mode | Operation range | Enhancement factor |
|---|---|---|---|---|---|
| 27 | Dielectric pair pillars | PMMA | Incident angle | Mid infrared | ∼50 times |
| 28 | Dielectric pair pillars | PMMA | Geometry | Mid infrared | ∼60 times |
| 15 | Dielectric metagrating | hBN | Incident angle | Mid infrared | ∼30 times |
| 13 | Dielectric metagrating | α-Lactose | Incident angle | THz | ∼20 times |
| 22 | Metal bars in mesh | α-Lactose | Geometry | THz | ∼200 times |
| This work | Au coated PDMS | α-Lactose | Geometry-stretching | THz | ∼270 times |
Conclusions
In conclusion, a method enhancing the terahertz absorption spectrum is proposed based on geometry multiplexing, which is realized by dynamically stretching the Au coated PDMS flexible substrate of the metamaterial. The SSP modes can be excited in the metamaterial microstructure, and the discrimination of trace-amount ultrathin samples is realized by boosting the envelop spectrum of a set of resonance absorptance peaks. For the 0.1 μm thick lactose film coating on the metasurface, approximately 270-fold enhanced absorptance properties can be numerically obtained in a broadband terahertz region. Moreover, the effect of the lactose thickness on the absorptance characteristics has also been studied. The designed terahertz SSP metamaterial has the great potential to prominently boost the wideband terahertz absorption spectroscopy, providing a useful method to improve the sensitivity of trance-amount analysis. In addition, the presentation of this work will effectively promote many new sensing applications.Author contributions
Dexian Yan: writing-original draft, conceptualization. Qinyin Feng: writing – review and editing. Ji Yang: software, data curation. Xiangjun Li: supervision, conceptualization, methodology. Le Zhang: writing – review and editing, and funding acquisition. Yang Zhao: software. Jining Li: software, supervision.Conflicts of interest
There are no conflicts of interest to declare.Acknowledgements
This work was supported in part by the National Key R&D Program of China (2021YFF0600300); National Natural Science Foundation of China (62001444, 62175223); Natural Science Foundation of Zhejiang Province (LQ20F010009); Fundamental Research Funds for the Provincial Universities of Zhejiang (2021YW13).Notes and references
- Y. Peng, J. Huang and J. Luo, et al. , PhotoniX, 2021, 2, 12 CrossRef.
- Y. Takida, K. Nawata and H. Minamide, Opt. Express, 2021, 29, 2529–2537 CrossRef CAS PubMed.
- A. Passarelli, T. E. Rice and M. A. Z. Chowdhury, et al. , Appl. Sci., 2022, 12, 5729 CrossRef CAS.
- C. Wang, F. Shi and M. Zhao, et al. , IEEE Sens. J., 2021, 21, 18955–18963 CAS.
- A. Kumar, M. Gupta and P. Pitchappa, et al. , Appl. Phys. Lett., 2022, 121(1), 011101 CrossRef CAS.
- T. C. W. Tan, Y. K. Srivastava and R. T. Ako, et al. , Adv. Mater., 2021, 33, 2100836 CrossRef CAS PubMed.
- M. Gupta and R. Singh, Adv. Opt. Mater., 2020, 1902025 CrossRef CAS.
- Y. K. Srivastava, L. Cong and R. Singh, Appl. Phys. Lett., 2017, 111(20), 201101 CrossRef.
- H. Amarloo and S. Safavi-Naeini, Opt. Express, 2021, 29, 17343–17352 CrossRef CAS PubMed.
- X. Shi, J. Qin and Z. Han, Opt. Express, 2017, 25, 278–283 CrossRef CAS PubMed.
- H. Amarloo, M. Neshat and S. Safavi-Naeini, Electron. Lett., 2013, 49, 836–838 CrossRef.
- X. Yan, M. Yang and Z. Zhang, et al. , Biosens. Bioelectron., 2019, 126, 485–492 CrossRef CAS PubMed.
- J. Zhu, S. Jiang, Y. Xie, F. Li, L. Du, K. Meng, L. Zhu and J. Zhou, Opt. Lett., 2020, 45, 2335–2338 CrossRef CAS PubMed.
- F. Yesilkoy, E. R. Arvelo, Y. Jahani, M. Liu, A. Tittl, V. Cevher, Y. Kivshar and H. Altug, Nat. Photonics, 2019, 13, 390–396 CrossRef CAS.
- Y. Xie, X. Liu, F. Li, J. Zhu and N. Feng, Nanophotonics, 2020, 9, 2927–2935 CrossRef CAS.
- Y. Zhong, L. Du, Q. Liu, L. Zhu, K. Meng, Y. Zou and B. Zhang, RSC Adv., 2020, 10, 33018–33025 RSC.
- S. Ding, J.-Y. Qu, L. Du, L. Zhu, S. A. Khan, H. Chen and J. Zhu, Carbon, 2021, 179, 666–676 CrossRef CAS.
- Y. Huang, S. Zhong, Y.-C. Shen, Y. Yu and D. Cui, Nanoscale, 2018, 10, 22466–22473 RSC.
- Y. Huang, S. Zhong, T. Shi, Y.-C. Shen and D. Cui, Opt. Express, 2019, 27, 34067–34078 CrossRef CAS PubMed.
- X. Chen and W. Fan, Sci. Rep., 2017, 7, 2092 CrossRef PubMed.
- S. Niknam, M. Yazdi and S. B. Amlashi, Sci. Rep., 2019, 9, 7516 CrossRef PubMed.
- X.-J. Li, C. Ma, D.-X. Yan, S.-H. Guo, L. Zhang, J. Yang, Y. Zhao and W.-D. Zhou, Opt. Lett., 2022, 47, 2446–2449 CrossRef CAS PubMed.
- R. T. Ako, A. Upadhyay, W. Withayachumnankul, M. Bhaskaran and S. Sriram, Adv. Opt. Mater., 2020, 8, 1900750 CrossRef CAS.
- D. Qi, K. Zhang and G. Tian, et al. , Adv. Mater., 2021, 33, 2003155 CrossRef CAS PubMed.
- S. Pan, Z. Liu and M. Wang, et al. , Adv. Mater., 2019, 31, 1903130 CrossRef PubMed.
- X. Shi and Z. Han, Sci. Rep., 2017, 7, 13147 CrossRef PubMed.
- A. Leitis, A. Tittl, M. Liu, B. H. Lee, M. B. Gu, Y. S. Kovshar and H. Altug, Sci. Adv., 2019, 5, 2871 CrossRef PubMed.
- A. Tittl, A. Leitis, M. Liu, F. Yesilkoy, D.-Y. Choi, D. N. Neshev, Y. S. Kivshar and H. Altug, Science, 2018, 360, 1105–1109 CrossRef CAS PubMed.
| This journal is © the Owner Societies 2023 |


