Effect of Ni atomic fraction on active species of graphene growth on Cu–Ni alloy catalysts: a density functional theory study†
Erik Bhekti
Yutomo
 ,
Fatimah Arofiati
Noor
 * and
Toto
Winata
Physics of Electronic Materials Research Division, Department of Physics, Faculty of Mathematics and Natural Sciences, Institut Teknologi Bandung, Bandung, 40132, Indonesia. E-mail: fatimah@itb.ac.id
First published on 7th December 2022
Abstract
Cu–Ni alloys are promising catalysts for precisely controlling the number of graphene layers grown by chemical vapor deposition (CVD). However, the theoretical understanding of the effect of the Ni atomic fraction on the active species, which helps determine the mechanism of graphene growth, is still limited. Here, we examine the energetics, electronic properties, and populations of potential carbon source species (CH3, CH2, CH, C) on Cu–Ni alloy catalysts with various Ni atomic fractions under various CVD growth conditions using density functional theory combined with atomistic thermodynamics. An increased Ni atomic fraction of the Cu–Ni alloy catalyst increases the d-band center and d-orbital delocalization of the Ni atoms. Therefore, the stability of the carbon source adsorbed on the surface and subsurface of the catalyst increases. Relative population analysis shows that the CH and C monomers on the surface are the active species that drive surface-mediated growth on Cu–Ni catalysts with low Ni atomic fractions. The dominance of CH and C species can be further tuned by adjusting the growth temperature and partial pressure of H2. In contrast, in a Cu–Ni catalyst with a high Ni atomic fraction, the C monomer species on the subsurface has high stability and acts as an active species that controls the cooling-induced segregation growth mechanism. This study provides an essential insight into the atomistic mechanism of graphene growth in Cu–Ni alloy catalysts.
1. Introduction
The nanostructure of carbon allotropic materials, including graphene, is intensively researched due to its superior physical properties. Graphene is a two-dimensional material composed of sp2 hybridized carbon atoms bonded to form a hexagonal lattice.1–3 Due to its unique structure, graphene has a superior combination of properties, such as high transparency of 97.7%,4 high charge carrier mobility of 16![[thin space (1/6-em)]](https://www.rsc.org/images/entities/char_2009.gif) 000 cm2 V−1 s−1,5 and high flexibility.6 With the combination of these properties, graphene is a suitable material for a transparent conductive electrode (TCE).7–13 The performance of graphene as a TCE is optimal if it has a multilayer structure (2–5 layers)8,9,11–13 because the two main factors that determine the performance of a TCE are sheet resistance and transparency, which have an inverse dependence on the number of graphene layers.8,11 Therefore, controlling the number of graphene layers is crucial to obtaining the optimum figure of merit (FoM).
000 cm2 V−1 s−1,5 and high flexibility.6 With the combination of these properties, graphene is a suitable material for a transparent conductive electrode (TCE).7–13 The performance of graphene as a TCE is optimal if it has a multilayer structure (2–5 layers)8,9,11–13 because the two main factors that determine the performance of a TCE are sheet resistance and transparency, which have an inverse dependence on the number of graphene layers.8,11 Therefore, controlling the number of graphene layers is crucial to obtaining the optimum figure of merit (FoM).
To be used as a TCE, large-scale graphene with good quality and a controlled number of layers is required. Many methods have been used to produce graphene, including mechanical and chemical exfoliation.14–19 The mechanical exfoliation method can produce high-quality graphene, but the size is limited to hundreds of micrometers,14–16 while the chemical exfoliation method produces graphene with a large number of chemical impurities.17–19 Good-quality large pieces of monolayer graphene can be obtained using the chemical vapor deposition (CVD) method using a copper catalyst.20–22 However, due to the low solubility of carbon atoms, the self-limiting growth mechanism prevents the growth of multilayer graphene on the Cu catalyst.23,24 Another conventional catalyst used for graphene growth is nickel.25,26 However, the high solubility of carbon atoms in Ni induces cooling-induction segregation growth, which tends to produce non-uniform multilayer graphene.27,28 Controlling the number of graphene layers on conventional catalysts, such as Cu and Ni, is difficult in CVD growth.
Recently, Cu–Ni alloys have received attention as catalysts for graphene growth.29–36 The Cu–Ni catalyst shows good stability because it is an amorphous binary system.29,37 Controlling the solubility of carbon atoms in the Cu–Ni catalyst can be achieved by tuning the atomic fraction of Ni.32,35,36 The Cu–Ni catalyst with a Ni atomic fraction of <10 at% (Cu90–Ni10) still has self-limiting growth behavior similar to the pure Cu catalyst.32 Increasing the Ni atomic fraction up to ∼15 at% revealed a different growth mechanism, indicated by the increased domain and graphene growth rate.32 Recent experimental studies have succeeded in growing monolayer, AB-stacked bilayer, and ABA-stacked tri-layer graphene with high uniformity when the Ni atomic fraction was tuned to 10.2 at%, 16.6 at%, and 20.3 at%, respectively.36 This progression indicates the ability of the Cu–Ni catalyst to precisely control the number of graphene layers. However, our knowledge of the graphene growth mechanism on a Cu–Ni alloy catalyst at the atomic scale remains limited, even though the resulting graphene structure is highly correlated with the growth mechanism.
The dehydrogenation of CH4 as carbon feedstock by thermal energy is an early stage in graphene growth.38–40 This process causes the formation of carbon source species, such as CHn (n = 1, 2, 3) radicals and monomeric carbon in the CVD system.41 Using density functional theory (DFT), previous studies have shown that alloying Ni atoms on a pure Cu catalyst can reduce the energy barrier to 0.58 eV at each stage of the dehydrogenation process.42,43 Another computational study has also demonstrated that the carbon monomer produced from CH4 dehydrogenation tends to diffuse to the subsurface of the alloy catalyst with the lowest energy barrier, 0.86 eV.44 Further, it has also been found that the inhomogeneous atomic structure of the Cu–Ni alloy catalyst surface can decrease the ability of carbon atoms to diffuse on the catalyst surface, lowering the nucleation density of graphene.45 Although the aforementioned computational studies have contributed to understanding the interaction between carbon source species and Cu–Ni alloy catalysts, these studies do not answer the important question: how does the Ni atomic fraction in Cu–Ni alloy catalysts affect the type of active carbon source species in graphene growth. This study is critical because the active species are highly dependent on the metal–carbon interactions and are responsible for the differences in the nucleation and growth behavior of graphene.46,47
Besides metal–carbon interactions, growth conditions such as temperature and H2 partial pressure also affect the stability of the carbon source species.21,22,24,30 Experimentally, temperature increases the growth rate.21 In addition, H2 is included during CVD growth because it has two roles: first, it controls the size and morphology of the graphene domain because of its etching reagent ability, and second, it acts as an activator for carbon that is bonded to the catalyst.20,48 Previous computational studies of the graphene growth mechanism on Cu–Ni alloy catalysts ignore the effects of temperature and H2 partial pressure on the stability and population of the carbon source species. In this study, we include the effects of temperature and H2 partial pressure on the stability of the carbon source species, represented by the Gibbs free energy of adsorption, using an ab initio atomistic thermodynamics. In addition, we estimate the relative population of each carbon source species under certain growth conditions.
Carbon source species with dominant populations can be selected as active species that determine the graphene growth mechanism. In the early stages of the study, we evaluated the energetics and electronic structures of each carbon source species adsorbed on the catalyst. We consider the variation of the Ni atomic fraction in the Cu–Ni alloy catalyst. We find that alloying Ni atoms can reduce the adsorption energy of the carbon source species, adsorbed on either the surface or the subsurface of the catalyst. Furthermore, the active species of the carbon source that determines the mechanism of graphene growth is highly dependent on the catalyst structure, growth temperature, and H2 partial pressure.
2. Computational details
2.1 Structure models
In this study, we modeled two types of catalysts: a Cu catalyst used as a reference and Cu–Ni alloy catalysts with various atomic fractions of Ni. Bulk Cu with a calculated lattice parameter of 3.638 Å was chosen as the base model. This lattice parameter of bulk Cu was consistent with the experimental observation of 3.615 Å.49 Experimentally, Cu(111) was used as a template for synthesizing Cu–Ni catalysts for growing graphene.35,36 In addition, pure Cu(111) catalyst has been widely used to grow graphene.24,50–52 The high density of surface atoms on Cu(111) induces a high carbon atom diffusion rate, promoting a high graphene growth rate.50 The Cu(111) surface also has a lattice constant similar to graphene, resulting in a low lattice mismatch. This condition causes the resulting graphene to have a low number of defects and high homogeneity.51,52 Furthermore, based on previous computational studies, the Cu(111) surface has the highest stability compared to Cu(110) and Cu(100), as indicated by the low surface energy.53 Therefore, Cu(111) was chosen as the base model for the Cu–Ni alloy catalyst. The Cu (111) catalyst, referred to as the Cu catalyst, was modeled as a four-layer (2 × 2) asymmetric periodic slab, as shown in Fig. 1(a). The Cu catalyst slabs were separated by a vacuum layer of 15 Å along the z-axis to avoid interactions between adjacent slabs, as shown in Fig. 1(b). For the geometry optimization, all atoms in the top three layers were fully relaxed, while the atoms in the lowest layer were fixed in their initial positions to mimic the bulk environment. Furthermore, various carbon source species, the CHn (n = 1, 2, 3) radicals and carbon monomers, were placed 2 Å above the catalyst system for further optimization. The molecular structures were optimized before they interacted with the catalyst system. The calculation results of the C–H bond lengths of the carbon source species are summarized in Table S1 (ESI†). We obtained reliable results compared to experimental results.54,55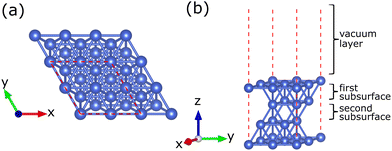 | ||
| Fig. 1 Crystal structure of the four-layer (2 × 2) surface model of the Cu catalyst (a) top view and (b) side view. The red dashed line indicates the boundaries of the unit cell. | ||
2.2 Computational methodology
The structural, energetic, and electronic properties of the adsorption of carbon source species on Cu and Cu–Ni alloy catalysts were evaluated using density functional theory (DFT), which has been implemented in the Quantum ESPRESSO package.56,57 Pseudopotentials to describe the interaction between valence electrons and ions were treated using the projected augmented wave (PAW) method.58 The generalized gradient approximation (GGA) based on the Perdew–Burke–Ernzerhof (PBE) functional was adopted to approximate the exchange–correlation interaction of the valence electrons.59 Based on the convergence test, the cut-off energy for the plane wave expansion was set at ∼816 eV. We set the k-point mesh to 5 × 5 × 1 and a self-consistency threshold of 10−6 eV to obtain sufficient accuracy and reasonable simulation time in the self-consistent field (SCF) calculations. All atomic positions in both the catalysts and the adsorbed molecules were optimized until the force on each atom was less than ∼25 meV Å−1. We considered the van der Waals (vdW) correction of DFT-D2 since it was widely reported to significantly affect the adsorption energy calculation.60,613. Results and discussion
3.1 The effect of Ni atoms on the Cu–Ni alloy catalyst
This study considers three variations of the Ni atomic fraction in the Cu–Ni alloy catalyst: 6.25 at% (Cu–Ni-1), 12.50 at% (Cu–Ni-2), and 18.75 at% (Cu–Ni-3). To model the Cu–Ni-1 catalyst, we compared the stability of the possible configurations of the Ni atom (see Fig. S1(a and b), ESI†) by calculating the doped formation energy, Ef, according to the following equation:| Ef = ECu–Ni − ECu + xμCu − yμNi | (1) |
We also used the same procedure to check the stability of two possible configurations of Ni atoms in the Cu–Ni-2 catalyst system (see Fig. S1(c and d), ESI†). The Cu–Ni-2 catalyst with two Ni atoms on different layers has the highest stability, indicated by the lowest doping formation energy. This result is in good agreement with the results obtained by He et al.44 Therefore, this model is chosen for further study. Consequently, we substitute the third Ni atom for the Cu–Ni-3 catalyst in the third layer. Furthermore, we evaluate the effect of Ni atomic fraction variations on the doping formation energy, as shown in Table 1. Increasing the Ni atomic fraction decreases the doping formation energy, indicating that the Cu–Ni catalyst can be stable at high Ni concentrations. This result is consistent with experimental data showing that the Cu–Ni catalyst can be stable even when the Ni atomic fraction is ∼20 at%.32,36
| Models | E f (eV) |
|---|---|
| Cu–Ni-1 | 0.071 |
| Cu–Ni-2 | −0.005 |
| Cu–Ni-3 | −0.092 |
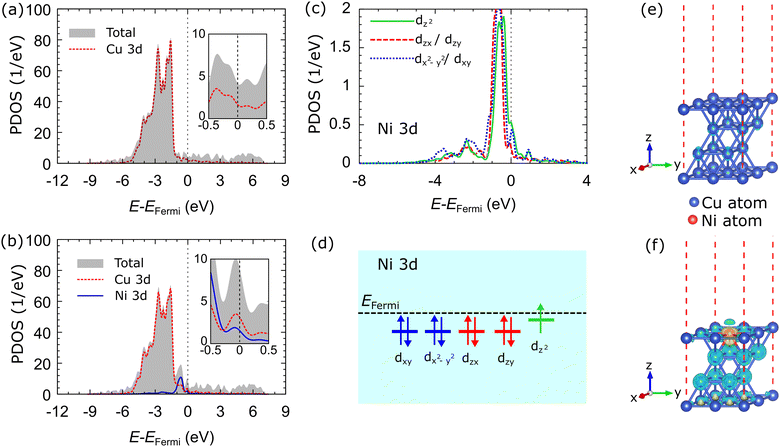
The total density of states (TDOS) and projected density of states (PDOS) of the Cu 3d-orbitals of the Cu catalyst are shown in Fig. 2(a). The Cu 3d-orbital makes the most significant contribution to the TDOS compared to the Cu 4s orbital, which is not shown in the Fig. 2(a). The characteristics of the TDOS and PDOS are consistent with the previous computational study.62Fig. 2(b) shows the TDOS and PDOS in the d-orbitals of the Cu–Ni-1 system. The TDOS of the Cu–Ni-1 catalyst is similar to that of the Cu catalyst. However, doping states emerge at the energy level of −0.647 eV, which originates from the fully occupied state in the Ni 3d-orbital. The doping state is hybridized with Cu 3d-orbital at that energy level. The TDOS intensity of the Cu–Ni-1 catalyst decreases compared to the Cu catalyst, which indicates that the electronic state of Cu 3d-orbitals becomes more delocalized due to Ni alloying. Another critical feature of the Cu–Ni-1 catalyst PDOS is the presence of a small peak near the Fermi level, as shown in the inset of Fig. 2(b). The PDOS peak corresponds to the half-filled state of the Ni 3d-orbital. The PDOS of the Cu–Ni-2 and Cu–Ni-3 catalysts have the same characteristics as the Cu–Ni-1 catalyst, as shown in Fig. S2(a and b) (ESI†), respectively.
Fig. 2(c) shows the sub-Ni 3d orbitals of the Cu–Ni-1 catalyst system. It can be seen that four fully occupied sub-Ni 3d orbitals, dxy, dzx, dzy, and dx2−y2, degenerate at the energy level of ∼−0.5 eV. The dz2 sub-orbital experienced slight orbital splitting, shifting towards the Fermi energy level. This orbital splitting is caused by lattice distortion, as we have found in our previous studies of α-PbO monolayer systems.63 Moreover, the dz2 orbital makes the most significant contribution at the small peak near the Fermi level. Thus, we ensure that the unpaired electron occupies this orbital. Fig. 2(d) shows the schematic electron configuration of the sub-Ni 3d orbitals. We also evaluated the PDOS of the sub-Ni 3d orbitals of the Cu–Ni-2 and Cu–Ni-3 systems, which have the same characteristics as the Cu–Ni-1 catalyst, as shown in Fig. S2(c and d) (ESI†), respectively.
Fig. 2(e and f) show the charge density differences of the Cu and Cu–Ni-1 catalysts. The accumulation of electrons around the Ni atom and the depletion of electrons around the Cu atom in the Cu–Ni-1 catalyst indicate the charge transfer from the Cu atom to the Ni atom. This result is supported by the Bader charge analysis,64 which shows that the Ni atom accepts electrons from the Cu atom, as shown in Table 2. Most of the electrons are donated by Cu atoms in the second and third layers of the catalyst. Charge transfer can emerge due to the hybridization of Cu 3d and Ni 3d-orbitals, as shown in the PDOS. The electrons accumulate around the Ni atom due to the slightly larger electronegativity of Ni compared to Cu (χNi = 1.91 and χCu = 1.90). Charge transfer was also observed in the other alloy catalysts (Cu–Ni-2 and Cu–Ni-3), as shown in Fig. S2(e and f) (ESI†), respectively.
| Cu | Cu–Ni-1 | Cu–Ni-2 | Cu–Ni-3 | |
|---|---|---|---|---|
| a The charge of the Cu or Ni atoms indicates the average charges of all Cuj or Nij atoms on the jth layers. b The charge of the Cu or Ni atoms indicates the average charges of the Cu or Ni atoms that are the nearest neighbor of the carbon source species. | ||||
| Clean catalysta | ||||
| Cu1 | −0.016 | −0.007 | −0.001 | −0.002 |
| Cu2 | 0.016 | 0.031 | 0.040 | 0.047 |
| Cu3 | 0.018 | 0.020 | 0.027 | 0.045 |
| Cu4 | −0.018 | −0.019 | −0.020 | −0.014 |
| Ni1 | −0.106 | −0.094 | −0.095 | |
| Ni2 | −0.050 | −0.054 | ||
| Ni3 | −0.047 | |||
| CH3 adsorptionb | ||||
| C | −0.392 | −0.222 | −0.476 | −0.493 |
| Cu | 0.104 | 0.050 | 0.125 | 0.139 |
| Ni | −0.020 | 0.047 | 0.051 | |
| CH2 adsorptionb | ||||
| C | −0.518 | −0.582 | −0.591 | −0.593 |
| Cu | 0.145 | 0.149 | 0.156 | 0.160 |
| Ni | 0.062 | 0.076 | 0.092 | |
| CH adsorptionb | ||||
| C | −0.462 | −0.546 | −0.553 | −0.618 |
| Cu | 0.147 | 0.156 | 0.158 | 0.159 |
| Ni | 0.076 | 0.076 | 0.080 | |
| Csurf adsorptionb | ||||
| C | −0.495 | −0.552 | −0.555 | −0.559 |
| Cu | 0.142 | 0.165 | 0.175 | 0.185 |
| Ni | 0.037 | 0.056 | 0.057 | |
| Csub-1 adsorptionb | ||||
| C | −0.510 | −0.837 | −0.878 | −0.883 |
| Cu | 0.136 | 0.144 | 0.144 | 0.145 |
| Ni | 0.088 | 0.093 | 0.096 | |
| Csub-2 adsorptionb | ||||
| C | −0.496 | −0.822 | −0.863 | −0.869 |
| Cu | 0.162 | 0.166 | 0.167 | 0.169 |
| Ni | 0.104 | 0.109 | ||
3.2 Adsorption of carbon source species on the catalyst surface
We evaluate the stability of the carbon source species (CH3, CH2, CH, C) on the surface of various catalyst models. The stability of the carbon source species is represented by the adsorption energy, Eads, which can be calculated based on the following equation:| Eads = Etotal − Ecat − ECHn | (2) |
The Cu catalyst surface has four possible adsorption sites, as shown in Fig. 3(a): hcp corresponds to the adsorption site directly facing the Cu atom in the second layer, fcc corresponds to the adsorption site directly facing the Cu atom in the third layer, top corresponds to the adsorption site directly facing the Cu atoms in the first layer, and bridge (bri) corresponds to the adsorption site located between the two Cu atoms in the first layer. The addition of Ni atoms to the alloy increases the number of possible adsorption sites. The surfaces of the Cu–Ni-1, CuNi-2, and Cu–Ni-3 catalysts have 8, 9, and 10 adsorption sites, respectively, as shown in Fig. 3(b–d). We refer to ref. 44 for labeling the adsorption sites on the surface of the Cu–Ni alloy catalyst. For example, the hcp3Cu–Cu site is an hcp site that directly faces a Cu atom in the second layer, and its nearest neighbors are three Cu atoms; the fcc2CuNi–Ni site is an fcc site that directly faces a Ni atom in the third layer, and its nearest neighbors are two Cu atoms and one Ni atom, the topCu site is the top site that directly faces the Cu atoms in the first layer, and the briCuNi site is the bridge site between the Cu and Ni atoms in the first layer.
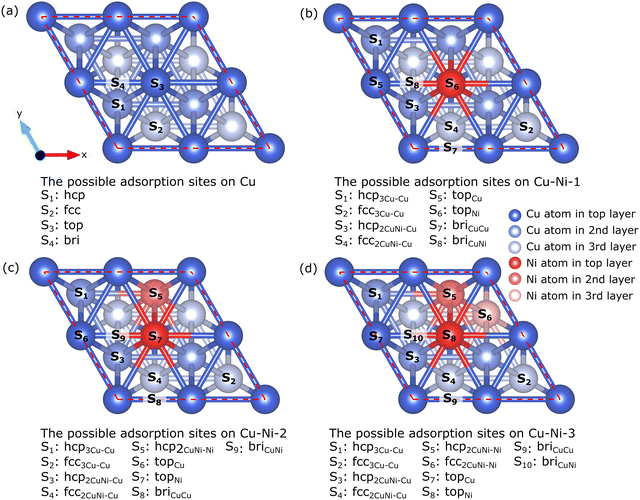 | ||
| Fig. 3 Top view of possible adsorption sites on the surface of (a) Cu, (b) Cu–Ni-1, (c) Cu–Ni-2, and (d) Cu–Ni-3 catalysts. | ||
We compare the calculated adsorption energy and equilibrium distance of the carbon source species on the Cu catalyst surface with several previous studies,62,65–67 as shown in Table S2 (ESI†). Our results are consistent with previous studies, differing slightly by 1–2%. This difference is due to the differing surface coverage of the models. Furthermore, the calculated equilibrium distance of Cu–Csurf is consistent with the experimental result obtained by the low-energy electron diffraction (LEED) characterization.67 These results indicate that our simulation parameters produce accurate data. The lowest adsorption energies for the preferred sites of the carbon source species adsorbed on the Cu catalyst surface are summarized in Fig. 4. We obtain adsorption energies below −1 eV, which indicate the radicals and carbon monomer undergo chemisorption interaction with the Cu catalyst. We also calculate the adsorption energy of CH4 on the catalyst surface (Table S2, ESI†), but the adsorption energy is high. The interaction of CH4 with the catalyst can be categorized as physisorption.68 Therefore, CH4 is unlikely to be an active species in graphene growth, so it is not considered in further calculations. Furthermore, H2O can interact with Cu or Cu–Ni alloy catalysts. Therefore, we also calculated the adsorption energy of H2O on Cu and Cu–Ni alloy catalysts. The adsorption energy of H2O on the Cu catalyst is −0.408 eV (Table S2, ESI†), which means that H2O also undergoes physisorption interactions with the Cu catalyst. The adsorption energy of H2O remains high even when Ni is alloyed (Table S3, ESI†). Thus, H2O is not a candidate for active species in graphene growth. Almost all carbon source species (CH2, CH, and C) at the fcc site have the lowest adsorption energy, while the adsorption of carbon source species at the hcp site results in the second lowest adsorption energy with a significant difference of 0.041–0.068 eV. Therefore, the fcc site is a global minimum, which means that carbon source species tend to occupy this site. This condition is supported by the relaxation results of CH2 and CH species at the bridge site, which moves to the fcc site after relaxation.
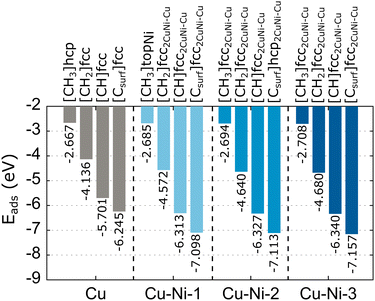 | ||
| Fig. 4 The lowest adsorption energies of the carbon source species on the Cu and Cu–Ni catalysts. We also include the preferred adsorption sites for each carbon source species. | ||
The calculated adsorption energies of the carbon source species on the Cu–Ni catalyst surface can be seen in Table S3 (ESI†). Meanwhile, The lowest adsorption energies with preferred sites are also summarized in Fig. 4. In the Cu–Ni-1 alloy catalyst, almost all the carbon source species adsorbed on the fcc2CuNi–Cu site have the minimum adsorption energy, except for CH3, which has the minimum adsorption energy at the topNi site. Some sites, such as topCu, briCuCu, and briCuNi, are less stable for the adsorption of carbon source species. We find that the carbon source species initially located at these sites move to fcc2CuNi–Cu and hcp2CuNi–Cu after the relaxation process. On the Cu–Ni-2 catalyst, the fcc2CuNi–Cu site shows the lowest adsorption energy for almost all the carbon source species, except for the Csurf species, which has the lowest adsorption energy at the hcp2CuNi–Cu site. Furthermore, on the Cu–Ni-3 catalyst, all the carbon source species adsorbed on the fcc2CuNi–Cu site have the lowest adsorption energy. Thus, the fcc2CuNi–Cu site is the global minimum for the Cu–Ni alloy catalyst modeled in this study, so carbon source species tend to occupy this site. Therefore, the Ni atom plays a crucial role as an adsorbing-atom promoter and subsequently supports experimental work in which the Ni atom is the nucleation center to control the nucleation density of graphene growth.32 Previous computational studies also found that fcc sites with Ni nearest neighbors are a global minimum, but because the number of Ni atoms in the catalyst is different, we cannot directly compare the adsorption energy with those of our study.43,44,69
Alloying Ni atoms in the Cu catalyst can lower the adsorption energy. Moreover, the adsorption energy becomes smaller as the number of Ni atoms in the alloy catalyst increases, as shown in Fig. 4. This condition indicates that the interaction strength between the carbon source species and the catalyst can be controlled by adjusting the concentration of Ni atoms in the alloy catalyst. This result is supported by the work of Arifin et al.,70 which obtained the adsorption energy for C atoms above the Ni (111) catalyst of −7.55 eV, and Che et al.,71 which obtained the adsorption energy for CH atoms above the Ni (111) catalyst of −6.53 eV. These results are acceptable because the catalyst system is composed only of Ni atoms. Neither study includes the van der Waals (vdW) interaction factor; the adsorption energy will be smaller if this interaction is included.70,71 The adsorption energy is proportional to the equilibrium distance of the carbon source species from the catalyst. The smaller the adsorption energy, the closer the equilibrium distance, as shown in Fig. S3 (ESI†). These results agree with several computational studies of the interaction of molecules with surface systems.68,72
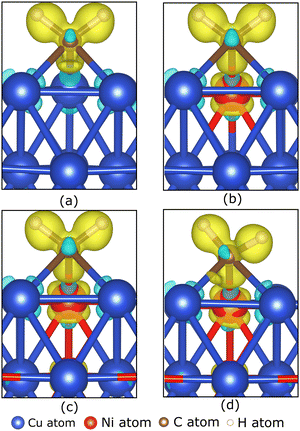
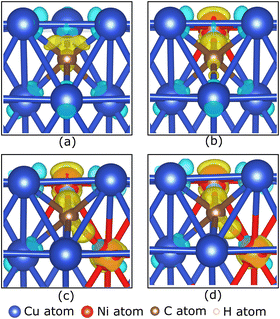
To understand the role of the Ni atom in increasing the stability of carbon source species adsorption on the Cu–Ni catalyst surface, we examine the electronic structure of the carbon source species on the preferred site. Fig. 5(a–d) show the charge density difference, which indicates that the excess charges are localized between the catalyst surface and the CH2 molecule. A slight charge accumulation is also observed around the Ni atom in the Cu–Ni catalyst. This result indicates a charge transfer from the catalyst system to the CH2 molecule. The adsorption of the other carbon source species (CH3, CH, and Csurf) shows similar behavior, in which the excess electrons are localized between the catalyst surface and the carbon source species (Fig. S4, ESI†). The Bader charge analysis also supports the above observation (Table 2), which shows that the carbon atom on the carbon source species accepts electrons from the catalyst surface. This phenomenon can be attributed to the higher electronegativity of carbon atoms compared to the metal atoms in the catalyst system (χC = 2.55). Notably, the greater the fraction of Ni atoms in the Cu–Ni alloy catalyst, the more negatively charged the C atom is, indicating that more electrons are received from the catalyst surface. This condition makes the carbon source species more stable when adsorbed on a Cu–Ni catalyst surface with a higher Ni atomic fraction. The electrons received by the carbon source species mainly come from the Ni atoms. Fig. 5(b–d) also show that the excess charge is localized on the Ni–C bond. The Ni atom redistributes the electrons donated by the nearest Cu atoms. Therefore, the Ni atom, which is negatively charged in the clean catalyst system, becomes slightly positively charged when the carbon source species are adsorbed on the catalyst surface (Table 2).
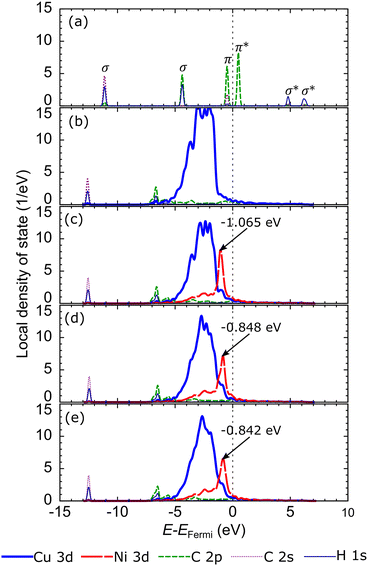
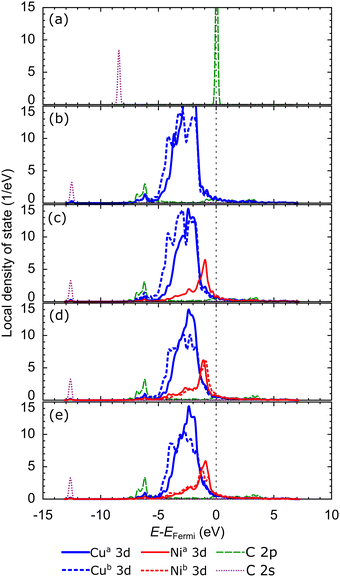
Briefly reviewing the electronic structure of the isolated carbon source species can enhance our understanding of carbon source species interaction with the d-orbitals of the metal atoms in the catalyst system. Fig. 6(a) shows the local density of states (LDOS) of the CH2 species. The carbon atom in CH2 species tends to sp2 hybridize to bond with two hydrogen atoms. Therefore, we observe the presence of two σ orbitals and one π orbital in the LDOS of CH2. The two σ orbitals are strongly polarized to the C and H atoms, representing the C–H bond, while the π orbitals are strongly polarized to the C 2p orbitals, which are the lone pair electrons on the C 2pz orbital. We also review the LDOS of other carbon source species (CH3, CH, and C), which can be seen in Fig. S5 (ESI†). In Fig. 6(b), the first σ orbital shifts to lower energy upon adsorption on the preferred site of the Cu catalyst surface. Then, the second σ orbital decreases in intensity and downshifts so that it overlaps with the shoulder of the Cu 3d-orbital. The π and π* orbitals are broadened between −5 eV and 1 eV, indicating that these electronic states are delocalized. These orbitals overlap with the Cu 3d-orbitals to form the Cu–C bonds. The σ and σ* orbitals are also broadened and delocalized in the above Fermi level but are no longer observed.
With the addition of the Ni atom in the catalyst system, Ni 3d-orbitals emerge in the energy region between −5 eV to 1 eV, overlapping with the Cu 3d and C 2p orbitals, as shown in Fig. 6(c). This condition increases the hybridization between the d-orbital of the catalyst system and the molecular orbital of CH2, and the Ni atom donates more electrons to the C atom. We also find that the d-orbitals of the Ni atom are closer to the Fermi level compared to the d-orbitals of the Cu atoms. Therefore, the d-band center of Cu–Ni alloy catalysts will be higher when compared to pure Cu catalysts. This can also explain the high catalytic activity of the Cu–Ni catalyst: the higher the d-band center, the more reactive the catalyst.73 The higher atomic fraction of Ni causes the Ni 3d-orbitals to shift to a higher energy level and induce a higher d-band center. Furthermore, increasing the number of Ni atoms decreases the intensity and broadens the Ni 3d-orbitals, yielding a more delocalized electronic state. The d-orbital delocalization of the Ni atom leads to more significant orbital hybridization between the Cu–Ni catalyst surface and adsorbed CH2. Several studies have also reported that the delocalization of d-orbitals on metal catalysts is the origin of increased catalytic activity.74,75 Therefore, the increase in the d-band center and d-orbital delocalization of Ni atoms are two mechanisms that lead to increased interactions between Cu–Ni catalysts and CH2 species when the Ni atomic fraction is increased. As shown in Fig. S5 (ESI†), these two mechanisms are also observed during the adsorption of other carbon source species (CH3, CH, and Csurf).
3.3 Adsorption of carbon monomers on the catalyst subsurface
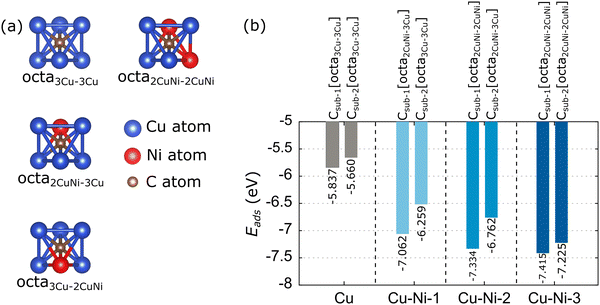
Based on experimental studies, carbon monomers can diffuse on the subsurface of the Cu–Ni alloy catalyst,32,35,36 because the Ni atoms modify the solubility of the carbon atoms. Therefore, the adsorption of carbon monomers on the subsurface of the catalyst is considered in this study. The adsorption of the carbon monomer up to the second subsurface is considered. We label the carbon monomers in the first and second subsurfaces with Csub-1 and Csub-2, respectively. The adsorption energy is also calculated using eqn (2). There are two subsurface adsorption sites: octahedral (octa) and tetrahedral, but due to the combination of atomic types, there are various configurations of adsorption sites in the Cu–Ni catalyst subsurface. However, the adsorption at the tetrahedral site is unstable and tends to migrate to the nearest octahedral site. Thus, we only consider the adsorption of carbon monomers at octahedral sites. Fig. 7(a) shows a visualization of the possible octahedral sites of the Cu and Cu–Ni catalyst subsurfaces. The site labeling is based on the nearest neighboring atoms. For example, the octa3Cu–2CuNi site indicates an octahedral site with the nearest neighbors of three Cu atoms above the subsurface and two Cu atoms and one Ni atom below the subsurface.The calculated adsorption energies of the carbon monomer at each possible octahedral site of the Cu and Cu–Ni catalyst subsurface are given in Table S4 (ESI†). The minimum adsorption energies and preferred sites are further summarized in Fig. 7(b). The Cu catalyst has one octahedral site on the first subsurface, octa3Cu–3Cu, which has an adsorption energy of −5.837 eV. This result is consistent with the work of Shu et al.,76 which gave an adsorption energy of −5.39 eV. The slight difference is because Shu et al.76 did not include the vdW correction in their calculations. The Cu catalyst also has one octa3Cu–3Cu site on its second subsurface. The Cu–Ni-1 catalyst has two octahedral sites on the first subsurface, with the octa2CuNi–3Cu site as the most stable, while the second subsurface has only one octa3Cu–3Cu site. The first subsurface on the Cu–Ni-2 catalyst has three octahedral sites, while the second subsurface has two octahedral sites. The most stable adsorption sites are octa2CuNi–2CuNi for the first subsurface and octa2CuNi–3Cu for the second subsurface. The Cu–Ni-3 catalyst has three octahedral sites on the first and second subsurfaces. The most stable adsorption sites are octa2CuNi–2CuNi for both subsurfaces. These results indicate that the presence of a Ni atom as the nearest neighbor of the related octahedral site can increase the stability of carbon monomer adsorption.
Fig. 7(b) also shows that increasing the fraction of Ni atoms in the Cu–Ni catalyst reduces the adsorption energy. This condition is predicted due to the increasing number of unoccupied states of the Ni 3d-orbitals, which can facilitate strong Ni–C bonding. This prediction is supported by the charge density difference analysis of the carbon monomer adsorption on the first subsurface of the catalyst, as shown in Fig. 8(a–d), indicating that the excess charge is more localized to the Ni–C bond than to the Cu–C bond. This condition causes the C atom to be negatively charged, as shown by the Bader charge analysis in Table 2. The carbon atom receives more electrons, and when the Ni atomic fraction in the Cu–Ni catalyst is increased, the Ni atom donates more electrons. Therefore, the Ni–C atomic bond becomes more robust, and the adsorption energy becomes more negative. The adsorption of a carbon monomer on the second subsurface also shows a charge transfer from the catalyst to the carbon atom, which agrees with the charge density difference and Bader charge analysis, as shown in Fig. S6 (ESI†) and Table 2, respectively.
Next, to clarify how the carbon monomer interacts with the catalyst at the preferred subsurface site, we review the LDOS of the isolated carbon atom, as shown in Fig. 9(a). The carbon atom has four valence electrons. Two electrons occupy the C 2s orbital, and two lone pair electrons occupy the C 2p orbitals, so the C 2p orbitals cross the Fermi level. Upon adsorption at the preferred site on the first subsurface of Cu catalyst (Fig. 8(b)), the intensity of the C 2s orbital decreases and shifts to a lower energy level. Further, the C 2p orbital decreases in intensity and downshifts so that it overlaps with the shoulders of the Cu 3d-orbitals. The C 2p orbital also broadens and overlaps with the Cu 3d-orbitals in the energy range of −5 eV to the Fermi level, indicating the presence of Cu–C bonds. The Cu 3d-orbitals of the Cu atoms above the first subsurface site are more delocalized than those below the first subsurface site due to the periodization breaking effect in the direction of the z-axis. In the Cu–Ni alloy catalyst, the Ni 3d-orbital potentially increases the d-band center because it emerges at higher energy than the Cu 3d-orbital, as shown in Fig. 9(c). In addition, this orbital facilitates strong hybridization with the C 2p orbital. The greater the fraction of Ni atoms in the Cu–Ni catalyst, the more Ni 3d-orbitals are available to form bonds between the C atoms and the catalyst system, as shown in Fig. 9(d and e). The adsorption of carbon monomers on the second subsurface also has a similar hybridization mechanism, as shown in Fig. S7 (ESI†).
The carbon monomer adsorption on the first subsurface is more stable than on the second subsurface, as shown in Fig. 7(b). Similar behavior has also been observed in the adsorption of H atoms on the subsurface of transition metal catalysts, such as Cu, Fe, and Ni.77,78 This condition is acceptable because the atoms in the first layer, which are the nearest neighbors of the first subsurface, have dangling bonds formed by breaking the periodization in the z-axis direction. These dangling bonds facilitate the adsorption of the carbon monomer on the first subsurface. This is in line with the Bader charge analysis, which shows that the carbon monomer in the first subsurface received more electrons, as shown in Table 2. In addition, the charge density difference analysis also indicates that the electron accumulation on the carbon monomer in the second subsurface was less significant (Fig. S6, ESI†). Furthermore, comparing the adsorption energy of carbon monomer species on the surface and subsurface is a critical analysis to perform. We find that the carbon monomer adsorption is more stable on the surface than on the subsurface for the Cu catalyst. This result is consistent with a previous computational study.79 Experimental results have also shown that it is difficult to diffuse a carbon monomer into the Cu catalyst because of its low carbon solubility.21,24 In addition, the Cu–Ni-1 catalyst behaves similarly to the Cu catalyst because the atomic fraction of Ni is low, but the adsorption energy difference between the surface and first subsurface is insignificant. The Cu–Ni-2 and Cu–Ni-3 catalysts behave differently from the Cu and Cu–Ni-1 catalysts: the adsorption on the subsurface is more stable than surface adsorption. From these results, the concentration of Ni atoms in the Cu–Ni alloy dramatically influences the stability of the carbon monomer adsorption.
3.4 Ab initio thermodynamics analysis
For further analysis, we examine the effect of growth parameters, that is, temperature (T) and H2 partial pressure (pH2), on the stability of the carbon source species adsorbed on either the surface or subsurface of the catalyst. The adsorption stability of carbon source species can be represented by the Gibbs free energy of adsorption (ΔGads), which can be calculated using the following equation:80,81| ΔGads = Etotal − Ecat + Fvib − nCμC − nHμH | (3) |
 | (4) |
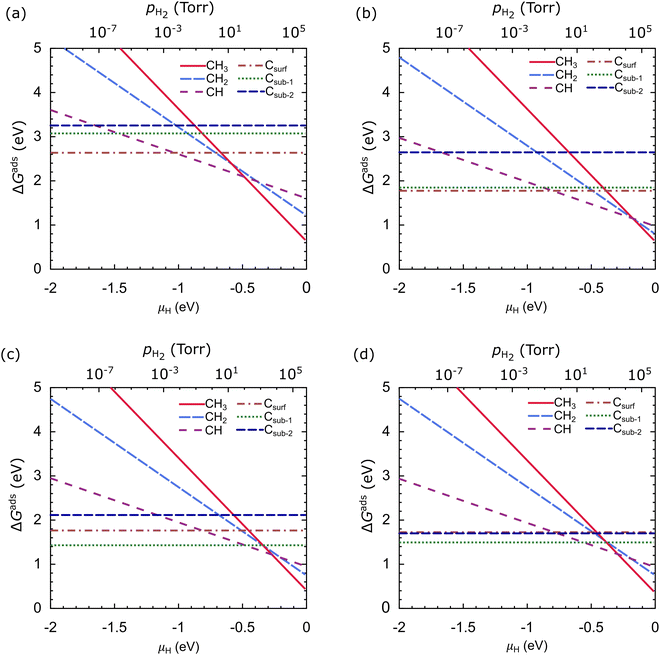
Fig. 10 shows ΔGads as a function of μH at T = 1000 °C, where μC is the calculated energy of the carbon atom in graphene, which is −18.444 Ry (−250.953 eV). In our work, ΔGads is very dependent on μH. CH3 is the most stable species on the Cu catalyst at μH > −0.48 eV, CH is the most stable species at the μH range of −1.03 eV to −0.48 eV, and Csurf is the most stable species at μH < −1.03 eV, as shown in Fig. 10(a). From these results, we suggest that the dehydrogenation process of carbon source species will be effective when the μH is lowered; this can be achieved in practice by lowering the pH2. In the Cu–Ni-1 catalyst, the stability of the carbon source species changes, but the trend remains the same as in the Cu catalyst, as shown in Fig. 10(b). CH3 is the most stable species at μH > −0.17 eV, CH is the most stable species for the μH range of −0.80 eV to −0.17 eV, and Csurf is the most stable species at μH < −0.80 eV. CH2, Csub-1, and Csub-2 are never the most stable species, but the difference in Gads between Csurf and Csub-1 is not significant.
In the Cu–Ni-2 catalyst, the stability of the carbon source species significantly changes. CH3 is the most stable species at μH >−0.27 eV, while CH becomes the most stable species only for the narrow μH range of −0.48 eV to −0.29 eV, as shown in Fig. 10(c). The significant difference is that Csub-1 becomes the most stable species at μH < −0.48 eV. The stability of the carbon source species on the Cu–Ni-3 catalyst resembles that of the Cu–Ni-2 catalyst, but the ΔGads of the Csub-2 species is close to the Csurf species, as shown in Fig. 10(d). These results indicate that besides the H2 partial pressure, the type of catalyst greatly affects the stability of the carbon source species. Adjusting the concentration of Ni atoms in the Cu–Ni catalyst can significantly change the stability of the carbon source species.
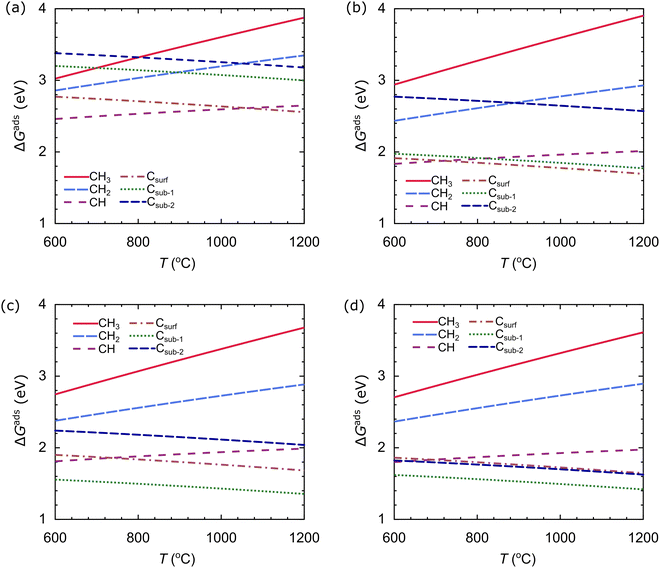
We also evaluate the stability of the carbon source species on the catalyst as a function of temperature at an H2 partial pressure of 10−2 torr, as shown in Fig. 11. We use the temperature range of 600–1200 °C. The stability of the carbon source species is strongly influenced by temperature. In the Cu catalyst, the most stable species at T < 1060 °C is CH, while the most stable species at T > 1060 °C is Csurf, as shown in Fig. 11(a). In the Cu–Ni-1 catalyst, there is a slight change: CH is the most stable species at T < 710 °C, and Csurf is the most stable species at T > 710 °C, as shown in Fig. 11(b). These results indicate that the alloying of Ni atoms can facilitate the dehydrogenation process, requiring less thermal energy. The effect of T on the stability of the carbon source species on the Cu–Ni-2 and Cu–Ni-3 catalysts is similar: Csub-1 is the most stable species in the temperature range studied, as shown in Fig. 11(c and d). These results show that the structure of the catalyst greatly affects the stability of the carbon source species.
Growth conditions, such as temperature and H2 partial pressure, affect the abundance of carbon source species in CVD. The dominant carbon source species under certain growing conditions is the active species that determine the graphene growth mechanism. To obtain the active species for each modeled catalyst, we calculate the relative population using the following equation:76
 | (5) |
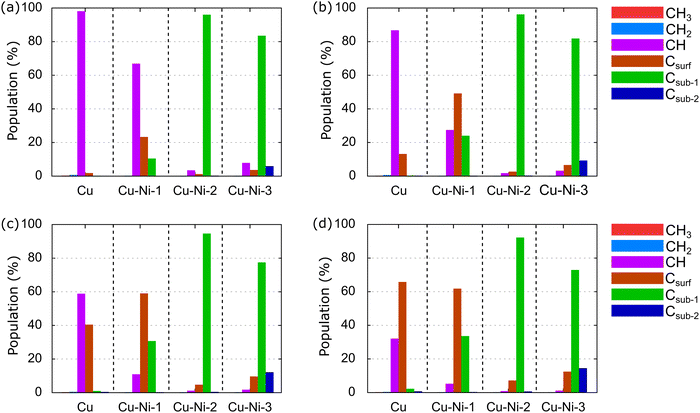
Generally, graphene growth using the CVD method is conducted in a temperature range of 600–1200 °C.21,24,36 Therefore, we calculate the relative population of carbon source species over a temperature range of 600–1200 °C and an H2 partial pressure of 10−2 torr, as shown in Fig. 12.
At T of 600 °C, the dominant species in the Cu catalyst is CH, at 97.88%, as shown in Fig. 12(a). The CH3 and CH2 populations are small because they have been dehydrogenated by thermal energy. This result is consistent with the predictions of Shu et al.76 and supports experimental results,84,85 which have shown that graphene nucleation is limited at low temperatures because the dehydrogenation process is not perfect. In the Cu–Ni-1 catalyst, CH also dominates, with a percentage of 66.69%, followed by Csurf and Csub-1, with populations of 23.08% and 10.22%, respectively. Thus, the dissociation of CH species into C monomers is faster on the Cu–Ni-1 alloy catalyst. This result is supported by a previous computational study, which found a barrier energy decrease of 0.28 eV when CH is dehydrogenated into Csurf on a Cu–Ni alloy catalyst.43,44 Csub-1 dominates the Cu–Ni-2 and Cu–Ni-3 catalysts. Moreover, Csub-2 emerges with a population of 5.68% on the Cu–Ni-3 catalyst. These results indicate that the higher Ni concentration in the Cu–Ni alloy catalyst allows the carbon monomer produced from the dehydrogenation process to diffuse more easily into the subsurface. This result is consistent with experimental observations using secondary ion mass spectrometry (SIMS) depth profile analysis that have found a tenfold increase in the C concentration inside the Cu–Ni catalyst when the Ni concentration was increased from 12.5% to 25%.45
At 800 °C, the population of Csurf on the Cu catalyst increases to 12.94%, as shown in Fig. 12(b), indicating that some CH dissociates into Csurf. On the Cu–Ni-1 catalyst, Csurf becomes dominant with a population of 48.97%, and Csub-1 increases to 23.80%, showing that the alloying of Ni atoms can accelerate the dehydrogenation rate of carbon source species. The Csub-1 species also dominates on the Cu–Ni-2 and Cu–Ni-3 catalysts. The population of Csub-2 on the Cu–Ni-3 catalyst increases to 9.01%, consistent with a previous experiment, which showed that increasing the temperature increased the solubility of the C atoms in the Cu–Ni alloy catalyst.32,36 A further increase in temperature to 1000 °C causes the population of Csurf on Cu catalysts to increase to 40.22%, but CH still dominates, as shown in Fig. 12(c). On the Cu–Ni-1 catalyst, the populations of Csurf and Csub-1 continue to increase to 58.54% and 30.46%, respectively. Csub-1 continues to dominate the Cu–Ni-2 and Cu–Ni-3 catalysts. The population of the Csub-2 species on the Cu–Ni-3 catalyst continues to increase to 11.87%. At 1200 °C, the population of Csurf on the Cu catalyst increases to 61.58%, as shown in Fig. 12(d). Csurf is the dominant species on Cu and Cu–Ni-1 catalysts. A large number of C monomers on the catalyst supports the rapid growth of monolayer graphene, as reported by previous experimental studies.23,86 Furthermore, Csub-1 dominates on the Cu–Ni-2 and Cu–Ni-3 catalysts. The population of the Csub-2 species also continues to increase.
The above analysis shows that CH and Csurf are two competing dominant species on the Cu catalyst. Therefore, CH and Csurf are active species that play a role in determining the graphene growth mechanism. Several previous computational studies have also predicted CH as an active species.65,87,88 Using the first principle molecular dynamics (FPMD) study, two CH have been observed to bind and form C2H2 at a temperature of ∼1000 °C.65 The C2H2 structure is an important intermediate in forming a hexagonal graphene ring. Then, the behavior of the carbon source species on the Cu–Ni-1 catalyst resembles that on the Cu catalyst, where CH and Csurf compete to be the dominant species. Although the Csub-1 species is abundant, it never dominates. Therefore, we predict only CH and Csurf as active species on the Cu–Ni-1 catalyst. Csub-1 is an active species on the Cu–Ni-2 and Cu–Ni-3 catalysts because it is dominant at all temperatures. These results support the experimental observations by Wu et al.,32 which have shown that Cu–Ni catalysts with different Ni concentrations behave differently. The Cu90–Ni10 catalyst behaves like a pure Cu catalyst, facilitating a surface-mediated growth mechanism, while the growth mechanism of the Cu15–Ni85 and Cu80–Ni20 catalysts is dominated by cooling-induced segregation.32 In this study, the Cu–Ni-1, Cu–Ni-2, and Cu–Ni-3 catalyst models mimic the Cu90–Ni10, Cu85–Ni15, and Cu80–Ni20 catalysts, respectively. The growth mechanism greatly affects the structure of the resulting graphene. A surface-mediated growth mechanism produces monolayer graphene, while cooling-induced segregation produces multilayer graphene.35,36
H2 partial pressure is an essential parameter in graphene growth using the CVD method. We calculated the dependence of the carbon source species population on the pH2 at the optimum growth temperature, T = 1000 °C, as shown in Fig. 13. The pH2 and the type of catalyst significantly affect the population of the carbon source species. Only CH and Csurf species experience significant changes in the population on the Cu catalyst when pH2 changes, as shown in Fig. 13(a). For example, at a pH2 of 10−3 torr, Csurf dominates with a population of 78.06%, while the CH is 20.21%. When the pH2 increases to 101 torr, the CH and Csurf populations become 72.83% and 1.19%, respectively. Similar conditions are observed in Cu–Ni-1, where Csurf dominates at low pH2, and CH dominates at high pH2, as shown in Fig. 13(b).
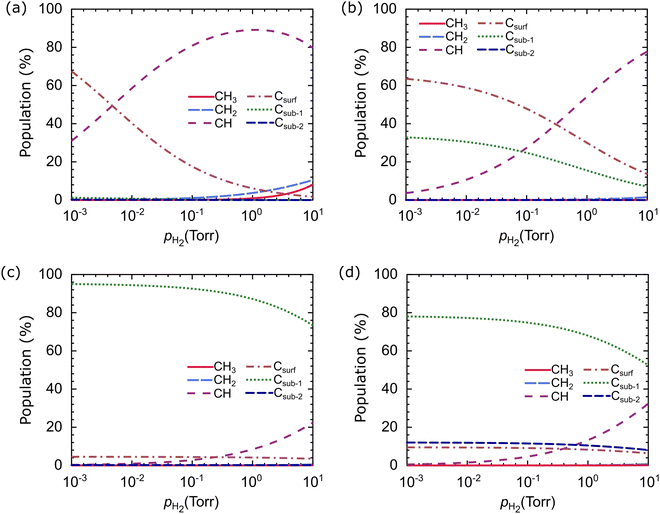 | ||
| Fig. 13 Relative populations of carbon source species on the (a) Cu, (b) Cu–Ni-1, (c) Cu–Ni-2, and (d) Cu–Ni-3 catalysts as a function of H2 partial pressure. The temperature is set at 1000 °C. | ||
In the Cu–Ni-2 and Cu–Ni-3 catalysts, different behavior is obtained in which the Csub-1 species dominates over the pH2 range studied, as shown in Fig. 13(c and d). These results support the previous analysis, which predicts that CH and Csurf are active species on Cu and Cu–Ni-1 catalysts while Csub-1 is the active species on the Cu–Ni-2 and Cu–Ni-3 catalysts. Different active species will induce different growth mechanisms. Therefore, the H2 partial pressure has a crucial role in controlling the graphene growth mechanism and the structure of the resulting graphene. This result is consistent with experimental observations, which show that H2 partial pressure can control the size of graphene domains and determine whether the graphene morphology is irregular or hexagonal.20,22
4. Conclusions
The energetics, electronic properties, and population under various CVD growth conditions of carbon source species (CH3, CH2, CH, C) adsorbed on the surface or subsurface of Cu–Ni alloy catalysts with various Ni atomic fractions have been studied using density functional theory combined with thermodynamic atomistic. The Cu–Ni alloy catalyst provides half-filled electronic states in the d-orbitals, which are essential for catalytic activity. This is in line with the adsorption energy analysis, which finds that the alloying Ni atoms can reduce the adsorption energy of carbon source species adsorbed on the surface or the subsurface of the catalyst. The increase of the d-band center and d-orbital delocalization of Ni atoms are two mechanisms that improve interactions between Cu–Ni catalysts and carbon source species when the Ni atomic fraction is increased. In addition, Ni is an adsorbing-atom promoter because it always becomes the nearest neighbor of the preferred sites.From ab initio atomistic thermodynamics, the adsorption of a carbon monomer on the subsurface of the catalyst can be stable when the fraction of Ni atoms in the Cu–Ni alloy catalyst is high. This condition causes the relative population of the carbon source species to be highly dependent on the structure of the catalyst. CH and C monomers on the catalyst surface compete to be the dominant species on pure Cu and Cu–Ni-1 (6.25 at% of Ni atoms) catalysts. Therefore, CH and C monomers on the surface are active species of the Cu and Cu–Ni catalysts with low Ni atomic fractions, whose population can be further tuned by adjusting the temperature and H2 partial pressure. In contrast, the C monomer on the sub-surface of the catalyst is the active species in the Cu–Ni alloy catalysts with a Ni atomic fraction greater than 12.5 at%. Based on these results, we can explain experimental observations that show the surface-mediated growth mechanism on Cu–Ni catalysts with low Ni atomic fractions that produces graphene monolayers and the cooling-induced segregation growth mechanism on Cu–Ni catalysts with high Ni atomic fractions that produces multilayer graphene. This study improves the understanding of graphene growth mechanisms on a Cu–Ni alloy catalyst and the possibility of controlling the number of graphene layers.
Author contributions
E. B. Y., F. A. N., and T. W. designed and conceived the study. E. B. Y. conducted the simulation, analyzed the data and wrote the initial paper. F. A. N. and T. W. revised the paper, wrote proposal and acquired project funding. All authors confirmed the final manuscript.Conflicts of interest
There are no conflicts to declare.Acknowledgements
This research was supported by “Penelitian, Pengabdian kepada Masyarakat, dan Inovasi (PPMI)” and “Program Magister-Doktor untuk Sarjana Unggul (PMDSU)” research grants in the fiscal year 2022.References
- K. S. Novoselov, S. V. Morozov, T. M. G. Mohinddin, L. A. Ponomarenko, D. C. Elias, R. Yang, I. I. Barbolina, P. Blake, T. J. Booth, D. Jiang, J. Giesbers, E. W. Hill and A. K. Geim, Phys. Status Solidi, 2007, 244, 4106–4111, DOI:10.1002/pssb.200776208.
- K. S. Novoselov, E. McCann, S. V. Morozov, V. I. Fal’ko, M. I. Katsnelson, U. Zeitler, D. Jiang, F. Schedin and A. K. Geim, Nat. Phys., 2006, 2, 177–180, DOI:10.1038/nphys245.
- E. B. Yutomo, F. A. Noor and T. Winata, RSC Adv., 2021, 11, 18371–18380, 10.1039/D1RA01095F.
- F. Liu, X. Qiu, J. Xu, J. Huang, D. Chen and G. Chen, Prog. Org. Coat., 2019, 133, 125–130, DOI:10.1016/j.porgcoat.2019.04.043.
- J. Wang, R. Zhao, M. Yang, Z. Liu and Z. Liu, J. Chem. Phys., 2013, 138, 084701, DOI:10.1063/1.4792142.
- D. G. Papageorgiou, I. A. Kinloch and R. J. Young, Prog. Mater. Sci., 2017, 90, 75–127, DOI:10.1016/j.pmatsci.2017.07.004.
- J. H. Heo, D. H. Shin, S. Kim, M. H. Jang, M. H. Lee, S. W. Seo, S. H. Choi and S. H. Im, Chem. Eng. J., 2017, 323, 153–159, DOI:10.1016/j.cej.2017.04.097.
- L. Lancellotti, E. Bobeico, M. D. Noce, L. V. Mercaldo, I. Usatii, P. D. Veneri, G. V. Bianco, A. Sacchetti and G. Bruno, Appl. Surf. Sci., 2020, 525, 146443, DOI:10.1016/j.apsusc.2020.146443.
- G. V. Bianco, A. Sacchetti, A. Milellaa, M. Grande, A. D’Orazio, P. Capezzuto and G. Bruno, Carbon, 2020, 170, 75–84, DOI:10.1016/j.carbon.2020.07.038.
- A. Altuntepe, A. Seyhan and R. Zan, J. Mol. Struct., 2020, 1200, 127055, DOI:10.1016/j.molstruc.2019.127055.
- J. H. Kang, S. Choi, Y. J. Park, J. S. Park, N. S. Cho, S. Cho, B. Walker, D. S. Choi, J. W. Shin and J. H. Seo, Carbon, 2021, 171, 341–349, DOI:10.1016/j.carbon.2020.08.055.
- A. G. Ricciardulli, S. Yang, G. J. A. H. Wetzelaer, X. Feng and P. W. M. Blom, Adv. Funct. Mater., 2018, 28, 1–6, DOI:10.1002/adfm.201706010.
- Y. M. Seo, W. Jang, T. Gu and D. Whang, Materials, 2020, 13, 2166, DOI:10.3390/ma13092166.
- Y. Huang, E. Sutter, N. N. Shi, J. Zheng, T. Yang, D. Englund, H. J. Gao and P. Sutter, ACS Nano, 2015, 9, 10612–10620, DOI:10.1021/acsnano.5b04258.
- J. B. Oostinga, H. B. Heersche, X. Liu, A. F. Morpurgo and L. M. K. Vandersypen, Nat. Mater., 2007, 7, 151–157, DOI:10.1038/nmat2082.
- K. S. Novoselova, A. K. Geim, S. V. Morozov, D. Jiang, T. Zhang, S. V. Dubonos, I. V. Grigorieva and A. A. Firsov, Science, 2004, 306, 666–669, DOI:10.1126/science.1102896.
- M. Liu, X. Zhang, W. Wu, T. Liu, Y. Liu, B. Guo and R. Zhang, Chem. Eng. J., 2019, 355, 181–185, DOI:10.1016/j.cej.2018.08.146.
- H. Saleem, M. Haneef and H. Y. Abbasi, Mater. Chem. Phys., 2018, 204, 1–7, DOI:10.1016/j.matchemphys.2017.10.020.
- D. Ristiani, R. Asih, N. S. Puspitasari, M. A. Baqiya, R. Risdiana, M. Kato, Y. Koike, S. Yamaguchi, Y. Furukawa and D. Darminto, IEEE Trans. Magn., 2020, 56, 1–6, DOI:10.1109/TMAG.2020.2994175.
- D. H. Jung, C. Kang, M. Kim, H. Cheong, H. Lee and J. S. Lee, J. Phys. Chem. C, 2014, 118, 3574–3580, DOI:10.1021/jp410961m.
- S. Chaitoglou and E. Bertran, J. Mater. Sci., 2017, 52, 8348–8356, DOI:10.1007/s10853-017-1054-1.
- S. Chaitoglou and E. Bertran, Mater. Res. Express, 2016, 3, 075603, DOI:10.1088/2053-1591/3/7/075603.
- H. Zhou, W. J. Yu, L. Liu, R. Cheng, Y. Chen, X. Huang, Y. Liu, Y. Wang, Y. Huang and X. Duan, Nat. Commun., 2013, 4, 1–8, DOI:10.1038/ncomms3096.
- I. Sharma, G. S. Papanai, S. J. Paul and B. K. Gupta, ACS Omega, 2020, 5, 22109–22118, DOI:10.1021/acsomega.0c02132.
- J. Lahiri, T. Miller, L. Adamska, I. I. Oleynik and M. Batzill, Nano Lett., 2011, 11, 518–522, DOI:10.1021/nl103383b.
- L. L. Patera, F. Bianchini, C. Africh, C. Dri, G. Soldano, M. M. Mariscal, M. Peressi and G. Comelli, Science, 2018, 359, 1243–1246, DOI:10.1126/science.aan8782.
- A. Niilisk, J. Kozlova, H. Alles, J. Aarik and V. Sammelselg, Carbon, 2016, 98, 658–665, DOI:10.1016/j.carbon.2015.11.050.
- H. Murata, K. Toko, N. Saitoh, N. Yoshizawa and T. Suemasu, Appl. Phys. Lett., 2017, 110, 033108, DOI:10.1063/1.4974318.
- S. Chen, W. Cai, R. D. Piner, J. W. Suk, Y. Wu, Y. Ren, J. Kang and R. S. Ruoff, Nano Lett., 2011, 11, 3519–3525, DOI:10.1021/nl201699j.
- Y. Wu, H. Chou, H. Ji, Q. Wu, S. Chen, W. Jiang, Y. Hao, J. Kang, Y. Ren, R. D. Piner and R. S. Ruoff, ACS Nano, 2012, 6, 7731–7738, DOI:10.1021/nn301689m.
- W. Liu, S. Kraemer, D. Sarkar, H. Li, P. M. Ajayan and K. Banerjee, Chem. Mater., 2014, 26, 907–915, DOI:10.1021/cm4021854.
- T. Wu, X. Zhang, Q. Yuan, J. Xue, G. Lu, Z. Liu, H. Wang, H. Wang, F. Ding, Q. Yu, X. Xie and M. Jiang, Nat. Mater., 2015, 15, 43–47, DOI:10.1038/nmat4477.
- C. Yang, T. Wu, H. Wang, G. Zhang, J. Sun, G. Lu, T. Niu, A. Li, X. Xie and M. Jiang, Small, 2016, 12, 2009–2013, DOI:10.1002/smll.201670074.
- Y. Takesaki, K. Kawahara, H. Hibino, S. Okada, M. Tsuji and H. Ago, Chem. Mater., 2016, 28, 4583–4592, DOI:10.1021/acs.chemmater.6b01137.
- M. Huang, M. Biswal, H. J. Park, S. Jin, D. Qu, S. Hong, Z. Zhu, L. Qiu, D. Luo, X. Liu, Z. Yang, Z. Liu, Y. Huang, H. Lim, W. J. Yoo, F. Ding, Y. Wang, Z. Lee and R. S. Ruoff, ACS Nano, 2018, 12, 6117–6127, DOI:10.1021/acsnano.8b02444.
- M. Huang, P. V. Bakharev, Z. J. Wang, M. Biswal, Z. Yang, S. Jin, B. Wang, H. J. Park, Y. Li, D. Qu, Y. Kwon, X. Chen, S. H. Lee, M. G. Willinger, W. J. Yoo, Z. Lee and R. S. Ruoff, Nat. Nanotechnol., 2020, 15, 289–295, DOI:10.1038/s41565-019-0622-8.
- Y. Wu, H. Chou, H. Ji, Q. Wu, S. Chen, W. Jiang, Y. Hao, J. Kang, Y. Ren, R. D. Piner and R. S. Ruoff, ACS Nano, 2012, 6, 7731–7738, DOI:10.1021/nn301689m.
- X. Zhang, L. Wang, J. Xin, B. I. Yakobson and F. Ding, J. Am. Chem. Soc., 2014, 136, 3040–3047, DOI:10.1021/ja405499x.
- X. Zhang, H. Li, F. Ding, X. Y. Zhang, H. Li and F. Ding, Adv. Mater., 2014, 26, 5488–5495, DOI:10.1002/adma.201305922.
- J. Zhao, M. Shaygan, J. Eckert, M. Meyyappan and M. H. Rümmeli, Nano Lett., 2014, 14, 3064–3071, DOI:10.1021/nl501039c.
- Z. Li, P. Wu, C. Wang, X. Fan, W. Zhang, X. Zhai, C. Zeng, Z. Li, J. Yang and J. Hou, ACS Nano, 2011, 5, 3385–3390, DOI:10.1021/nn200854p.
- H. Liu, R. Zhang, R. Yan, J. Li, B. Wang and K. Xie, Appl. Surf. Sci., 2012, 258, 8177–8184, DOI:10.1016/j.apsusc.2012.05.017.
- A. Omran, S. H. Yoon, M. Khan, M. Ghouri and A. Chatla, Catalysts, 2020, 1, 1043, DOI:10.3390/catal10091043.
- F. He, K. Li, G. Xie, Y. Wang, M. Jiao, H. Tang and Z. Wua, Appl. Catal., A, 2015, 506, 1–7, DOI:10.1016/j.apcata.2015.08.033.
- Y. Liu, T. Wu, Y. Yin, X. Zhang, Q. Yu, D. J. Searles, F. Ding, Q. Yuan and X. Xie, Adv. Sci., 2018, 5, 1700961, DOI:10.1002/advs.201700961.
- P. Wu, X. Zhai, Z. Li and J. Yang, J. Phys. Chem. C, 2014, 118, 6201–6206, DOI:10.1021/jp4108156.
- Z. Li, W. Zhang, X. Fan, P. Wu, C. Zeng, Z. Li, X. Zhai, J. Yang and J. Hou, J. Phys. Chem. C, 2012, 116, 10557–10562, DOI:10.1021/jp210814j.
- I. Vlassiouk, M. Regmi, P. Fulvio, S. Dai, P. Datskos, G. Eres and S. Smirnov, ACS Nano, 2011, 5, 6069–6076, DOI:10.1021/nn201978y.
- M. E. Straumanis and L. S. Yu, Acta Crystallogr., Sect. A: Cryst. Phys., Diffr., Theor. Gen. Crystallogr., 1969, 25, 676–682, DOI:10.1107/S0567739469001549.
- J. D. Wood, S. W. Schmucker, A. S. Lyons, E. Pop and J. W. Lyding, Nano Lett., 2011, 11, 4547–4554, DOI:10.1021/nl201566c.
- H. K. Yu, K. Balasubramanian, K. Kim, J. L. Lee, M. Maiti, C. Ropers, J. Krieg, K. Kern and A. M. Wodtke, ACS Nano, 2014, 8, 8636–8643, DOI:10.1021/nn503476j.
- K. Lee and J. Ye, Carbon, 2016, 100, 441–449, DOI:10.1016/j.carbon.2016.01.032.
- Z. X. Chen, K. M. Neyman, A. B. Gordienko and N. Rosch, Phys. Rev. B: Condens. Matter Mater. Phys., 2003, 68, 075417, DOI:10.1103/PhysRevB.68.075417.
- K. K. Irikura and D. J. Frurip, Computational Thermochemistry, 1998, 677 Search PubMed.
- K. Kuchitsu and G. Graner, Structure of free polyatomic molecules: basic data, 1998, 214 Search PubMed.
- P. Giannozzil, S. Baroni, N. Bonini, M. Calandra, R. Car, C. Cavazzoni, D. Ceresoli, G. L. Chiarotti, M. Cococcioni, I. Dabo, A. D. Corso, S. D. Gironcoli, S. Fabris, G. Frestesi, R. Gebauer, U. Gerstmann, C. Gougoussis, A. Kokalj, M. Lazzeri, L. Martin-Samos, N. Marzani, F. Mauri, R. Mazzarello, S. Paolini, A. Pasquarello, L. Paulatto, C. Sbraccia, S. Scandolo, G. Sclauzero, A. P. Seitsonen, A. Smogunov, P. Umari and R. M. Wentzcovitch, J. Phys.: Condens. Matter, 2009, 21, 395502, DOI:10.1088/0953-8984/21/39/395502.
- P. Giannozzi, O. Andreussi, T. Brumme, O. Bunau, M. B. Nardelli, M. Calandra, R. Car, C. Cavazzoni, D. Ceresoli and M. Cococcioni, J. Phys.: Condens. Matter, 2017, 29, 465901, DOI:10.1088/1361-648X/aa8f79.
- P. E. Blöchl, Phys. Rev. B: Condens. Matter Mater. Phys., 1994, 50, 17953, DOI:10.1103/PhysRevB.50.17953.
- J. P. Perdew, K. Burke and M. Ernzerhof, Phys. Rev. Lett., 1996, 77, 3865–3868, DOI:10.1103/PhysRevLett.77.3865.
- S. Grimme, J. Comput. Chem., 2006, 27, 1787–1799, DOI:10.1002/jcc.20495.
- V. Barone, M. Casarin, D. Forrer, M. Pavone, M. Sambi and A. Vittadini, J. Comput. Chem., 2009, 30, 934–939, DOI:10.1002/JCC.21112.
- X. Pang, J. Yang, M. Pang and Y. Zhao, J. Alloys Compd., 2020, 831, 154747, DOI:10.1016/j.jallcom.2020.154747.
- E. B. Yutomo, F. A. Noor and T. Winata, Micro Nanostruct., 2022, 163, 107125, DOI:10.1016/j.spmi.2021.107125.
- W. Tang, E. Sanville and G. Henkelman, J. Phys.: Condens. Matter, 2009, 21, 084204, DOI:10.1088/0953-8984/21/8/084204.
- Y. He, H. Wang, S. Jiang and Y. Mo, Comput. Mater. Sci., 2019, 168, 17–24, DOI:10.1016/J.COMMATSCI.2019.05.046.
- K. Li, C. He, M. Jiao, Y. Wang and Z. Wu, Carbon, 2014, 74, 255–265, DOI:10.1016/J.CARBON.2014.03.030.
- W. W. Pai, H. T. Jeng, C. M. Cheng, C. H. Lin, X. Xiao, A. Zhao, X. Zhang, G. Xu, X. Q. Shi, M. A. V. Hove, C. S. Hsue and K. D. Tsuei, Phys. Rev. Lett., 2010, 104, 036103, DOI:10.1103/PhysRevLett.104.036103.
- D. Bahamon, M. Khalil, A. Belabbes, Y. Alwahedi, L. F. Vega and K. Polychronopoulou, RSC Adv., 2021, 11, 2947–2957, 10.1039/C9RA10634K.
- H. Liu, R. Zhang, R. Yan, J. Li, B. Wang and K. Xie, Appl. Surf. Sci., 2012, 258, 8177–8184, DOI:10.1016/j.apsusc.2012.05.017.
- R. Arifin, Y. Shibuta, K. Shimamura and F. Shimojo, Eur. Phys. J. B, 2015, 88, 1–9, DOI:10.1140/epjb/e2015-60557-7.
- F. Che, R. Zhang, A. J. Hensley, S. Ha and J. S. Mcewen, Phys. Chem. Chem. Phys., 2014, 16, 2399–2410, 10.1039/C3CP54135E.
- G. Hu, Q. Tang and D. E. Jiang, Phys. Chem. Chem. Phys., 2016, 18, 23864–23871, 10.1039/C6CP04011J.
- M. Asadi, B. Kumar, A. Behranginia, B. A. Rosen, A. Baskin, N. Repnin, D. Pisasale, P. Phillips, W. Zhu, R. Haasch, R. F. Klie, P. Král, J. Abiade and A. S. Khojin, Nat. Commun., 2014, 5, 1–8, DOI:10.1038/ncomms5470.
- S. He, F. Ni, Y. Ji, L. Wang, Y. Wen, H. Bai, G. Liu, Y. Zhang, Y. Li, B. Zhang and H. Peng, Angew. Chem., Int. Ed., 2018, 57, 16114–16119, DOI:10.1002/ANIE.201810538.
- D. Gao, H. Zhou, J. Wang, S. Miao, F. Yang, G. Wang, J. Wang and X. Bao, J. Am. Chem. Soc., 2015, 137, 4288–4291, DOI:10.1021/jacs.5b00046.
- H. Shu, X. M. Tao and F. Ding, Nanoscale, 2015, 7, 1627–1634, 10.1039/C4NR05590J.
- F. Silveri, M. G. Quesne, A. Roldan, N. H. De Leeuw and C. R. A. Catlow, Phys. Chem. Chem. Phys., 2019, 21, 5335–5343, 10.1039/C8CP05975F.
- P. Ferrin, S. Kandoi, A. U. Nilekar and M. Mavrikakis, Surf. Sci., 2012, 606, 679–689, DOI:10.1016/J.SUSC.2011.12.017.
- W. Chen, P. Cui, W. Zhu, E. Kaxiras, Y. Gao and Z. Zhang, Phys. Rev. B: Condens. Matter Mater. Phys., 2015, 91, 045408, DOI:10.1103/PhysRevB.91.045408.
- K. Reuter and M. Scheffler, Phys. Rev. B: Condens. Matter Mater. Phys., 2002, 65, 1–11, DOI:10.1103/PhysRevB.65.035406.
- C. G. Van de Walle and J. Neugebauer, Phys. Rev. Lett., 2002, 88, 4, DOI:10.1103/PhysRevLett.88.066103.
- Y. Kangawa, T. Ito, A. Taguchi, K. Shiraishi and T. Ohachi, Surf. Sci., 2001, 493, 178–181, DOI:10.1016/S0039-6028(01)01210-9.
- Y. Kangawa, T. Akiyama, T. Ito, K. Shiraishi and T. Nakayama, Materials, 2013, 6, 3309–3360, DOI:10.3390/MA6083309.
- M. Zhu, Z. Du, Z. Yin, W. Zhou, Z. Liu, S. H. Tsang and E. H. T. Teo, ACS Appl. Mater. Interfaces, 2016, 8, 502–510, DOI:10.1021/acsami.5b09453.
- S. Chugh, R. Mehta, N. Lu, F. D. Dios, M. J. Kim and Z. Chen, Carbon, 2015, 93, 393–399, DOI:10.1016/J.CARBON.2015.05.035.
- X. Li, C. W. Magnuson, A. Venugopal, R. M. Tromp, J. B. Hannon, E. M. Vogel, L. Colombo and R. S. Ruoff, J. Am. Chem. Soc., 2011, 133, 2816–2819, DOI:10.1021/ja109793s.
- W. Zhang, P. Wu, Z. Li and J. Yang, J. Phys. Chem. C, 2011, 115, 17782–17787, DOI:10.1021/jp2006827.
- P. Wu, W. Zhang, Z. Li, J. Yang and J. G. Hou, J. Chem. Phys., 2010, 133, 071101, DOI:10.1063/1.3473045.
Footnote |
| † Electronic supplementary information (ESI) available. See DOI: https://doi.org/10.1039/d2cp04621k |
| This journal is © the Owner Societies 2023 |

