Size-dependent photoinduced transparency in colloidal CdTe quantum dots in the strong confinement regime: an inverse linear relationship
Carlos H. D.
Dos Santos
ab,
Diego L.
Ferreira
a,
Leandro H.
Zucolotto Cocca
 b,
Rafael S.
Mourão
c,
Marco A.
Schiavon
 c,
Cleber R.
Mendonça
b,
Leonardo
De Boni
 *b and
Marcelo G.
Vivas
 *a
*a
aLaboratório de Espectroscopia Óptica e Fotônica, Universidade Federal de Alfenas, Poços de Caldas, MG, Brazil. E-mail: mavivas82@gmail.com
bInstituto de Física de São Carlos, Universidade de São Paulo, Caixa Postal 369, 13560-970 São Carlos, SP, Brazil. E-mail: deboni@ifsc.usp.br
cGrupo de Pesquisa em Química de Materiais, Universidade Federal de São João del-Rei, São João del-Rei, MG, Brazil
First published on 1st December 2022
Abstract
Nanomaterials have been investigated as saturable absorbers for ultrafast lasers because of their large photoinduced transparency related to ground-state bleaching. However, the quantum dot size effect on the photoinduced transparency in the strong confinement regime has not been explored due to the challenge of accurately measuring the ground state and the excited-state absorption cross-sections. At the same time, these optical properties are essential to calculate several chemical and physical quantities at the nanoscale. In this context, we have employed the photoluminescence saturation method to determine the ground-state absorption cross-section and the femtosecond open-aperture Z-scan technique to investigate the size-dependent ground-state bleaching of glutathione-capped CdTe QDs synthesized in an aqueous medium. The results were modeled using rate equations within the three-energy levels approach. Our results pointed out that the photoinduced transparency rate at the 1S3/2(h) → 1S(e) transition peak presents an inverse linear relationship with the QD diameter (from 2.2 nm up to 3 nm). Otherwise, the larger QDs have a higher ground-state cross-section, which is directly proportional to the ground-state bleaching. To explain this apparent contradiction, we calculate the effective absorption coefficient αeff = σ/V (σ is the absorption cross section and V is the QD volume) for the QDs and observed that the smaller QDs have a higher absorption from the ground to the first excited state, corroborating our results. Finally, our results showed that the saturable absorption effect in CdTe-QDs is slightly higher than that obtained for graphene and other 2D materials and smaller than the black phosphorus in the visible region.
I. Introduction
Nanomaterials have emerged in the last few decades as a multidisciplinary and disruptive research field, both from the point of view of basic science and technological applications. Within the plethora of extensively investigated nanoscale materials, semiconductor nanocrystals with radii smaller than the bulk exciton Bohr radius (called quantum dots – QDs) exhibit enhanced size-dependent optical properties that deviate substantially from those of bulk crystals, as a consequence of the reduced finite spatial dimensions and the characteristic excitonic confinement effect. For example, QDs present high linear, excited state and two-photon absorption, large nonlinear refractive index, bright fluorescence quantum yield, and large exciton binding energy, to cite a few.1–14 Due to these remarkable features, QDs have been used in many applications spanning from biology to quantum information.15–22The interaction between the intense electromagnetic field delivered from the ultrashort laser pulses with matter is an interesting research topic because it allows us to modulate the optical properties of materials through laser intensity. For example, the material absorption coefficient (α) can decrease or increase depending on the excited-state dynamics at the resonant regime. When the excited-state absorption is higher than the ground-state one, α increases with the laser irradiance, which is called reverse saturable absorption (RSA). Such an effect is closely related to developing all-optical technologies such as optical power limiting, optical storage, and so on. On the other hand, when α decreases as the laser irradiance increases, we have the saturable absorption (SA), which is induced by electron population bleaching from the ground- to the excited state.23,24 Such a process strongly depends on the laser pulse temporal width and excited-state lifetime; therefore, it is a purely excited-state effect. SA is commonly used in the development of lasers to decrease the laser pulse temporal width and as a nonlinear filter to clean up pulse shapes.23,25,26 Still, there are at least two other effects related to photobleaching: the photodegradation (PhD) associated with a lousy alteration of materials induced by light and, also, photobleaching as a consequence of trans → cis photoisomerization (PhI).27–29
Photoinduced transparency can be described as an optical phenomenon in which the absorption decrease when the light irradiance increase. Photoinduced transparency applications generally use SA-related effects instead of PhD and PhI because the process is reversible and tolerable to high light irradiances.
Recently, nanomaterials have attracted attention due to their capability of acting as saturable absorbers with high stability for ultrafast laser pulses. The key requirement for any material to work as a saturable absorber involves a high ratio between the ground (GSA) and excited-state absorption cross-sections. However, solution-grown QDs may present broad size and shape distributions, depending intrinsically on the adopted chemical synthesis method, making it difficult to accurately determine the concentration of nanoparticles in a colloidal solution accurately.30–32 Consequently, a wide range of distinct results have been reported on the magnitude of the optical processes occurring in the low-dimensional materials class. Also, the saturable absorption effect in colloidal CdTe QDs has been little explored.33,34 Thus, different optical techniques and a suitable theoretical model were employed to determine the size-dependent photoinduced transparency rate related to ground-state bleaching in aqueous colloidal CdTe QDs capped with the organic stabilizer glutathione.
II. Materials and methods
Glutathione-capped (GSH) CdTe QDs were synthesized through a one-pot aqueous route based on standard colloidal chemistry methods whose details can be found in ref. 35 and 36. The ground-state absorption and photoluminescence (PL) spectra were measured on a Shimadzu UV-2550 spectrophotometer and a Shimadzu RF-5301 PC fluorimeter, respectively. Absorption and fluorescence measurements were performed with 10 mm quartz cuvettes containing air-saturated solutions of as-prepared colloidal QDs at room temperature.We used the fluorescence saturation method to determine the GSA cross-section. For that, we employed as the excitation source 515 nm delivered by an optical parametric amplifier (Orpheus – Light Conversion) pumped by an amplified femtosecond laser system (Pharos – Light Conversion, 1030 nm, 190 fs, 3.0 kHz). The diameter of the laser beam was set 1.6 mm, which was measured through the knife-edge technique. The laser beam reaches the sample (cuvette with 10 mm optical pathway and absorbance of <0.2 at 515 nm), and the PL is collected at 90° with respect to the incident beam, which is captured through the telescope and an optical fiber coupled to the spectrometer to measure the PL. Because of the high irradiance, a freshly prepared sample was used, and the PL was acquired in the first seconds of excitation to avoid PL photodegradation (fluorescence and absorption spectra were measured after each photoexcitation). The fluorescence lifetime measurements were performed using the same laser system combined with a fast photodetector (700 ps rise time) and a 1GHz oscilloscope.
The SA measurements were carried out by means of an open-aperture Z-scan technique, which uses the same laser system employed in the fluorescence saturation method. The measurements ranged from 480 nm to 620 nm with a repetition rate of 1 kHz. The temporal width of the femtosecond pulses was obtained from the autocorrelator. The samples were placed in 2 mm thick glass cuvettes with a concentration smaller than 2.2 × 10¹⁶ QDs per cm3, as will be shown later.
III. Results and discussion
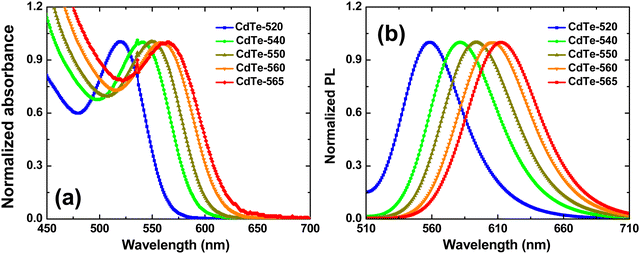
The ground-state absorption spectra (solid line-left axis) of the colloidal suspension of GSH-capped CdTe QDs is shown in Fig. 1(a). The position of the absorption band maximum ranges from 520 nm to 565 nm, and is related to the lowest-energy excitonic transition 1S3/2(h) → 1S(e). The samples were labeled with the number that indicates the wavelength corresponding to the absorption maximum: CdTe-520, CdTe-540, CdTe-550, CdTe-560 and CdTe-565. The redshift (190 meV) from the sample CdTe-520 to CdTe-565 indicates the increase in the QD size. Fig. 1(b) displays the fluorescence spectra excited at the 1S3/2(h) → 1S(e) transition peak. As noted, the fluorescence spectrum presents a small Stokes shift and a narrow full-width at half-maximum, characteristics inherent to synthetic procedures based on the colloidal chemistry approach.37To determine the average size of our QD samples, we have used a recently developed theoretical methodology that allows converting the measured PL spectrum into realistic estimates for the particle size distribution (PSD) of semiconductor QDs synthesized in a colloidal medium.38,39 Such a spectroscopic model turned out to be particularly accurate for describing ensembles of nearly spherical colloidal QDs with extremely small sizes (average diameter as small as 1–3 nm), that have not been fully incorporated into the currently available empirical sizing equations.32 The predicted PSDs exhibited an excellent agreement with those obtained from atomic force microscopy (AFM) and transmission electron microscopy (TEM), especially for aqueous CdTe QDs passivated with L-glutathione, which strictly corresponds to the same QD system investigated in the present work.38,39
Table 1 presents the average particle diameter (〈D〉) and relative size dispersion (ξ) resulting from applying the aforementioned methodology to our QD colloidal suspensions. As seen, the average radius of the QD distribution, 〈R〉 = 〈D〉/2, is significantly smaller than the bulk exciton Bohr radius for CdTe (aB = 7.5 nm),6 which indicates that the synthesized quantum dots belong to the strong confinement regime (![[R with combining macron]](https://www.rsc.org/images/entities/i_char_0052_0304.gif) /aB ≪ 1).
/aB ≪ 1).
| QDs | Absorption peak (eV) | 〈D〉 (nm) | ξ (%) | σ he (10−16 cm2) | C (QDs per cm3) | τ eh (ns) |
|---|---|---|---|---|---|---|
| CdTe-520 | 2.38 (520 nm) | 2.33 | 13.3 | 3.85 (520 nm) | 2.2 × 10¹⁶ | 39.2 |
| CdTe-540 | 2.30 (540 nm) | 2.62 | 11.5 | 4.82 (540 nm) | 1.65 × 10¹⁶ | 45.1 |
| CdTe-550 | 2.25 (550 nm) | 2.75 | 11.3 | 4.90 (550 nm) | 1.60 × 10¹⁶ | 46.6 |
| CdTe-560 | 2.21 (560 nm) | 2.88 | 11.4 | 5.1 (560 nm) | 1.45 × 10¹⁶ | 48.8 |
| CdTe-565 | 2.19 (565 nm) | 2.95 | 11.8 | 5.20 (565 nm) | 1.78 × 10¹⁶ | 52.0 |
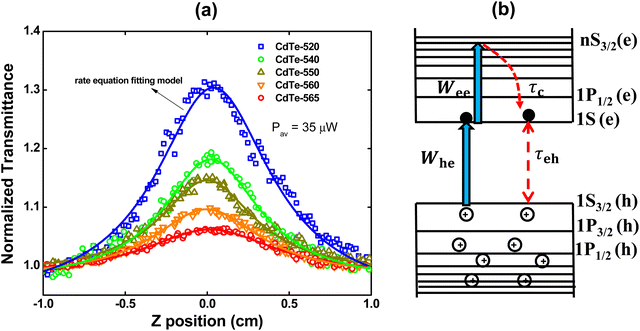
The electronic dynamics concerning the photoinduced transparency for the GSH-capped CdTe-QDs were measured using the femtosecond open aperture Z-scan technique. Fig. 2(a) shows the Z-scan signature for the excitation wavelengths corresponding to the peak of the first excitonic transition. All the Z-scan signatures shown in Fig. 2 were performed using the same average laser power (35 μW). As can be seen, the normalized transmittance for all curves increases as the sample approaches the focus (z = 0), which is a characteristic of the saturable absorption (SA) effect configuring the photoinduced transparency. Regarding the SA magnitude, it is observed that it is higher for the smaller QDs.
To aid a deeper understanding of these outcomes and obtain the ground-state bleaching quantitatively, we have considered a three-level energy diagram, as shown in Fig. 2(b). In such a framework, we have the ground state (1S3/2(h)) and two excited states (1S(e) and nS3/2(e)), which correspond to the 1S3/2(h) → 1S(e) and 1S(e) → nS3/2(e) transitions.
Because the laser pulse duration is much shorter (<200 fs) than the exciton recombination time (τeh ∼ 10−9 s), electrons excited to the first excited state (1S(e)) can be re-excited to the other higher energy excited state (nS3/2(e)) with the same laser pulse. It is important to emphasize that the low repetition rate (1 kHz) allows us to avoid thermal effects due to the accumulation of pulses. Thus, the electron population dynamics is ruled by the rate equation model given by:
 | (1) |
 | (2) |
 | (3) |
 . The parameters whe = σheI(t)/hν, and wee = σeeI(t)/hν, are the electronic transition rates, I(t) is the laser pulse irradiance, σhe and σee are the GSA, bleaching cross-sections, respectively. h and ν are the Planck constant and laser frequency, respectively. The set of coupled differential eqn (1)–(3) is solved numerically, considering the Gaussian time profile of the laser pulse. The temporal dependence of the absorption coefficient during excitation is given by:
| α(t) = C{nh(t)σeh + ne(t)σee} | (4) |
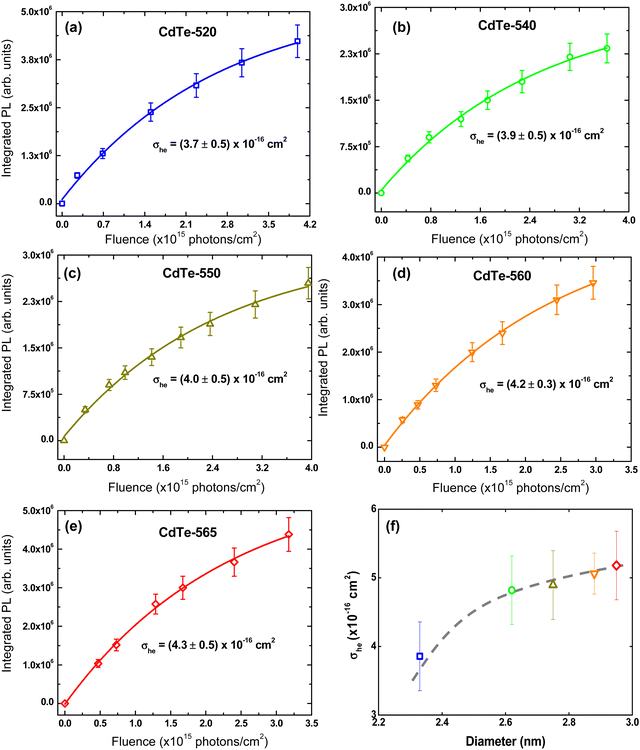
In the proposed approach, it is necessary to determine the GSA cross-section (σhe) and, consequently, the concentration of GSH-capped CdTe QDs. However, this is a difficult task to perform accurately because, unlike molecules, colloidal QDs are described by characteristic size distribution functions, thus a great challenge to quantify their concentration. Recently, several works have reported an optical method based on the PL intensity saturation as a function of the irradiance laser.40–44 In this method, when the excitation photon flux (〈N〉photons) is very high, i. e., the average number of absorbed photons by exciton (〈N〉) is higher than 1, the PL intensity tends to be saturated. Such a condition can be expressed by the following inequality:〈N〉 = σhe〈N〉photons > 1, in which σhe is the GSA cross-section. The referred saturation effect happens because in semiconductor QDs with a high Auger recombination rate as the CdTe QDs, the multi-exciton species have emission intensities much smaller than a single exciton. In this case, the electron–hole pair recombination follows the Poisson statistics given by:41
 | (5) |
 | (6) |
As seen, the PL tends to saturate for irradiances higher than 2.0 × 10¹⁵ photons per cm2, indicating that the multi-exciton species are non-emissive. Through this methodology, we found σhe at 515 nm for all QDs. By using Beer's Law and the GSA spectrum, the σhe values for the other wavelengths were determined. Fig. 3(f) gathers the σhe values related to the first excitonic band peak as a function QDs diameter.
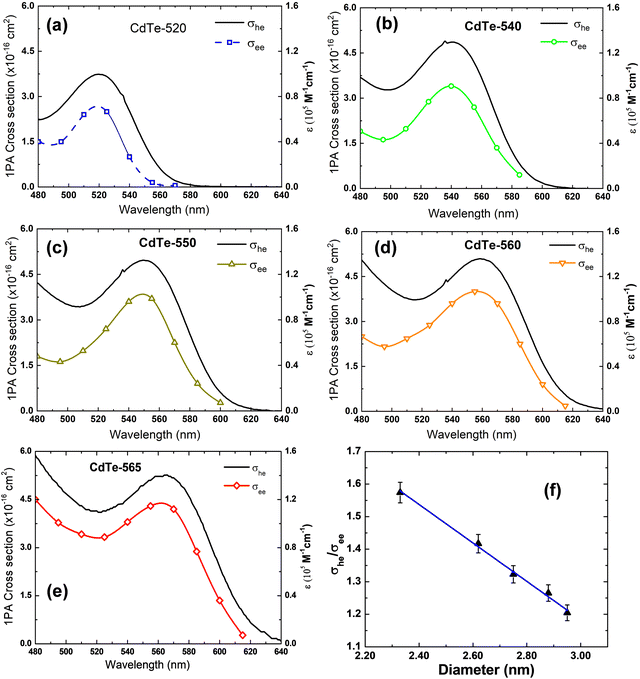
The σhe values also are reported in Table 1. We also used this result to calculate the concentration employed in the Z-scan measurements (see Table 1). Furthermore, electron–hole recombination (τhe) and cooling (τc) times are input parameters in the rate equation model. The former was obtained through the time-resolved fluorescence technique using femtosecond laser pulses. The τeh values are reported in Table 1. On the other hand, for the cooling time, we have used τc = 150 fs, obtained in Ref. 45 by applying the femtosecond transient absorption technique to colloidal CdTe QDs with different sizes. Therefore, all the information necessary to solve eqn (1)–(4) numerically was obtained. Thus, the σee parameter can be found unambiguously. Proceeding in this way, in Fig. 2(a), we show the fits (solid lines) to the Z-scan curves obtained through the rate equation model for the distinct excitation wavelengths. Thus, the σee values for the investigated colloidal dispersion of GSH-capped CdTe QDs are displayed in Fig. 4(a–e).
The σee values between 480–620 nm for GSH-capped CdTe QDS are on the order of 10−16 cm2, which is 30–75% smaller than the corresponding GSA (σhe) value. Therefore, we have σeh/σee between 1.2 and 2.8, which is a moderate SA compared to available cross-section data for organic molecules.46,47 On the other hand, the SA effect here investigated for CdTe QDs is slightly higher than that reported for graphene/polymer composite films and MoS2, and smaller than black phosphorus nanosheets, also using the femtosecond Z-scan technique.48,49Table 2 gathers the σeh and σee cross-section to a better comparison among the nanomaterials. It is worth mentioning that among the nanomaterials reported in Table 2, the CdTe QDs have the higher ground-state absorption (σhe) cross-section at the visible region.
Another interesting aspect to highlight is that σee spectra reproduce the same spectral shape as GSA spectra (see Fig. 4), which indicates that ground-state bleaching is the only mechanism associated with the photoinduced transparency. The second one, the photoinduced transparency rate defined here as Θ = σhe/σee has a linear inverse relationship with the QD diameter as depicted in Fig. 4(f). It is a curious outcome because Θ is directly proportional to the GSA cross-section, which increases over the QD size as shown in Fig. 3(f). On the other hand, as shown in ref. 50 the effective absorption related to the first-excitonic transition for cadmium-based QDs defined by αeff = σhe/V (V is the QD volume) is inversely proportional to the QD diameter. Thus, we show in Fig. 5 that the photoinduced transparency is linearly proportional to the effective absorption coefficient (cross-section values were taken into consideration the peak of the 1S3/2(h) → 1S(e) excitonic band for each sample).
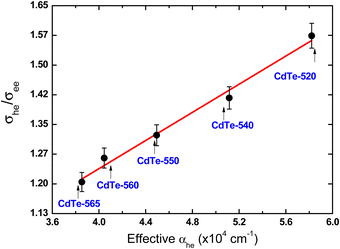 | ||
| Fig. 5 Transparence photoinduced rate as a function of the effective absorption coefficient for the CdTe QDs considering the peak of the first excitonic band for each sample (1S3/2(h) → 1S(e)). | ||
IV Final remarks
Herein, we combined the femtosecond photoluminescence saturation and Z-scan technique, along with a theoretical approach to size determination, to report the size effect on the photoinduced transparency rate of CdTe-QDs. We have shown that the photoinduced transparency connected to the ground-state bleaching of the CdTe QDs in a strong confinement regime has an inverse linear relationship with the QD diameter. Although counterintuitive, these outcomes are perfectly understood as we calculated the effective absorption coefficient of CdTe QDs. Actually, smaller QDs present higher absorption as we consider their volume, which explains the higher ground-state bleaching observed for them. In a low-concentration (C < 2 × 10¹⁶ QDs per cm3) and laser power (<35 μW) regimes, the results have revealed that for the excitation wavelength between 480–620 nm, GSH-capped CdTe QDs exhibit a considerable SA effect, which is slightly higher than graphene, a material widely studied for applications in broadband saturable absorbers for ultrafast lasers. Finally, the presented methodology can be used in excitonic engineering to select the nanomaterial capable of acting as a saturable absorber in ultrafast laser pulse development.Conflicts of interest
There are no conflicts to declare.Acknowledgements
Financial support from FAPEMIG (Fundação de Amparo à Pesquisa do Estado de Minas Gerais, APQ-01469-18), FAPESP (Fundação de Amparo à Pesquisa do Estado de São Paulo, grants 2018/11283-7 and 2015/20032-0), CNPq (Conselho Nacional de Desenvolvimento Científico e Tecnológico, CNPq – Universal Grant 425124/2018-5 and 425180/2018-2), Coordenação de Aperfeiçoamento de Pessoal de Nível Superior (CAPES), Army Research Laboratory (W911NF-21-1-0362) and the Air Force Office of Scientific Research (FA9550-15-1-0521) are acknowledged.References
- X. P. Zhai, B. Ma, Q. Wang and H. L. Zhang, Phys. Chem. Chem. Phys., 2020, 22, 22140–22156 RSC.
- J. Z. Li, H. X. Dong, S. F. Zhang, Y. F. Ma, J. Wang and L. Zhang, Nanoscale, 2016, 8, 16440–16448 RSC.
- Y. H. Qiu, K. Chen, S. J. Ding, F. Nan, Y. J. Lin, J. X. Ma, Z. H. Hao, L. Zhou and Q. Q. Wang, Nanoscale, 2019, 11, 8538–8545 RSC.
- W. J. Chen, S. Zhang, M. H. Zhou, T. H. Zhao, X. J. Qin, X. F. Liu, M. H. Liu and P. F. Duan, J. Phys. Chem. Lett., 2019, 10, 3290–3295 CrossRef CAS.
- G. Nagamine, J. O. Rocha, L. G. Bonato, A. F. Nogueira, Z. Zaharieva, A. A. R. Watt, C. H. D. Cruz and L. A. Padilha, J. Phys. Chem. Lett., 2018, 9, 3478–3484 CrossRef CAS.
- L. A. Padilha, J. Fu, D. J. Hagan, E. W. Van Stryland, C. L. Cesar, L. C. Barbosa, C. H. B. Cruz, D. Buso and A. Martucci, Phys. Rev. B: Condens. Matter Mater. Phys., 2007, 75, 075325 CrossRef.
- L. A. Padilha, et al. , Nano Lett., 2011, 11, 1227–1231 CrossRef CAS.
- L. Protesescu, S. Yakunin, M. I. Bodnarchuk, F. Krieg, R. Caputo, C. H. Hendon, R. X. Yang, A. Walsh and M. V. Kovalenko, Nano Lett., 2015, 15, 3692–3696 CrossRef CAS.
- S.-C. Pu, M.-J. Yang, C.-C. Hsu, C.-W. Lai, C.-C. Hsieh, S. H. Lin, Y.-M. Cheng and P.-T. Chou, Small, 2006, 2, 1308–1313 CAS.
- M. G. Vivas, J. F. Cury, M. A. Schiavon and C. R. Mendonca, J. Phys. Chem. C, 2013, 117, 8530–8535 CrossRef CAS.
- M. G. Vivas, J. C. L. De Sousa, L. De Boni, M. A. Schiavon and C. R. Mendonca, Materials, 2017, 10, 363, DOI:10.3390/ma10040363.
- Y. Q. Xu, et al. , J. Am. Chem. Soc., 2016, 138, 3761–3768 CrossRef CAS PubMed.
- G. B. dos Reis, R. D. F. Rodriguez, C. I. L. dos Santos, L. A. P. Gontijo, M. A. Schiavon, L. De Boni, C. R. Mendonca and M. G. Vivas, Opt. Mater., 2018, 86, 455–459 CrossRef CAS.
- V. P. Deviprasad, et al. , J. Alloys Compd., 2019, 804, 18–26 CrossRef CAS.
- J. H. Bang and P. V. Kamat, ACS Nano, 2009, 3, 1467–1476 CAS.
- C. C. Fu, et al. , Proc. Natl. Acad. Sci. U. S. A., 2007, 104, 727–732 CrossRef CAS PubMed.
- X. H. Gao, Y. Y. Cui, R. M. Levenson, L. W. K. Chung and S. M. Nie, Nat. Biotechnol., 2004, 22, 969–976 CrossRef CAS.
- R. Hanson, L. P. Kouwenhoven, J. R. Petta, S. Tarucha and L. M. K. Vandersypen, Rev. Mod. Phys., 2007, 79, 1217–1265 CrossRef CAS.
- P. Lodahl, S. Mahmoodian and S. Stobbe, Rev. Mod. Phys., 2015, 87, 347–400 CrossRef CAS.
- S. Yakunin, et al. , Nat. Commun., 2015, 6, 8056 CrossRef CAS PubMed.
- T. Yoshie, A. Scherer, J. Hendrickson, G. Khitrova, H. M. Gibbs, G. Rupper, C. Ell, O. B. Shchekin and D. G. Deppe, Nature, 2004, 432, 200–203 CrossRef CAS.
- N. X. Ca, N. T. Hien, N. T. Luyen, V. T. K. Lien, L. D. Thanh, P. V. Do, N. Q. Bau and T. T. Pham, J. Alloys Compd., 2019, 787, 823–830 CrossRef CAS.
- S. J. Ding, F. Nan, D. J. Yang, X. L. Liu, Y. L. Wang, L. Zhou, Z. H. Hao and Q. Q. Wang, Sci. Rep., 2015, 5, 15951 CrossRef.
- W. Z. Wu, S. W. Ren, Q. J. Han, Y. C. Gao and D. G. Kong, Phys. Chem. Chem. Phys., 2018, 20, 23556–23563 RSC.
- D. Pacifici, H. J. Lezec and H. A. Atwater, Nat. Photonics, 2007, 1, 402–406 CrossRef CAS.
- M. G. Thompson, A. R. Rae, M. Xia, R. V. Penty and I. H. White, IEEE J. Sel. Top. Quantum. Electon., 2009, 15, 661–672 CAS.
- M. L. Raicoski and M. G. Vivas, J. Phys. Chem. B, 2021, 125, 9887–9894 CrossRef CAS PubMed.
- L. M. Silva, D. L. Silva, M. V. Boas, Y. Bretonniere, C. Andraud and M. G. Vivas, RSC Adv., 2020, 10, 40806–40814 RSC.
- J. N. Henderson, H. W. Ai, R. E. Campbell and S. J. Remington, Proc. Natl. Acad. Sci. U. S. A., 2007, 104, 6672–6677 CrossRef CAS.
- C. D. Donega and R. Koole, J. Phys. Chem. C, 2009, 113, 6511–6520 CrossRef.
- E. Groeneveld, C. Delerue, G. Allan, Y. M. Niquet and C. D. Donega, J. Phys. Chem. C, 2012, 116, 23160–23167 CrossRef CAS.
- W. W. Yu, L. H. Qu, W. Z. Guo and X. G. Peng, Chem. Mater., 2003, 15, 2854–2860 CrossRef CAS.
- J. He, W. Ji, G. H. Ma, S. H. Tang, H. I. Elim, W. X. Sun, Z. H. Zhang and W. S. Chin, J. Appl. Phys., 2004, 95, 6381–6386 CrossRef CAS.
- B. Xu, et al. , IEEE J. Sel. Top. Quantum Electron., 2017, 23, 1900507 Search PubMed.
- J. C. L. Sousa, M. G. Vivas, J. L. Ferrari, C. R. Mendonca and M. A. Schiavon, RSC Adv., 2014, 4, 36024–36030 RSC.
- Y. Wang and S. Liu, J. Chil. Chem. Soc., 2012, 57, 1109–1112 CrossRef CAS.
- Y. Pu, F. H. Cai, D. Wang, J. X. Wang and J. F. Chen, Ind. Eng. Chem. Res., 2018, 57, 1790–1802 CrossRef CAS.
- D. L. Ferreira, R. N. Maronesi, S. O. Ferreira, A. G. Silva and M. A. Schiavon, J. Phys. Chem. C, 2019, 123, 24289–24303 CrossRef CAS.
- D. L. Ferreira, J. C. L. Sousa, R. N. Maronesi, J. Bettini, M. A. Schiavon, A. Teixeira and A. G. Silva, J. Chem. Phys., 2017, 147, 154102 CrossRef CAS.
- A. Alo, L. W. T. Barros, G. Nagamine, L. B. Vieira, J. H. Chang, B. G. Jeong, W. K. Bae and L. A. Padilha, ACS Photonics, 2020, 1806–1812 CrossRef CAS.
- V. I. Klimov, J. Phys. Chem. B, 2000, 104, 6112–6123 CrossRef CAS.
- V. Krivenkov, P. Samokhvalov, D. Dyagileva, A. Karaulov and I. Nabiev, ACS Photonics, 2020, 7, 831–836 CrossRef CAS.
- N. S. Makarov, Q. L. Lin, J. M. Pietryga, I. Robel and V. I. Klimov, ACS Nano, 2016, 10, 10829–10841 CrossRef CAS.
- G. Nagamine, H. B. Nunciaroni, H. McDaniel, A. L. Efros, C. H. D. Cruz and L. A. Padilha, Nano Lett., 2018, 18, 6353–6359 CrossRef CAS PubMed.
- S. Kaniyankandy, S. Rawalekar, S. Verma, D. K. Palit and H. N. Ghosh, Phys. Chem. Chem. Phys., 2010, 12, 4210–4216 RSC.
- M. G. Vivas, L. De Boni, L. Gaffo and C. R. Mendonca, Dyes Pigm., 2014, 101, 338–343 CrossRef CAS.
- M. G. Vivas, E. G. R. Fernandes, M. L. Rodriguez-Mendez and C. R. Mendonca, Chem. Phys. Lett., 2012, 531, 173–176 CrossRef CAS.
- Y. Y. Feng, N. N. Dong, G. Z. Wang, Y. X. Li, S. F. Zhang, K. P. Wang, L. Zhang, W. J. Blau and J. Wang, Opt. Express, 2015, 23, 559–569 CrossRef PubMed.
- S. F. Zhang, Y. X. Li, X. Y. Zhang, N. N. Dong, K. P. Wang, D. M. Hanlon, J. N. Coleman, L. Zhang and J. Wang, Nanoscale, 2016, 8, 17374–17382 RSC.
- C. A. Leatherdale, W. K. Woo, F. V. Mikulec and M. G. Bawendi, J. Phys. Chem. B, 2002, 106, 7619–7622 CrossRef CAS.
| This journal is © the Owner Societies 2023 |

