Synchrotron-based X-ray absorption spectroscopy of Pd nanoparticles decorated on multi-walled carbon nanotubes during successive cycles of He/H2 exposure
A.
Reyhani
a,
S. Z.
Mortazavi
 *a,
A.
Taherkhani
a,
M. R.
Mohammadi
 b,
M.
Mehrabi
c and
P.
Parvin
d
aPhysics Dept., Faculty of Science, Imam Khomeini International University, P.O. Box 34149-16818, Qazvin, Iran. E-mail: z.mortazavi@sci.ikiu.ac.ir
bUniversity of Sistan and Baluchestan, Zahedan, 98167-45845, Iran
cDepartment of Physics, Persian Gulf University, P.O. Box 75169-13817, Bushehr, Iran
dPhysics Dept., Amirkabir University of Technology, P.O. Box 15875-4413, Tehran, Iran
First published on 29th November 2022
Abstract
The MWCNTs are decorated by Pd nanoparticles via various techniques including laser ablation in liquid, chemical reduction, and simultaneously both of them. To study the hydrogen adsorption mechanism, Pd K-edge X-ray absorption spectroscopy (XAS) is carried out via heating/cooling processes under He/H2 exposure. The Fourier transform X-ray absorption fine structure (FT-EXAFS) simulation indicates the presence of the Pd–Pd and Pd–C(O) bonds. Furthermore, during the successive cycles of He/H2 exposure, bond restructuring takes place. Moreover, the heating process under He/H2 exposure induces a destructive effect on the Pd–C(O) links. Furthermore, the Pd–Pd bond distance enlarges due to the hydrogen adsorption for all samples, however, in the case of PLAL, the change in the bond distances becomes dominant. XRD and XPS are applied to support the findings.
1. Introduction
Nowadays, hydrogen is taken into consideration as a compact, lightweight and efficient clean-energy carrier to avoid greenhouse gas emissions. Furthermore, hydrogen is an efficient and non-pollutant fuel for transportation, heating, and energy generation. One problem that limits the public use of hydrogen fuel is the lack of safe storage. Therefore, tremendous attention has been paid to developing storage methods based on gas-on-solid adsorption.1–6 The latter deals with one- and two-dimensional nanostructures due to their high surface-to-volume ratio which envisage a diversity of applications against bulk materials.7 Particularly, carbon nanostructures exhibit interesting features in hydrogen adsorption via the π and σ bonds with the sp2 hybridization state.8 Carbon nanotubes (CNTs) represent a new orientation for solid hydrogen storage, especially when these materials trap ample hydrogen at room temperature. One believes that the addition of metal catalytic nanoparticles (NPs) to the CNTs effectively enhances the storage rate.9–21 For instance, palladium nanoparticles (Pd-NPs) exhibit notable competence in the field of hydrogen adsorption.9,22–35 For this purpose, laser ablation and chemical reduction methods were examined to decorate carbon nanotubes.9,36–38 However, Pd-multi-walled carbon nanotube (MWCNT) hybrids suffer from the loss of hydrogen storage capacity after several cycles of adsorption–desorption which mainly arises from the structural damage after interaction with H2.9On the other hand, synchrotron radiation in general and X-ray absorption spectroscopy (XAS) in particular can be beneficial to understanding the local structures and chemical compositions of the metal and metal oxide anchoring on the MWCNTs’ surface.39–46 Bugaev et al. have studied the hydrogen interaction with Pd nanoparticles using in situ XAS, in both the X-ray absorption near edge structure (XANES) and extended X-ray absorption fine structure (EXAFS) regions at Pd K-edge, as well as X-ray diffraction (XRD) as a function of temperature and hydrogen pressure. The effect of hydrogen concentration has been reported on the electronic palladium structure to increase Pd–Pd interatomic distance.22
We have studied the hydrogen storage properties of the Pd–MWCNTs in our previous works. The results of those inferred that the addition of metal catalytic nanoparticles (NPs) to the CNTs effectively enhances the hydrogen storage rate.9–21 Among the metal catalytic NPs, palladium nanoparticles (Pd-NPs) exhibit notable competence in the field of hydrogen adsorption. For this purpose, laser ablation and chemical reduction methods were examined to decorate carbon nanotubes with Pd-NPs.9,36–38 However, Pd multi-walled carbon nanotubes (MWCNTs) suffer from the loss of hydrogen storage capacity after several cycles of adsorption–desorption, mainly arising from the structural changes after interaction with H2.9 In this study, we have investigated the local structural changes around Pd atoms as an absorber using EXAFS spectroscopy during exposure to hydrogen at various temperatures i.e. RT, 150, and 300 °C. Here, we have focused on finding the reason for the loss of hydrogen storage capacity after several cycles of adsorption–desorption.
Here, EXAFS measurements are performed to monitor the formation of PdHx complexes and also structural changes of Pd–Pd and Pd–C compounds in the Pd–MWCNTs. Various techniques including chemical reduction (CR), pulse laser ablation in liquid (PLAL), and simultaneous CR/PLAL are employed to form Pd–MWCNTs. The structural changes of Pd–MWCNTs are investigated after interaction with H2 and He at various temperatures for the purpose of hydrogen storage application. Moreover, X-ray photoelectron spectroscopy (XPS), transmission electron microscopy (TEM), X-ray diffraction (XRD), and thermal gravimetric analysis/differential thermal analysis (TGA/DTA) were carried out to support the findings.
2. Experimental methods
2.1. Purification and decoration of MWCNTs
The procedures for the purification and the Pd-decoration of MWCNTs are similar to our previous works.26,36–38Fig. 1 depicts the schematics of the PLAL, CR, and simultaneous CR–PLAL methods for the Pd anchoring of MWCNTs. Samples #1, 2, and 3 are prepared according to the techniques of interest. At first 100 mg of MWCNTs with 30–50 nm diameter and ∼20 μm length were used for each sample. After the heating process at 400 °C under ambient oxygen for 1 hour, 3 M HF (Merck) is applied for 24 h at room temperature. Subsequently, the MWCNTs are immersed in 3 M nitric acid (Merck) at boiling temperature (∼90 °C) for 6 h. Afterward, the MWCNTs are rinsed several times with deionized water and dried in an oven at 100 °C under atmospheric pressure. Finally, the purified MWCNTs are decorated with Pd-NPs via techniques of interest. | ||
| Fig. 1 Decoration process of Pd-NPs on the MWCNTs using (a) PLAL, (b) CR and (c) simultaneous CR and PLAL techniques. | ||
Sample #1 is fabricated using PLAL by a Q-switched Nd:YAG laser at 1064 nm with 10 ns duration, 5 Hz repetition rate, 50 mJ energy shot, focusing through a quartz lens (f = 15 cm) onto ∼1 mm2 spot size on the Pd target beneath the suspension of the purified MWCNTs in the deionized water for 90 min as shown in Fig. 1a. The obtained Pd–MWCNTs in suspension are collected by making use of a centrifuge and then dried in an atmospheric oven at 100 °C. In order to attach Pd-NPs to MWCNTs via the CR method (sample #2), the purified nanotubes are dispersed in 50 ml of deionized water with palladium chloride (PdCl2 99% Merck) and then the suspension is sonicated in an ultrasonic bath for 15 min, and treated with a magnetic stirrer for 60 min. Afterward, hydrazine is slowly added to the obtained suspension during stirring as long as the suspension is entirely transparent as shown in Fig. 1b. Eventually, the Pd–MWCNTs in suspension are separated and dried similar to the previous method. In the case of sample #3, the laser ablation and chemical reduction hybrid methods contribute to anchoring MWCNTs with Pd NPs as shown in Fig. 1c. In fact, the laser ablation of the Pd solid target takes place in the suspension containing the purified MWCNTs dispersed in deionized water and PdCl2. The other conditions are similar to that of sample #1. Note that in the course of preparing sample #3, hydrazine solution is slowly added dropwise to the suspension. Finally, the modified MWCNTs are separated from the suspension and dried.
2.2. Characterization methods
TEM (XL, Philips) is exploited to examine the samples' morphology and the evidence of Pd nanoparticles decorated on MWCNTs. Moreover, the obtained samples are characterized by making use of the XRD Rigaku D-max diffractometer using Cu Kα radiations. Furthermore, XPS is performed in the analysis chamber operating in a vacuum with a monochromatic Al Kα X-ray source at the energy of 1486.6 eV. TGA/DTA (951 Dupont) is applied to determine the loaded Pd-NP content on the MWCNTs and the graphitization degree. The heating process is performed ranging from 30 to 800 °C under a constant rate of 15 °C min−1 under ambient conditions.Pd K edge (24.350 keV) X-ray absorption spectroscopy is carried out in transmission mode at beamline BL22-CLAESS of ALBA Synchrotron (Barcelona, Spain). At first, the powder sample is pressed in a cylindrical aluminum sample holder with 2 mm internal diameter and 10 mm length. Then, the sample is loaded into a pre-designed reaction cell under controlled conditions. The system allows heating of the sample from room temperature up to 300 °C with a rate of 5 °C min−1 under 1 °C precision in a helium/hydrogen atmosphere. Subsequently, a number of EXAFS spectra are recorded at certain operating temperatures of room temperature (RT), 150 and 300 °C under He/H2 atmospheres. The experimental stages are orderly performed as follows (which is called a cycle):
(I) Sample is heated from room temperature to 300 °C under He gas exposure with a flow rate of 200 sccm in order to purge humidity and the other impurities from the MWCNTs surface.
(II) XAS is performed at ascending set point temperatures of RT, 150, and 300 °C under He gas exposure.
(III) At 300 °C, He gas flow is stopped and the sample is treated with hydrogen gas at atmospheric pressure.
(IV) The sample is then cooled down to room temperature under H2 gas exposure.
(V) Similarly, XAS is carried out at descending temperatures of 300, 150 °C, and RT under H2 gas exposure.
3. Results and discussion
TGA is taken into account as an effective technique to assess the amount of Pd loading on the MWCNTs. Fig. 2 depicts the typical TGA graphs of Pd decorated MWCNTs taken by PLAL, CR, and hybrid CR/PLAL techniques as samples #1, 2, and 3, respectively. The temperature interval of 500–800 °C is attributed to the graphitic structure of MWCNTs. According to the carbon weight loss and the residual species after heating up to 800 °C, the amount of Pd loading on the treated MWCNTs is calculated. In fact, Pd loading is measured to be the highest in sample #3 among the others. Moreover, the weight loss observed at ∼200–400 °C in samples #1 and 3 mainly arises from amorphous carbon due to the destructive interaction of the laser with MWCNTs during the PLAL and hybrid CR–PLAL methods.36–38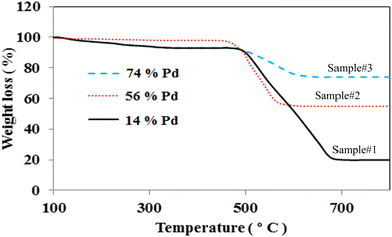 | ||
| Fig. 2 TGA graphs of Pd decorated MWCNTs synthesized by PLAL (sample #1), CR (sample #2), and hybrid CR/PLAL (sample #3). | ||
Fig. 3 illustrates the TEM images of the purified MWCNTs and Pd-decorated MWCNTs (samples #1, 2, and 3). Fig. 3(a) displays the purified MWCNTs with several μm in length and 20–50 nm in diameter. Fig. 3b, c and d display the typical images containing Pd NPs anchored on the MWCNTs’ surface via PLAL (14% Pd), CR (56% Pd), and CR/PLAL (74% Pd), respectively. Furthermore, the average size of Pd NPs synthesized during the CR technique looks to be larger than those formed by other techniques. The simultaneous contribution of PLAL and CR techniques emphasizes the large content of Pd loading in accordance with TGA findings.
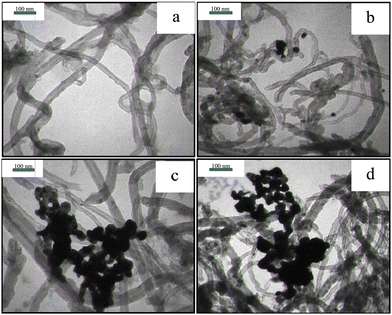 | ||
| Fig. 3 TEM images of (a) purified MWCNTs and (b) sample #1, (c) sample #2, and (d) sample #3. Note that plenty of Pd-NPs is congested around MWCNTs during the CR and CR/PLAL processes. | ||
Fig. 4 demonstrates XRD patterns of the purified MWCNTs and the Pd decorated ones using the techniques of interest. The patterns verify the evidence of Pd loading on the MWCNTs corresponding to the reference card numbers 01-0646 for carbon and 01-1201 related to the cubic structural Pd. The peaks at 40.30, 46.83, and 68.32° indicate the face-centered-cubic (fcc) crystalline structures of Pd corresponding to the facets (111), (200), and (220), respectively. In addition, the MWCNTs are identified with three peaks around 26.25, 43.31, and 44.67° due to the crystalline planes of (002), (100), and (101), respectively. The ratio of the highest peak of Pd corresponding to (111), to that of carbon attributing to the plane of (002), emphasizes the Pd loading in ascending order from samples #1 to 3. Moreover, in the course of PLAL the diffraction peaks of the Pd exhibit a broader full-width at half maximum (FWHM) than those created via CR. In fact, PLAL generates smaller particles than those by CR. According to Williamson-Hall's formula, the average sizes of Pd-NPs are measured to be 14, 43, and 61 nm for samples #1, 2, and 3, respectively in good agreement with TEM findings.
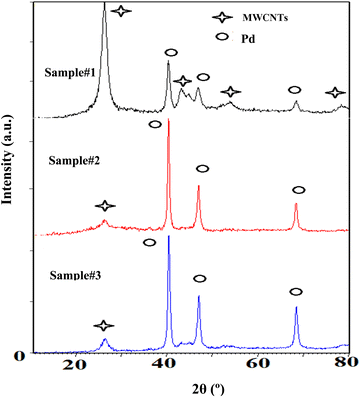 | ||
| Fig. 4 XRD patterns of the decorated MWCNTs with Pd-NPs are based on the techniques of interest as sample #1, sample #2, and sample #3. | ||
In order to investigate the fine structures of Pd NPs as a promoter to enhance the hydrogen adsorption capability of the MWCNTs, XAS including XANES and EXAFS has been carried out. Actually, the XAS can simultaneously provide information on the gas–solid interactions in terms of bond distance, coordination number, and neighboring types as well as investigation of the oxidation state and coordination environment of particular atoms in a material.22,44–47 Moreover, the evolution of the carbon–palladium bonding in the treated Pd–MWCNTs under He/H2 atmospheres can be well understood. Fig. 5 illustrates the XANES spectra corresponding to the Pd K-edge of NPs decorated on the MWCNTs by various techniques of interest under He exposure at RT. Initially, the energy is calibrated by measuring the K-edge spectra of Pd foil regarding the normalization of Pd (0) K-edge around 24![[thin space (1/6-em)]](https://www.rsc.org/images/entities/char_2009.gif) 350 eV. In this way, the positions of K-edge (I) on abscissa appear at 24
350 eV. In this way, the positions of K-edge (I) on abscissa appear at 24![[thin space (1/6-em)]](https://www.rsc.org/images/entities/char_2009.gif) 353, 24
353, 24![[thin space (1/6-em)]](https://www.rsc.org/images/entities/char_2009.gif) 350, and 24
350, and 24![[thin space (1/6-em)]](https://www.rsc.org/images/entities/char_2009.gif) 351 eV for samples #1, 2, and 3, respectively. The slight energy shift may arise from the effect of Pd bonding with MWCNTs and the surface oxidation of Pd NPs, in agreement with other reports48,49 where peaks II and III are attributed to Pd0 NPs.50,51
351 eV for samples #1, 2, and 3, respectively. The slight energy shift may arise from the effect of Pd bonding with MWCNTs and the surface oxidation of Pd NPs, in agreement with other reports48,49 where peaks II and III are attributed to Pd0 NPs.50,51
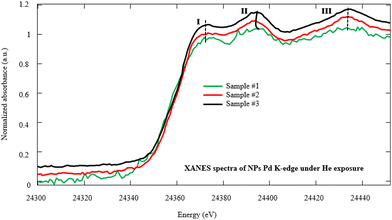 | ||
| Fig. 5 Normalized Pd K-edge XANES spectra of NPs decorated on the MWCNTs by PLAL, CR, and hybrid CR/PLAL techniques (samples #1, 2, and 3) under He exposure at RT. | ||
Fig. 6 shows the Fourier transform (FT) EXAFS spectra of Pd NPs-MWCNTs synthesized by the techniques of interest at RT under He exposure. The FT data are extracted from EXAFS with consideration of the phase correction leading to FT-EXAFS spectra. The EXAFS equation is defined as follows:
 | (1) |
![[thin space (1/6-em)]](https://www.rsc.org/images/entities/char_2009.gif) 350 eV and 0.7, respectively. Indeed, the EXAFS spectrum χ(k) includes the sum of the contribution of atomic shells where those shells consist of a group of elements with similar atomic numbers at equal distances from X-ray absorbing species.
350 eV and 0.7, respectively. Indeed, the EXAFS spectrum χ(k) includes the sum of the contribution of atomic shells where those shells consist of a group of elements with similar atomic numbers at equal distances from X-ray absorbing species.
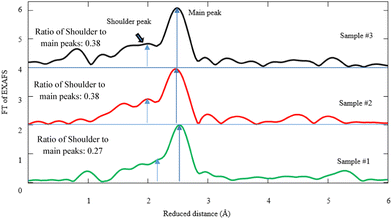 | ||
| Fig. 6 Fourier transform (FT) of Pd K-edge EXAFS corresponding to samples #1, 2, and 3. The fitting parameters for the simulations are given in Table 1. | ||
Hence, the simulation of FT-EXAFS spectra gives rise to the presence of the Pd–C(O) and Pd–Pd bonds. According to the simulation of the FT-spectra in Fig. 6, the shoulder ∼1.88 Å designates the Pd–C(O) link, whereas the main peak at ∼2.78 Å is attributed to Pd–Pd bonding. Based on the FEFF calculations and the simulation by the first Pd–C(O) shell, the coordination numbers of carbon atoms are measured to be 1.73, 1.32, and 2.97 in samples #1, 2, and 3, respectively (see Table 1). It is worth noting that the ratio intensity of Pd–C(O) to Pd–Pd bond due to CR and CR/PLAL is notably higher than that of PLAL. In fact, the coordination number of carbon atoms for Pd–C(O) due to the hybrid technique is approximately twice as large compared with that of PLAL. Yuan et al. also reported a Pd–C bond with a length of 1.95 Å as the linkage between Pd and the ligand.52 Furthermore, Debye–Waller factors (σ2 = σvib2 + σconfig2) are estimated and tabulated in Table 1 based on the FEFF model, alongside the length of bonds and the coordination numbers. There are two sources for the distribution of σ2 including the vibrational disorder (σvib) due to thermal fluctuation and the configurational disorder (σconfig) because of structural defects. Regarding the data measurement of Pd–C(O) bonding at RT, the σ variation is negligible for all samples of interest. Despite this, the configurational disorder remains approximately invariant related to the Pd–Pd bonds for the techniques of interest, however the values for Pd–C(O) bonding decrease for CR in comparison to other techniques.
| Pd–O1 | Pd–Pd1 | Pd–O2 | Pd–Pd2 | Pd–Pd3 | Pd–Pd4 | ||
|---|---|---|---|---|---|---|---|
| Sample #1 | Distance [Å] | 1.89 ± 0.01 | 2.73 ± 0.01 | 3.09 ± 0.01 | 3.89 ± 0.01 | 4.79 ± 0.01 | 5.44 ± 0.01 |
| Coordination number | 1.73 ± 0.3 | 10.74 ± 0.1 | 12.65 ± 0.5 | 7.97 ± 0.2 | 23.15 ± 1.0 | 10.16 ± 0.1 | |
| σ [Å] | 0.0042 ± 0.0001 | 0.0056 ± 0.0001 | 0.0040 ± 0.0001 | 0.012 ± 0.001 | 0.010 ± 0.001 | 0.0013 ± 0.0001 | |
| Sample #2 | Distance [Å] | 1.90 ± 0.02 | 2.74 ± 0.01 | 3.10 ± 0.01 | 3.92 ± 0.01 | 4.76 ± 0.01 | 5.44 ± 0.01 |
| Coordination number | 1.32 ± 0.6 | 10.04 ± 0.2 | 14.02 ± 0.5 | 3.20 ± 0.2 | 24.95 ± 0.9 | 10.02 ± 1.3 | |
| σ [Å] | 0.0014 ± 0.0001 | 0.0047 ± 0.0001 | 0.0025 ± 0.0001 | 0.0069 ± 0.0001 | 0.010 ± 0.001 | 0.0010 ± 0.0001 | |
| Sample #3 | Distance [Å] | 2.03 ± 0.01 | 2.74 ± 0.01 | 3.10 ± 0.01 | 3.93 ± 0.01 | 4.79 ± 0.01 | 5.48 ± 0.01 |
| Coordination number | 2.97 ± 0.9 | 11.19 ± 0.1 | 10.58 ± 0.5 | 3.26 ± 0.2 | 20.14 ± 0.9 | 9.87 ± 1.3 | |
| σ [Å] | 0.0050 ± 0.0001 | 0.0054 ± 0.0001 | 0.0052 ± 0.0001 | 0.0150 ± 0.001 | 0.0075 ± 0.001 | 0.0010 ± 0.0010 | |
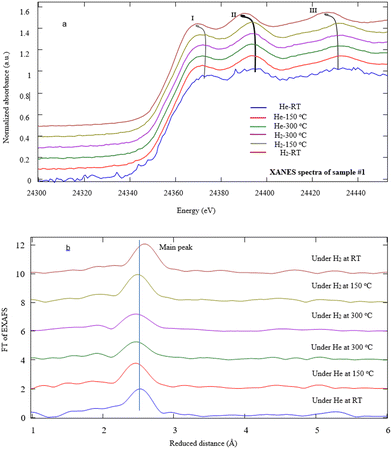
X-ray absorption fine structure measurements were also performed to investigate the local structure of Pd NPs under He/H2 exposures at various temperatures in detail. Fig. 7a typically illustrates the Pd K-edge EXAFS spectra of sample #1. After the heating process, the EXAFS data indicate that the absorption edge energy of Pd NPs shifts toward lower energy under a temperature rise and He exposure. Note that helium is replaced by hydrogen at T = 300 °C, and then during the cooling process, the shift to lower energy still goes on. In fact, the helium contribution as inert gas reveals the effects of the thermal process against the chemical reactions involved. The first peak undergoes a downshift versus temperature under hydrogen exposure at RT. Similarly, the positions of the second and third peaks shift to lower energies due to H2 adsorption whereas those peaks remain invariant under helium exposure. The slight shift of the absorption edge most likely arises from PdC(O) link detachment in agreement with ref. 48 and 49. There were similar results for samples #2 and 3.
Regarding the second and third peaks (II, III) attributed to Pd0 NPs, the characteristic frequency taken from EXAFS eqn (1) downshifts at the final stage of the experiments under H2 exposure at RT. The value of downshifting for samples #1, 2, and 3 denote to be 3.5, 2.7, and 4.0 eV, respectively. It is shown that the temperature rise does not affect the resonance. According to the dominant expression sin(2kRi + Φi) in the EXAFS equation, since the phase shift slightly changes due to the nature of the absorber and back-scatterer, thus it is mainly correlated to the H2 adsorption contents of the nanostructures such that the value of R is promotional to the Pd–Pd bond distance according to Fig. 7b.
Fig. 7b depicts the typical FT-EXAFS spectra of sample #1 under different conditions. In fact, according to simulation of the FT-spectra, there is an intense peak at ∼2.76 Å, attributed to Pd–Pd bonding for all samples which moves toward a longer distance due to the hydrogen absorption. Moreover, the broad peaks appear from 1.5 to 2.0 Å which experience the change in shape and intensity after hydrogen absorption. It is supposed that these peaks are in conjunction with Pd–C(O) bonds.51,53,54
Fig. 8a, b, and c display FT-EXAFS spectra of Pd NPs decorated on MWCNTs under He/H2 exposure at RT for samples #1, 2, and 3, respectively. In fact, a notable drop takes place for the main peak after hydrogen exposure and the distances enlarge due to the hydrogen attachment to Pd. It is presumed that the shoulder peaks attributed to the Pd–C(O) bond highlights the reduction of bonding content, most likely leading to the decomposition under hydrogen exposure. The variation of Pd–Pd bonding distance ascertains to be 0.11, 0.08, and 0.09 Å for samples #1, 2, and 3 after hydrogen absorption, respectively.
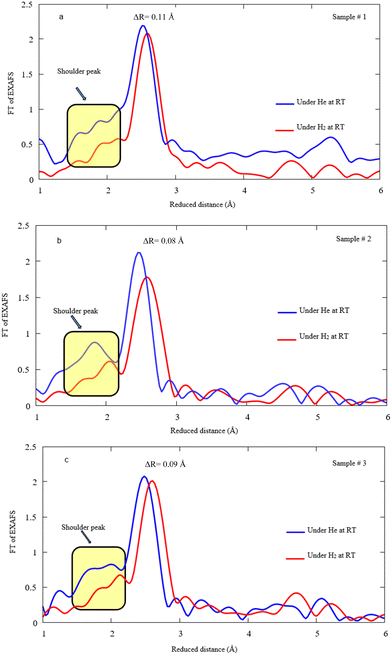 | ||
| Fig. 8 FT EXAFS spectra under He/H2 exposure at RT for samples #1, 2, and 3. Note that the spectra corresponding to He exposure are depicted in Fig. 6 and here the spectra are demonstrated after H2 exposure in comparison. | ||
Table 2 summarizes the R, CN, and σ function of the Pd–MWCNTs of all samples taken during the H2 exposure at RT. A reduction in coordination number takes place during hydrogen exposure for the Pd–C(O) bond in the case of all samples. Moreover, the bonding distance increases during hydrogen exposure for all bonds and techniques of interest. However, the elongation of the Pd–Pd compound is pronounced for PLAL with respect to CR and CR/PLAL techniques. A similar process obviously occurs for Pd–C(O) related to the CR technique (sample #2), which is loosely bound to the stronger Pd–Pd bond. Although the orders of magnitude corresponding to the σ parameter of Pd–C(O) resembles an invariant at RT under H2 exposure in comparison with He exposure, however, CN impressively reduces after H2 exposure. The reduction most likely arises from the loss of links between MWCNTs and Pd NPs.
| Pd–O1 | Pd–Pd1 | Pd–O2 | Pd–Pd2 | Pd–Pd3 | Pd–Pd4 | ||
|---|---|---|---|---|---|---|---|
| Sample #1 | Distance [Å] | 2.01 ± 0.01 | 2.84 ± 0.01 | 3.11 ± 0.01 | 3.85 ± 0.01 | 4.85 ± 0.01 | 5.38 ± 0.01 |
| Coordination number | 1.19 ± 0.3 | 11.69 ± 0.1 | 8.03 ± 0.5 | 4.02 ± 0.2 | 21.09 ± 1.0 | 9.09 ± 0.1 | |
| σ [Å] | 0.0040 ± 0.0001 | 0.0052 ± 0.0001 | 0.0062 ± 0.0001 | 0.010 ± 0.001 | 0.0074 ± 0.001 | 0.001 ± 0.0001 | |
| Sample #2 | Distance [Å] | 2.13 ± 0.02 | 2.82 ± 0.01 | 3.15 ± 0.01 | 4.04 ± 0.01 | 4.94 ± 0.01 | 5.56 ± 0.01 |
| Coordination number | 0.58 ± 0.1 | 11.88 ± 0.2 | 13.80 ± 0.5 | 5.65 ± 0.2 | 22.98 ± 0.9 | 10.20 ± 1.3 | |
| σ [Å] | 0.0025 ± 0.0001 | 0.0061 ± 0.0001 | 0.0026 ± 0.0001 | 0.0070 ± 0.0001 | 0.0120 ± 0.0001 | 0.0065 ± 0.0001 | |
| Sample #3 | Distance [Å] | 2.03 ± 0.01 | 2.83 ± 0.01 | 3.16 ± 0.01 | 4.11 ± 0.01 | 4.96 ± 0.01 | 5.50 ± 0.01 |
| Coordination number | 0.45 ± 0.1 | 11.79 ± 0.1 | 10.51 ± 0.5 | 5.99 ± 0.2 | 22.54 ± 0.9 | 12.54 ± 1.3 | |
| σ [Å] | 0.0031 ± 0.0001 | 0.0057 ± 0.0001 | 0.0063 ± 0.0001 | 0.0100 ± 0.0001 | 0.0085 ± 0.001 | 0.014 ± 0.001 | |
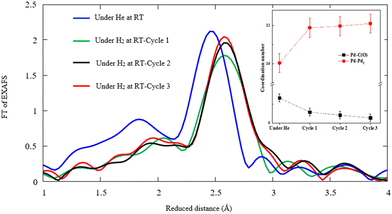
Further speculation is done by repeating the hydrogen exposure in three cycles for the typical sample obtained by the CR technique in order to elucidate the structural alteration after multiple hydrogen injections. Fig. 9 displays the FT-EXAFS and the corresponding coordination numbers for Pd–Pd and Pd–C(O) versus the first, second, and third cycles of hydrogen exposure. The findings confirm a significant drop of Pd–C(O) peak amplitudes in successive H2 adsorption cycles against that of Pd–Pd. This phenomenon most likely corresponds to the reduction of Pd–C(O) contents due to decomposition events. The coordination number of Pd–C(O) decreases and that of Pd–Pd increases in the successive cycles of hydrogen exposure based on Pd–Pd restructuring.
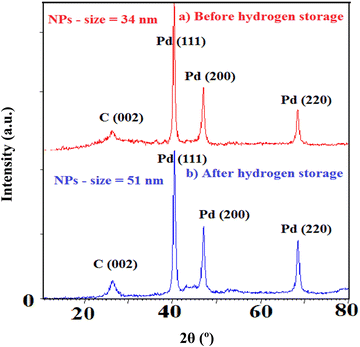
Furthermore, XRD of the samples is performed to emphasize the structural changes as shown in Fig. 10. Note that the crystallinity of Pd and C alters after hydrogen exposure in agreement with the EXAFS results. In fact, heating/cooling processes under H2 exposure induce restructuring for Pd NPs based on the change in the intensity ratio of various facets. The intensity variation of Pd crystalline planes (particularly 220 and 200) addresses the changing of preferential orientation. It also displays the enlargement of Pd NPs (from 34 to 51 nm) most likely due to the particle aggregation and decreasing of Pd–C(O) linkages.
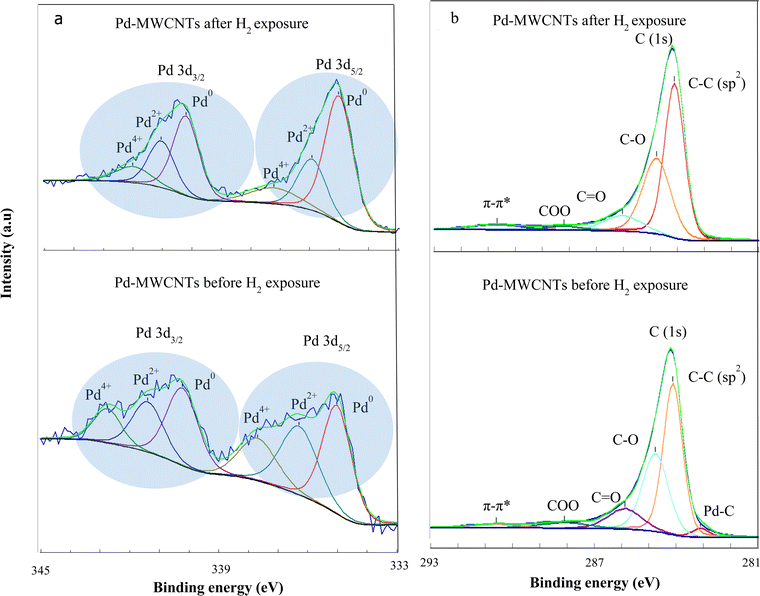
In order to verify the losses of Pd–O(C) bonds during hydrogen exposure, XPS analyses are also carried out. Fig. 11a and b demonstrate the Pd (3d) and C (1s) spectra of Pd–MWNTs, respectively before/after H2 exposure. The change of FWHM in XPS is related to chemical bonding, which most likely arises from thermal treatment during successive cycles of hydrogen exposure. The results demonstrate three peaks related to Pd compounds before and after H2 exposure including Pd0, Pd2+, and Pd4+.55,56 According to Fig. 11a and Table 3, Pd2+ and Pd4+ contents reduce down after H2 exposure compared with those before H2 exposure. This arises from the reduction of Pd–O–MWCNT bonds, in agreement with XAS results. On the other hand, the energy shoulder related to the Pd2+ and Pd4+ decrease gradually after H2 exposure due to Pd nanoparticle aggregation. Zhang et al. also reported that the energy shoulder attributed to PdOx gradually decreases for Pd NP sizes of 2.7 to 8.1 nm.57 As shown in Fig. 11a and Table 3, the intensity of Pd2+ and Pd4+ peaks notably decrease after hydrogen exposure. This change is interpreted as a reduction of the palladium oxide towards the more metallic Pd in accordance with the EXAFS findings. Consequently, the presence of palladium oxides in the synthesized samples is confirmed by both XPS and EXAFS analyses. The broad peaks appear from 1.5 to 2.0 Å in EXAFS spectra which are attributed to Pd–C(O) bonds.51,53,54 Moreover, XPS demonstrates three peaks related to Pd compounds including Pd0, Pd2+, and Pd4+ as reported in ref. 55 and 56 too. The latter peaks are related to the palladium oxide compounds which are in agreement with the EXAFS findings. However, due to the surface-sensitive nature of XPS analysis, these peaks are more observable in XPS spectra than those of EXAFS.
| Pd NPs before H2 exposure | Ratioa | Pd NPs after H2 exposure | Ratioa | ||||
|---|---|---|---|---|---|---|---|
| Attribute | Binding energy (eV) | Percent (%) | Attribute | Binding energy (eV) | Percent (%) | ||
| a Note that the ratio ascertains the peak areas of Pd2+/Pd and Pd4+/Pd. | |||||||
| Pd | 335.5, 340.8 | 13.2, 19.8 | — | Pd | 335.5, 340.8 | 22.5, 20.9 | — |
| Pd2+ | 336.3, 341.9 | 21.6, 13.4 | 1.63, 0.67 | Pd2+ | 336.1, 341.6 | 21.1, 12.3 | 0.93, 0.58 |
| Pd4+ | 338.0, 343.3 | 21.4, 10.6 | 1.62, 0.53 | Pd4+ | 337.9, 343.1 | 13.6, 9.6 | 0.60, 0.45 |
As shown in Fig. 11b and Table 4, the slight peak corresponding to metal–carbon bonding appears at ∼283.2 eV before hydrogen exposure, whereas it nearly disappears after the exposure. Furthermore, a dominant peak at ∼284.5 eV is attributed to C![[double bond, length as m-dash]](https://www.rsc.org/images/entities/char_e001.gif) C. Despite four shoulders appearing at ∼285.4 (C–OH), 286.4 (C–O), 288.0 (C
C. Despite four shoulders appearing at ∼285.4 (C–OH), 286.4 (C–O), 288.0 (C![[double bond, length as m-dash]](https://www.rsc.org/images/entities/char_e001.gif) O),58 and ∼291.2 eV (π–π*) before hydrogen exposure, however, those are shifted to higher binding energy indicating a smaller amplitude alongside the reduction of carboxyl species just after the exposure. The deconvoluted XPS spectra of the C(1s) demonstrate the variation of surface functional groups in the Pd–MWCNTs after H2 exposure such as carboxyl, alcohol, and carbons neighboring oxygen functional groups as well as the disappearance of the Pd–C peak. These results are also confirmed by the XAS findings regarding the reduction of the Pd–C bond after H2 exposure.
O),58 and ∼291.2 eV (π–π*) before hydrogen exposure, however, those are shifted to higher binding energy indicating a smaller amplitude alongside the reduction of carboxyl species just after the exposure. The deconvoluted XPS spectra of the C(1s) demonstrate the variation of surface functional groups in the Pd–MWCNTs after H2 exposure such as carboxyl, alcohol, and carbons neighboring oxygen functional groups as well as the disappearance of the Pd–C peak. These results are also confirmed by the XAS findings regarding the reduction of the Pd–C bond after H2 exposure.
| C 1s before H2 exposure | C 1s after H2 exposure | ||||
|---|---|---|---|---|---|
| Attribute | Binding energy (eV) | Percent (%) | Attribute | Binding energy (eV) | Percent (%) |
C![[double bond, length as m-dash]](https://www.rsc.org/images/entities/char_e001.gif) C C |
284.50 | 61.4 | C![[double bond, length as m-dash]](https://www.rsc.org/images/entities/char_e001.gif) C C |
284.54 | 70.7 |
| C–OH | 285.40 | 22.4 | C–OH | 285.53 | 15.8 |
| C–O | 286.45 | 5.5 | C–O | 286.48 | 4.3 |
C![[double bond, length as m-dash]](https://www.rsc.org/images/entities/char_e001.gif) O O |
288.01 | 7.3 | C![[double bond, length as m-dash]](https://www.rsc.org/images/entities/char_e001.gif) O O |
288.02 | 5.6 |
| π–π* | 291.25 | 2.2 | π–π* | 291.32 | 3.6 |
4. Conclusion
We report a study on the properties of MWCNTs decorated by palladium nanoparticles using Pd K-edge X-ray absorption spectroscopy in both the XANES and EXAFS regions under H2/He exposures. The results demonstrate the different characteristics between Pd NPs decorated on MWCNTs using various methods including laser ablation and chemical reduction. The FT-EXAFS spectroscopy depicts the presence of the Pd–Pd and Pd–C(O) bonds. The direct effect of H2 exposure on the palladium structure is observed to enlarge the Pd–Pd bond distance due to hydrogen adsorption. The simulation of EXAFS elucidates that the bond distance enlarges during the heating/cooling process under hydrogen exposure. Note that this parameter corresponding to the Pd–Pd bond significantly increases for PLAL against those of other techniques. On the other hand, the coordination number slightly reduces for Pd–C(O) bonds and simultaneously increases for Pd–Pd bonds, most likely due to the decomposition of the Pd–C(O) link. The variation of the coordination number of Pd–Pd in the case of PLAL is pronounced with respect to this value in the CR technique. In addition, during the first cycle of the heating/cooling process under He/H2 exposure, the Pd–Pd bond distance initially enlarges, corresponding to the excessive hydrogen adsorption, and then shrinks in the second and third cycles attributing to the reduction of hydrogen storage in Pd–MWCNTs. This phenomenon may arise from Pd NP restructuring which is confirmed by XRD where the intensity of the Pd crystalline planes varies due to the change in the preferential orientation. In addition, XPS data confirm Pd2+ and Pd4+ contents decrease after H2 exposure compared with before H2 exposure. This arises from the reduction of Pd–O–MWCNT bonds, in agreement with XAS results. On the other hand, the energy shoulder related to Pd2+ and Pd4+ decreases gradually after H2 exposure due to Pd nanoparticle aggregation. The reduction in Pd2+ and Pd4+ peak intensity after hydrogen exposure is interpreted as a reduction of the palladium oxide towards the more metallic Pd in accordance with the EXAFS findings. Consequently, the presence of palladium oxides in the synthesized samples is confirmed by both XPS and EXAFS analyses. Moreover, there is a slight peak corresponding to metal–carbon bonding before hydrogen exposure, whereas it nearly disappears after the exposure. Furthermore, there are four shoulders relating to C–OH, C–O, C![[double bond, length as m-dash]](https://www.rsc.org/images/entities/char_e001.gif) O, and π–π* before hydrogen exposure, which are shifted to a higher binding energy indicating a smaller amplitude alongside the reduction of carboxyl species just after the exposure. The deconvoluted XPS spectra of the C(1s) demonstrate the variation of surface functional groups in the Pd–MWCNTs after H2 exposure such as carboxyl, alcohol, and carbons neighboring oxygen functional groups as well as the disappearance of the Pd–C peak. The reduction of the Pd–C bond after H2 exposure is also confirmed by XAS findings.
O, and π–π* before hydrogen exposure, which are shifted to a higher binding energy indicating a smaller amplitude alongside the reduction of carboxyl species just after the exposure. The deconvoluted XPS spectra of the C(1s) demonstrate the variation of surface functional groups in the Pd–MWCNTs after H2 exposure such as carboxyl, alcohol, and carbons neighboring oxygen functional groups as well as the disappearance of the Pd–C peak. The reduction of the Pd–C bond after H2 exposure is also confirmed by XAS findings.
Conflicts of interest
There are no conflicts to declare.Acknowledgements
The authors gratefully acknowledge the financial support of the Presidential Deputy for Science and Technology, the Institute for Research in Fundamental Sciences, and the Iranian Light Source Facility for the opportunity to be users of the ALBA synchrotron program 2017 (proposal number ID 2017062241). The authors also acknowledge financial support from the Research Council of Imam Khomeini International University. Furthermore, the authors would like to thank researchers at the BL22 CALSS beamline of ALBA Synchrotron, Spain, especially Dr Carlo Marini for the Pd K-edge XAS measurements. Finally, the authors gratefully acknowledge Prof. Wolfgang Caliebe and Dr Akhil Tayal of P64 beamline at the PETRA III Light Source at Deutsches Elektronen-Synchrotron (DESY) Synchrotron in Hamburg, Germany, for scientific advice regarding data analysis and hosting Miss Anahita Taherkhani during her two months of OPEN SESAME Horizon 2020 European Project program fellowship training program. In addition, the XPS analysis by Dr. Heshmat Noei at the DESY NanoLab is acknowledged.References
- M. Balcerzak, et al., Effect of Cr on the hydrogen storage and electronic properties of BCC alloys: Experimental and first-principles study, Int. J. Hydrogen Energy, 2020, 45(53), 28996–29008 CrossRef.
- S. H. Barghi, T. T. Tsotsis and M. Sahimi, Chemisorption, physisorption and hysteresis during hydrogen storage in carbon nanotubes, Int. J. Hydrogen Energy, 2014, 39(3), 1390–1397 CrossRef.
- A. Dillon and M. Heben, Hydrogen storage using carbon adsorbents: past, present and future, Appl. Phys. A: Mater. Sci. Process., 2001, 72(2), 133–142 CrossRef.
- J. Li, H. Zhang and G. Yang, Ultrahigh-capacity molecular hydrogen storage of a lithium-decorated boron monolayer, J. Phys. Chem. C, 2015, 119(34), 19681–19688 CrossRef.
- C. Liu, et al., Hydrogen storage in carbon nanotubes revisited, Carbon, 2010, 48(2), 452–455 CrossRef.
- Z. Liu, et al., Hydrogen storage and release by bending carbon nanotubes, Comput. Mater. Sci., 2013, 68, 121–126 CrossRef.
- G. Cao, Nanostructures & nanomaterials: synthesis, properties & applications, Imperial College Press, 2004 Search PubMed.
- M. Qasemnazhand, F. Khoeini and F. Marsusi, Predicting the new carbon nanocages, fullerynes: a DFT study, Sci. Rep., 2021, 11(1), 1–14 CrossRef.
- J. J. Adjizian, et al., Platinum and palladium on carbon nanotubes: Experimental and theoretical studies, Chem. Phys. Lett., 2013, 571, 44–48 CrossRef.
- W. Cai, et al., Positive and negative effects of carbon nanotubes on the hydrogen sorption kinetics of magnesium, J. Phys. Chem. C, 2015, 119(45), 25282–25290 CrossRef.
- J. Chen, X. G. Wang and H. Y. Zhang, Hydrogen storage in carbon nanotubes prepared by using copper nanoparticles as catalyst, Applied Mechanics and Materials, Trans Tech Publications Ltd., 2013 Search PubMed.
- S. J. Henley, et al., Laser-induced decoration of carbon nanotubes with metal nanoparticles, Appl. Phys. A: Mater. Sci. Process., 2008, 93(4), 875–879 CrossRef.
- H.-S. Kim, et al., Hydrogen storage in Ni nanoparticle-dispersed multiwalled carbon nanotubes. The, J. Phys. Chem. B, 2005, 109(18), 8983–8986 CrossRef.
- Y. Liu, et al., Metal-assisted hydrogen storage on Pt-decorated single-walled carbon nanohorns, Carbon, 2012, 50(13), 4953–4964 CrossRef.
- V. M. Rao, et al., Synthesis of nickel nanoparticles on multi-walled carbon nanotubes by gamma irradiation, Radiat. Phys. Chem., 2013, 89, 51–56 CrossRef CAS.
- A. Reyhani, et al., Hydrogen storage in decorated multiwalled carbon nanotubes by Ca, Co, Fe, Ni, and Pd nanoparticles under ambient conditions, J. Phys. Chem. C, 2011, 115(14), 6994–7001 CrossRef CAS.
- A. Reyhani, et al., H2 adsorption mechanism in Mg modified multi-walled carbon nanotubes for hydrogen storage, Int. J. Hydrogen Energy, 2012, 37(2), 1919–1926 CrossRef CAS.
- J. Zheng, et al., Silver nanoparticles confined in carbon nanotubes: on the understanding of the confinement effect and promotional catalysis for the selective hydrogenation of dimethyl oxalate, Nanoscale, 2016, 8(11), 5959–5967 RSC.
- W. Liu, et al., Enhanced hydrogen storage on Li-dispersed carbon nanotubes, J. Phys. Chem. C, 2009, 113(5), 2028–2033 CrossRef CAS.
- S. Mortazavi, A. Reyhani and S. Mirershadi, Hydrogen storage properties of multi-walled carbon nanotubes and carbon nano-onions grown on single and bi-catalysts including Fe, Mo, Co and Ni supported by MgO, Int. J. Hydrogen Energy, 2017, 42(39), 24885–24896 CrossRef CAS.
- M. Ni, et al., Hydrogen storage in Li-doped charged single-walled carbon nanotubes, Int. J. Hydrogen Energy, 2010, 35(8), 3546–3549 CrossRef CAS.
- D. Astruc, Palladium nanoparticles as efficient green homogeneous and heterogeneous carbon−carbon coupling precatalysts: A unifying view, Inorg. Chem., 2007, 46(6), 1884–1894 CrossRef CAS.
- A. L. Bugaev, et al., Temperature-and pressure-dependent hydrogen concentration in supported PdH x nanoparticles by Pd K-edge X-ray absorption spectroscopy, J. Phys. Chem. C, 2014, 118(19), 10416–10423 CrossRef.
- S. Cheong, J. D. Watt and R. D. Tilley, Shape control of platinum and palladium nanoparticles for catalysis, Nanoscale, 2010, 2(10), 2045–2053 RSC.
- T. Das, et al., Nature of the Pd–CNT interaction in Pd nanoparticles dispersed on multi-walled carbon nanotubes and its implications in hydrogen storage properties, RSC Adv., 2015, 5(52), 41468–41474 RSC.
- P. Dibandjo, et al., Hydrogen storage in hybrid nanostructured carbon/palladium materials: Influence of particle size and surface chemistry, Int. J. Hydrogen Energy, 2013, 38(2), 952–965 CrossRef.
- S. Z. Mortazavi, et al., Hydrogen storage property of laser induced Pd-nanoparticle decorated multi-walled carbon nanotubes, RSC Adv., 2013, 3(5), 1397–1409 RSC.
- Y. Niu, L. K. Yeung and R. M. Crooks, Size-selective hydrogenation of olefins by dendrimer-encapsulated palladium nanoparticles, J. Am. Chem. Soc., 2001, 123(28), 6840–6846 CrossRef.
- P. Singh, et al., Enhancing the hydrogen storage capacity of Pd-functionalized multi-walled carbon nanotubes, Appl. Surf. Sci., 2012, 258(8), 3405–3409 CrossRef.
- K. Wenelska, et al., Pd nanoparticles with tunable diameter deposited on carbon nanotubes with enhanced hydrogen storage capacity, Energy, 2014, 75, 549–554 CrossRef.
- S. Banerjee, et al., Comparative evaluation of hydrogen storage behavior of Pd doped carbon nanotubes prepared by wet impregnation and polyol methods, Int. J. Hydrogen Energy, 2015, 40(8), 3268–3276 CrossRef.
- D. Bhalothia, et al., A highly mismatched NiO 2-to-Pd hetero-structure as an efficient nanocatalyst for the hydrogen evolution reaction, Sustainable Energy Fuels, 2020, 4(5), 2541–2550 RSC.
- S. Horinouchi, et al., Hydrogen storage properties of isocyanide-stabilized palladium nanoparticles, Langmuir, 2006, 22(4), 1880–1884 CrossRef CAS PubMed.
- H. Kobayashi, et al., Atomic-level Pd–Au alloying and controllable hydrogen-absorption properties in size-controlled nanoparticles synthesized by hydrogen reduction, Chem. Commun., 2009, 4806–4808 RSC.
- G. Li, et al., Hydrogen storage in Pd nanocrystals covered with a metal–organic framework, Nat. Mater., 2014, 13(8), 802–806 CrossRef CAS PubMed.
- M. Mehrabi, et al., Hydrogen storage in multi-walled carbon nanotubes decorated with palladium nanoparticles using laser ablation/chemical reduction methods, Mater. Res. Express, 2017, 4(9), 095030 CrossRef.
- M. Mehrabi, et al., Hybrid laser ablation and chemical reduction to synthesize Ni/Pd nanoparticles decorated multi-wall carbon nanotubes for effective enhancement of hydrogen storage, Int. J. Hydrogen Energy, 2018, 43(27), 12211–12221 CrossRef CAS.
- M. Mehrabi, et al., Surface structural alteration of multi-walled carbon nanotubes decorated by nickel nanoparticles based on laser ablation/chemical reduction methods to enhance hydrogen storage properties, Int. J. Hydrogen Energy, 2019, 44(7), 3812–3823 CrossRef CAS.
- S. Bellucci, et al., X-ray Absorption and Magnetic Circular Dichroism in CVD Grown Carbon Nanotubes, Materials, 2019, 12(7), 1073 CrossRef CAS.
- H.-W. Chang, et al., Nanoflaky MnO 2/functionalized carbon nanotubes for supercapacitors: an in situ X-ray absorption spectroscopic investigation, Nanoscale, 2015, 7(5), 1725–1735 RSC.
- S.-X. L. Luo, et al., Electrocatalytic Isoxazoline–Nanocarbon Metal Complexes, J. Am. Chem. Soc., 2021, 143(27), 10441–10453 CrossRef CAS PubMed.
- A. Osorio and C. Bergmann, Evaluation of iron-containing carbon nanotubes by near edge X-ray absorption technique, Radiat. Phys. Chem., 2015, 115, 164–170 CrossRef CAS.
- Y. Peng, et al., Probing the influence of the center atom coordination structure in iron phthalocyanine multi-walled carbon nanotube-based oxygen reduction reaction catalysts by X-ray absorption fine structure spectroscopy, J. Power Sources, 2015, 291, 20–28 CrossRef CAS.
- V. Shmatko, et al., Interaction between NiOx and MWCNT in NiOx/MWCNTs composite: XANES and XPS study, J. Electron Spectrosc. Relat. Phenom., 2017, 76–80 CrossRef CAS.
- V. Shmatko, et al., X-Ray Spectral Studies of the Interface Interaction in CuOx/MWCNTs Nanocomposite, Opt. Spectrosc., 2018, 124(4), 478–482 CrossRef CAS.
- D. Sivkov, et al., The structure and chemical composition of the Cr and Fe pyrolytic coatings on the MWCNTs’ surface according to NEXAFS and XPS spectroscopy, Nanomaterials, 2020, 10(2), 374 CrossRef CAS PubMed.
- N. Yuan, et al., Probing the evolution of palladium species in Pd@ MOF catalysts during the Heck coupling reaction: an operando X-ray absorption spectroscopy study, J. Am. Chem. Soc., 2018, 140(26), 8206–8217 CrossRef CAS PubMed.
- A. R. Mouat, et al., Synthesis of supported Pd0 nanoparticles from a single-site Pd2+ surface complex by alkene reduction, Chem. Mater., 2018, 30(3), 1032–1044 CrossRef CAS.
- S. K. Singh, Y. Iizuka and Q. Xu, Nickel-palladium nanoparticle catalyzed hydrogen generation from hydrous hydrazine for chemical hydrogen storage, Int. J. Hydrogen Energy, 2011, 36(18), 11794–11801 CrossRef CAS.
- T. Ishida, et al., Efficient Decarbonylation of Furfural to Furan Catalyzed by Zirconia-Supported Palladium Clusters with Low Atomicity, ChemSusChem, 2016, 9(24), 3441–3447 CrossRef CAS PubMed.
- J. Keating, et al., Elucidation of structure and nature of the PdO–Pd transformation using in situ PDF and XAS techniques, Phys. Chem. Chem. Phys., 2013, 15(22), 8555–8565 RSC.
- N. Yuan, et al., In situ XAS study of the local structure and oxidation state evolution of palladium in a reduced graphene oxide supported Pd (ii) carbene complex during an undirected C–H acetoxylation reaction, Catal. Sci. Technol., 2019, 9(8), 2025–2031 RSC.
- B. L. Mojet, et al., Coordination of palladium on carbon fibrils as determined by XAFS spectroscopy, J. Chem. Soc., Faraday Trans., 1997, 93(24), 4371–4375 RSC.
- S. Watanabe, et al., Spectroscopic and first-principles calculation studies of the chemical forms of palladium ion in nitric acid solution for development of disposal of high-level radioactive nuclear wastes, AIP Adv., 2018, 8(4), 045221 CrossRef.
- O. Lupan, et al., PdO/PdO 2 functionalized ZnO: Pd films for lower operating temperature H 2 gas sensing, Nanoscale, 2018, 10(29), 14107–14127 RSC.
- J.-X. Tang, et al., Screw-like PdPt nanowires as highly efficient electrocatalysts for methanol and ethylene glycol oxidation, J. Mater. Chem. A, 2018, 6(5), 2327–2336 RSC.
- Z. Zhang, J. Lu, B. Zhang, W. Shi, Y. Guo and F. Cui, Insight into the size effect of Pd nanoparticles on the catalytic reduction of nitrite in water over Pd/C catalysts, Environ. Sci.: Nano, 2020, 7(7), 2117–2129 RSC.
- C. Chiang and J. Yang, Flame Retardance and Thermal Stability of Polymer/Graphene Nanosheet Oxide Composites, Fillers and Reinforcements for Advanced Nanocomposites, Elsevier, 2015, pp. 253–272 Search PubMed.
| This journal is © the Owner Societies 2023 |

