
 Open Access Article
 This Open Access Article is licensed under a Creative Commons Attribution-Non Commercial 3.0 Unported Licence
Latent spaces for antimicrobial peptide design†
Samuel Renaud and
Rachael A. Mansbach*
and
Rachael A. Mansbach*
Physics Department, Concordia University, 7141 Sherbrooke Street West, Montreal, Quebec H4B1R6, Canada. E-mail: re.mansbach@concordia.ca
First published on 16th February 2023
Abstract
Current antibacterial treatments cannot overcome the rapidly growing resistance of bacteria to antibiotic drugs, and novel treatment methods are required. One option is the development of new antimicrobial peptides (AMPs), to which bacterial resistance build-up is comparatively slow. Deep generative models have recently emerged as a powerful method for generating novel therapeutic candidates from existing datasets; however, there has been less research focused on evaluating the search spaces associated with these generators from which they sample their new data-points. In this research we employ five deep learning model architectures for de novo generation of antimicrobial peptide sequences and assess the properties of their associated latent spaces. We train a RNN, RNN with attention, WAE, AAE and Transformer model and compare their abilities to construct desirable latent spaces in 32, 64, and 128 dimensions. We assess reconstruction accuracy, generative capability, and model interpretability and demonstrate that while most models are able to create a partitioning in their latent spaces into regions of low and high AMP sampling probability, they do so in different manners and by appealing to different underlying physicochemical properties. In this way we demonstrate several benchmarks that must be considered for such models and suggest that for optimization of search space properties, an ensemble methodology is most appropriate for design of new AMPs. We design an AMP discovery pipeline and present candidate sequences and properties from three models that achieved high benchmark scores. Overall, by tuning models and their accompanying latent spaces properly, targeted sampling of new anti-microbial peptides with ideal characteristics is achievable.
1 Introduction
Growing antibiotic resistance is a major threat to global health, turning infections that were once easy to treat into life-threatening illnesses.1,2 Such rapidly increasing resistance to traditional antibiotic regimens has led to the necessity of finding new and unique treatment methods.3 One possible recourse is the use of antimicrobial peptides (AMPs),4,5 which have been identified within the innate immune systems of a multitude of species, including humans, and which act to modulate the proliferation of infectious diseases.6 AMPs comprise a candidate class of short proteins, generally no longer than 100 amino acids and often much shorter.7 Many of them preferentially partition onto prokaryotic (bacterial) over eukaryotic (mammalian) cell membranes and cause bacterial cell death through destabilization of the membrane and expulsion of the intracellular contents.8,9 Because of the indiscriminate manner with which they attack an integral part of the cell, build-up of resistance to AMPs is relatively slow. Databases of around 10![[thin space (1/6-em)]](https://www.rsc.org/images/entities/char_2009.gif) 000 discovered AMP sequences,10–13 have been made publicly available, but there remains significant need for further cataloging and disparate analyses.
000 discovered AMP sequences,10–13 have been made publicly available, but there remains significant need for further cataloging and disparate analyses.
One tool of growing importance in the arsenal of the biomolecular designer is generative deep learning, a subset of deep learning.14 Deep learning, in which a computer optimizes the parameterization of a neural network model in a data-rich regime, has become a powerful player in recent years by leveraging the increasing amounts of scientific data and the phenomenal growth in computational power over the last decades. Neural networks are formed by connecting simple functional units known as “perceptrons” through their inputs and outputs to form complex function approximators. Non-linear activation functions between the linear operations increase model representational capacity at the cost of having to solve a non-convex optimisation task.15 Generative deep learning in specific refers to the use of a model trained from a large body of data to sample new datapoints from an underlying probability distribution intended to mimic as closely as possible that of the training data. One particular variety of generative deep learning model demonstrating competitive performance in the sphere of biomolecular design is the variational auto-encoder (VAE) and its variants,16,17 in which data points are explicitly embedded in a smooth, continuous “latent space” that can function as a search space for optimization.18
In the past five years, there has been an explosion of research in the field of deep generative models for small molecule drug design.18–22 Most work in this area has, until now, has been focused on the design of small molecules, with only a few studies on the design of short peptides,23–25 but in the last year or two research in this area has begun to grow.23 For example, Das et al.23 constructed a Wasserstein Autoencoder (WAE) model that formed a complete pipeline for de novo protein design and identified two sequences with potent antimicrobial activity against E. coli. In another paper by the same team,24 they created a tool, (IVELS), for analysing VAE models, throughout the training process, with which they could select models that perform best. Two other relevant recent studies have reported on the use of an Long Short-Term Memory (LSTM) model to design peptides with experimentally-verified activity against multi-drug resistant pathogens, and the use of generative Recurrent Neural Networks (RNNs) to design non-hemolytic AMPs.26,27
One primary point of interest that is beginning to attract attention is the quality of the latent space itself. Because in data-rich regimes, VAEs and other generative models can be extremely powerful, the focus in past work has been primarily on improving performance.19,28–32 However, construction of an interpretable and well-organized latent space not only tends to make targeted feature sample generation easier, it also significantly improves the ability of the user to apply domain expertise to the problem at hand. Therefore, although we do not ignore model performance, a major focus of this article is on interpretability, trustworthiness, and organization of the latent spaces themselves.
In work by Gómez-Bombarelli et al.,18,31,33 the authors demonstrated that training a property predictor on the latent space and forcing the model to consider the quality of its predictions as part of its overall goal leads to an ordering of the latent space, which is desirable for generating candidates with particular features. Because latent spaces tend towards dimensionalities on the order of 30 or above, this orderedness has been visually presented through projection onto a two-dimensional space, often by using principal components analysis (PCA) to identify the most relevant variables. Since PCA is a linear projection, it remains unclear how well this visual orderedness is preserved in the high-dimensional space, and therefore we make a point to address the trustworthiness of this simple, rapid, and useful analytic technique.
While previous methods have focused on the longer proteins that represent a larger fraction of the known proteome this research focuses on small antimicrobial peptides (AMPs). Much of the previous work discovering protein embeddings with deep neural networks has used large latent space representations34–36 to maximize data throughput or graph-based representations which require the use of graph neural networks to process the protein graphs. In this work we emphasize small latent representations and model interpretability in order to construct interpretable search spaces for AMP design.
More generally, in this article, we focus on the question of latent space quality and interpretability for the relevant test case of generation of novel antimicrobial peptide sequences. We train five different deep generative models with VAE-like latent spaces and assess and compare their different behaviors in terms of reconstruction accuracy, generative capacity, and interpretability. We demonstrate that, as expected, a property predictor leads to an ordering in the latent space. We quantify this ordering and assess how well a PCA projection captures the properties of the original latent space. We argue that the better the PCA projection, the more interpretable the latent space, because we can apply a ranking to linear combinations of the latent space dimensions, allowing us to more easily identify bridge variables that tell us what the model considers important. We also show that the models are capable of generating unique and diverse sequences that grow more AMP-like in specific regions of the latent space.
2 Methods
We trained five different models of three different latent-space sizes on a dataset of approximately 300000 short peptides. In the following sections, we describe and justify the dataset and its properties, the model architectures and the training procedure with relevant hyperparameters.
2.1 AMP dataset construction
The datasets used in this study are a subset of peptides from the Uniprot database,37 composed of 268195 short peptide sequences with a maximum sequence length of 50 residues, combined with a set of 35806 sequences from the StarPep database, which features short bio-active peptides.38 We restrict our training set to sequences of lengths 2–50 amino acids because a significant majority of AMPs are short peptides with length <50, and 85% of the peptides featured in StarPep are between 2 and 50 amino acids long.39 Preliminary testing demonstrated that retaining peptides up to 100 amino acids in length led to worse performance, presumably due to the heightened sparsification of the dataset in that regime.
Out of the total 45120 peptides in the StarPep database, 13437 of them are labelled as having antimicrobial properties (Fig. S2†). StarPep aggregates bioactive peptides from over 40 existing datasets featuring peptides with sequence lengths between 2 and 100 amino acids. After removing from the dataset the 15% of the peptides featured in StarPep with sequence lengths greater than 50 amino acids and peptides with non-standard amino acids, we retained 35806 of the original 45120 sequences, of which 10841 are labelled as having antimicrobial properties. The remaining 24965 peptides from Starpep did not have the label antimicrobial.
Although certain deep learning algorithms can perform well when trained on “smaller” datasets of tens of thousands of datapoints,26,27 these are more typically classifiers rather than generators. When we trained our models on the 35806 datapoints from the StarPep database alone, we found that the models demonstrated poor reconstruction accuracy, low robustness, and high error. One method for solving this is to pretrain on a large corpus and fine-tune on a smaller one; however, we chose instead to train all at once on a larger corpus, as has previously been done for natural language models and chemical language models.18–22
Since preliminary analysis on the StarPep database sequences indicated that 35806 was not a large enough dataset to properly train our generative VAE-based models, we expanded the dataset by adding negative examples from Uniprot. After executing the query [(length:[2 TO 50]) AND (keyword:(KW-0929))], we found 714 of unreviewed peptide sequences with the label “antimicrobial” and, placing “NOT” before the keyword, found 3713736 of unreviewed peptide sequences without the label “antimicrobial”. We also found 1108 of reviewed peptide sequences with the label “antimicrobial” and 11941 reviewed peptides without the label “antimicrobial”. Since we would not have been able to significantly expand our dataset by using solely reviewed sequences, we choose to include some non-reviewed sequences. We recognize that in the worse case it is possible that this may include a potentially substantial number of AMPs that have not been identified as such. We considered the possibility of utilizing an existing sequence predictor for AMPs to identify these possibly unlabeled AMPs; however, we decided against it to avoid introducing unknown assumptions into the data at this stage. Instead we consider a different goal for ordering the space. We employ a property predictor that classifies as hits peptides with experimentally-verified antimicrobial properties (which we label with integer 1) and as misses peptides without experimentally-verified antimicrobial properties (which we label with integer 0) and demonstrate that training such a predictor enforces an ordering of the space that allows generation of AMP-like sequences.
To avoid having a prohibitively small percentage of experimentally-verified AMPs in the dataset and to match the sizes of datasets used in previous experiments with similar architectures, we subsampled 10% of the 3 million unreviewed datapoints of Uniprot and selected 268195 to form an additional set of datapoints. Subsampling was done at random, subject to the constraint of retaining a roughly equal number of peptide sequences of each length to ameliorate the extent to which the models focused on this aspect, though there are fewer very short sequences due combinatoric constraints (Fig. S9†).
Together the 268195 peptides from Uniprot and 35806 from StarPep form our full dataset of 304001 peptides, of which 10841 were labeled “verified AMPs” (all from StarPep) and 293160 were labeled “non-verified-AMPs” (a mixture of Uniprot and Starpep sequences). We note here again that we only labeled those sequences as AMPs that are experimentally verified as such. Although this could introduce a bias into the property predictor from the unreviewed sequences, we believe that this choice is justified because our goal is not to classify sequences but to order the space in a sensible manner. After ensuring there was no sequence redundancy between the merged datasets, we inspected various physicochemical properties of the “verified AMP” and “non-verified-AMP” labeled data sets to ensure they represented a broad distribution over peptide sequence space and had largely similar distributions of various physico-chemical properties (Fig. S10–S19†).
2.2 Deep learning models
Deep generative models are powerful research tools for de novo drug design. Throughout the training process these models can construct smooth latent space embeddings. Once fully trained the learned latent spaces can be explored, and information-rich clusters can be identified. Such continuous latent spaces allow users to sample and decode novel molecules with desirable features.We investigated five different deep learning architectures applied to the task of generating new peptide sequences from a learned distribution, all of which incorporate a variational autoencoder (VAE) element, along with a VAE-like latent space.
The variational autoencoder is a model introduced in Kingma and Welling16 that combines an “encoder” and a “decoder” to form a variational inference model. In specific, given a dataset with a marginal likelihood pθ(x), the objective of the VAE is to learn the parameter set {θ} that most closely reproduces the data's distribution p(x).17,40,41 VAEs operate under an evidence lower bound (ELBO) maximization objective that leads to a joint maximisation of the marginal likelihood pθ(x) and a minimization of the Kullback–Leibler (KL) divergence of the decoder-approximated posterior qϕ(z|x) from the true posterior pθ(z|x), where z represents the embedding variables of the latent space and pθ(z) is the latent space prior, which for the standard VAE is a Gaussian distribution.
There are multiple types of generative models; the two most well-known and often-used are VAEs and Generative Adversarial Networks (GANs). We choose to employ VAE-based models because VAEs boast a number of properties of particular relevance for our specific case of developing smooth, interpretable latent spaces with potential use as search spaces for computer-aided biomolecular design. In comparison to GANs, VAEs have a more natural formulation of an associated latent space, with a rigorous mathematical derivation from Bayesian probability theory.17 The assumption of a Gaussian prior enforces a certain level of smoothness and continuity that is desirable in a design space, and allows for the sampling of Gaussian distributions “near” any defined point in the space. Finally, on a practical note, they have demonstrated utility in the field of de novo small molecule design,18 and we wanted to determine their utility for sequence-based AMP design as well. VAE's also feature an encoder which can directly map new samples of interest to their respective latent vectors, a feature not present, out of the box, in GAN architectures.
The architectures in this research all feature a latent space comparable to that of a VAE, which in theory should constitute the minimal explanation of the data. It is also desirable for the latent space to be ordered in such a way that it is understandable or interpretable for a subject-matter expert. This latent space is used to interpret the model's latent mapping of inputs from the prior distribution. The latent space also allows for visualisation of embeddings and feature clustering of proteins.
In what follows, we introduce the VAE models and their unique differences. Briefly the RNN, RNN-Attention and Trans-VAE models all employ the typical VAE bottleneck with mean (μ) and log of the variance (σ) network layers while the AAE and WAE employ unique loss functions which regularize the latent space to match a set distribution.
We started with three publicly available models modified from work by Dollar et al.,28 in which the authors compared a recurrent neural network (RNN), a RNN with an attention layer and a Transformer to assess their respective capabilities for generating SMILES strings describing novel molecular compounds for drug design. The models all made use of a VAE architecture that generated smooth latent spaces. The results demonstrated the benefits of including self-attention to deep generative models, and the authors concluded there is a trade-off between variational models in terms of their ability to properly reconstruct input data and their ability to embed complex information about the inputs into a continuous latent space. We modified these three models to take as input and output sequences of up to fifty amino acids rather than SMILES strings. In addition, we derived two more models, an adversarial autoencoder (AAE),42 and a Wasserstein autoencoder (WAE),43 by modifying the latent spaces and architectures of the original three.
The RNN model (Fig. 1A) is a traditional VAE featuring a Gated Recurrent Unit (GRU)-based Recurrent Neural Network (RNN) as the encoder and as the decoder.44 The RNN model first embeds the input sequences into fixed length vectors of length 128. The embedded vectors are then passed to the GRU, with N = 3 layers, that generates a hidden layer vector of length 128. The hidden layer is layer-normalized and sent to two separate linear layers, the mean layer (μ) and the log-variance layer (σ). The linear layers act as the “bottleneck” and changes – where necessary – the GRU output shape to the appropriate latent space vector shape – either 32, 64 or 128 dimensions, depending on which architecture is being trained. The mean and logvar output are then combined according to the reparametrization trick and Gaussian noise is added.16 A ReLU unit followed by a layernorm is then applied to the noisy memories. The resulting vector is sent to the decoder GRU. The decoder outputs a 128 dimensional hidden vector that passes through a layernorm. Finally, this hidden vector is sent through a linear layer that generates token predictions. All models except the Transformer implement a GRU with teacher forcing during training. Teacher forcing passes the true sequence to the decoder along with the latent vector and improves training stability by removing the requirement of learning entire sequences and instead prohibits the accumulation of errors on individual tokens.
 | ||
| Fig. 1 Schematic of the five deep learning model architectures, highlighting their similarities and differences. The RNN (A) features a GRU encoder, a variational latent space and a GRU decoder. The RNN-Attention (B) inserts an attention layer after the encoder GRU and uses convolutional layers as input and output from the variational latent space. The AAE (C) features a non-variational latent space but inserts a discriminator network at the latent space. The WAE (D) also features a non-variational latent space but calculates the maximum mean discrepancy between Gaussian noise and the encoder generated latent space. The Transformer (E) model implements the generic architecture with a first self-attention layer then a convolutional layer into the latent space followed by deconvolution into the masked attention and the final self-attention layer. | ||
The Adversarial Autoencoder (AAE) model (Fig. 1B) uses the same GRU model as the RNN but exchanges the re-parameterized latent space proposed in Kingma and Welling16 for an adversarial counterpart Makhzani et al.42 As proposed in ref. 42 this model regularizes the latent space with an attached neural network, named the discriminator, that matches the aggregated posterior q(z) to the desired prior p(z), which in this model is a Gaussian prior. The discriminator is a fully connected network with 256 hidden layers, each with a fixed hidden vector of size 640. The encoder network acts as the embedder for the decoder and the “generator” for the discriminator. The decoder learns to reconstruct original data, as in the RNN model case, and the discriminator discriminates between an ideal prior, modeled by a vector filled with normally distributed noise as a proxy for a Gaussian prior, and the current latent vector. This model is hypothesised to perform well on reconstruction tasks given the relative success of adversarial models on the task of image generation.45,46
The WAE model proposed in Tolstikhin et al.43 introduced a new family of regularized autoencoders under the name Wasserstein Autoencoders that minimize the optimal transport Wc(p(x), p′(x)), where p(x) is the true data distribution and p′(x) is the generative model data distribution, for a cost function c. The WAE's regularizer, computed as part of the overall loss function, forces the continuous mixture  to match the prior p(z) instead of forcing each input to match the prior as done in the VAE, where qϕ(z|x = xi) for all input i in x. The WAE constructed in this work (Fig. 1C), uses the MMD penalty for prior regularization.47 The WAE implemented uses the same model as the RNN but exchanges the split latent space with a single linear layer. The regularization is performed in the loss function, where the inverse multi-quadratic kernel basis function is used and the MMD is computed between this latent vector and a vector with values sampled from a normal distribution.
The RNN-Attention (RNN-Attention) model (Fig. 1D), attaches a single self-attention head after the GRU of the RNN model to leverage the attention mechanism.48 The attention mechanism allows a model to store sequence wide connection weights between tokens in a sequence. Each token in the sequence is made to “attend” and give a weight to all other tokens in the sequence thus creating an attention map over all the tokens in the sequence. The single attention layer has been shown to increase interpretability and improve reconstructions over longer sequences.28
The VAE-Transformer (Transformer) model (Fig. 1E), integrates a VAE reparameterization into a full Transformer model as proposed in Vaswani et al.49 and implemented in Dollar et al.28 Transformers have taken the world of sequence2sequence learning by storm and have demonstrated their abilities to create extended relationships between sequence tokens that can be readily interpreted through attention head visualisations.50–52 The Transformer no longer makes use of the GRU and instead first sends the inputs to a self attention head layer that outputs attention weights that are matrix multiplied onto the output vector. The output is then sent to a convolutional bottleneck that filters over the joined attention weights and embedded sequence before sending the output to the mean and log-variance linear bottleneck layers which reduce the dimensionality of the latent vector to one of 32, 64 or 128 dimensions. Once the VAE section is passed and noise has been added to the latent vector the result is sent back to a convolutional layer followed by the masked attention and source attention layers as originally outlined in Vaswani et al.49
All models feature an associated property predictor in the form of a binary classifier that predicts whether the latent representation of a given peptide is an verified-AMP or not. This classifier is a two layer fully connected neural network trained with a binary cross-entropy loss that is joined to the KL-divergence loss and the peptide reconstruction accuracy loss of each model.
2.3 Model training procedure and hyperparameter configuration
The different subsets were collated into a total dataset with 304001 peptides with lengths between 2 and 50 amino acids. This total dataset was split into a 80–20, train-test split, resulting in a training set of 243201 training sequences and a test set of 60800 sequences. The model hyperparameters were set to be identical for all 15 models and their three respective latent dimensions. We fixed the parameters to maintain consistency between the different models and allow authentic comparison of the fully trained networks. The RNN, RNN-Attn and Transformer feature a Kullback–Leibler divergence annealing term β (see Table 1). β starts small and increases in weight as training progresses to avoid posterior collapse. Batch Sizes of 200 were found to be ideal in that they fit on the NVIDIA Tesla P100 graphics cards used for training and results in good performance. 300 epochs was found to be an appropriate number by a posteriori inspection of the loss curves.
| Hyperparameter | Value |
|---|---|
| Batch size | 200 |
| β final | 5 × 10⁻² |
| β initial | 1 × 10⁻⁸ |
| Adam learning rate | 3 × 10⁻⁴ |
| Epochs | 300 |
Model training hyperparameters are outlined in Table 1.
3 Results
We assess and compare the models and their associated latent spaces in a number of ways. We begin by performing a traditional assessment through model reconstruction accuracies on the training and testing datasets. To assess the generalizability of the models, we benchmark their generative capacities in terms of the distributions they are capable of sampling, a process which is becoming more and more imperative as generative models become more commonplace.19,28 To assess the meaningfulness of associated distance metrics, we perform a quantitative and qualitative assessment of the models' ability to cluster the data in a low-dimensional space produced by principal components analysis (PCA) and a detailed analysis of the top five principal components. To assess model interpretability and address a longstanding problem in the field, we employ metrics from manifold theory to assess the extent to which PCA distorts the latent space embedding. Leveraging PCA's enhanced interpretability we connect latent representations to peptide properties through bridge variables. Finally, we demonstrate the use of our models in a pipeline. Unless otherwise noted, all analyses are performed on the test set data.3.1 Verification of model reconstruction accuracy
We verify the basic performance of the five trained models through two metrics that demonstrate the ability of the models to recapitulate the input data as they were trained to do. We consider the position-based reconstruction accuracy and the overall sequence reconstruction accuracy.In Fig. 2, we plot the average position-based reconstruction accuracy 〈Racci〉 versus amino acid index for the five models and for three different latent space sizes, and, in Fig. 3, we plot the entire-sequence accuracy. The position-based reconstruction accuracy measures the model's ability to predict the correct amino acid at a given index in the sequence and is defined as,
 | (1) |
 | ||
| Fig. 2 The position-based average reconstruction accuracies, Racci with corresponding confidence intervals for the five models. The x-axis refers to the token position along the sequence, running from the first generated token to the last generated token. Each model features three variants with latent space sizes of 32, 64 or 128 dimensions, respectively. Error bars are 95% confidence intervals on the respective index-wise means computed with the assumption of Bernoulli sampling. As expected, model performance decreases with distance along the sequence in most cases. | ||
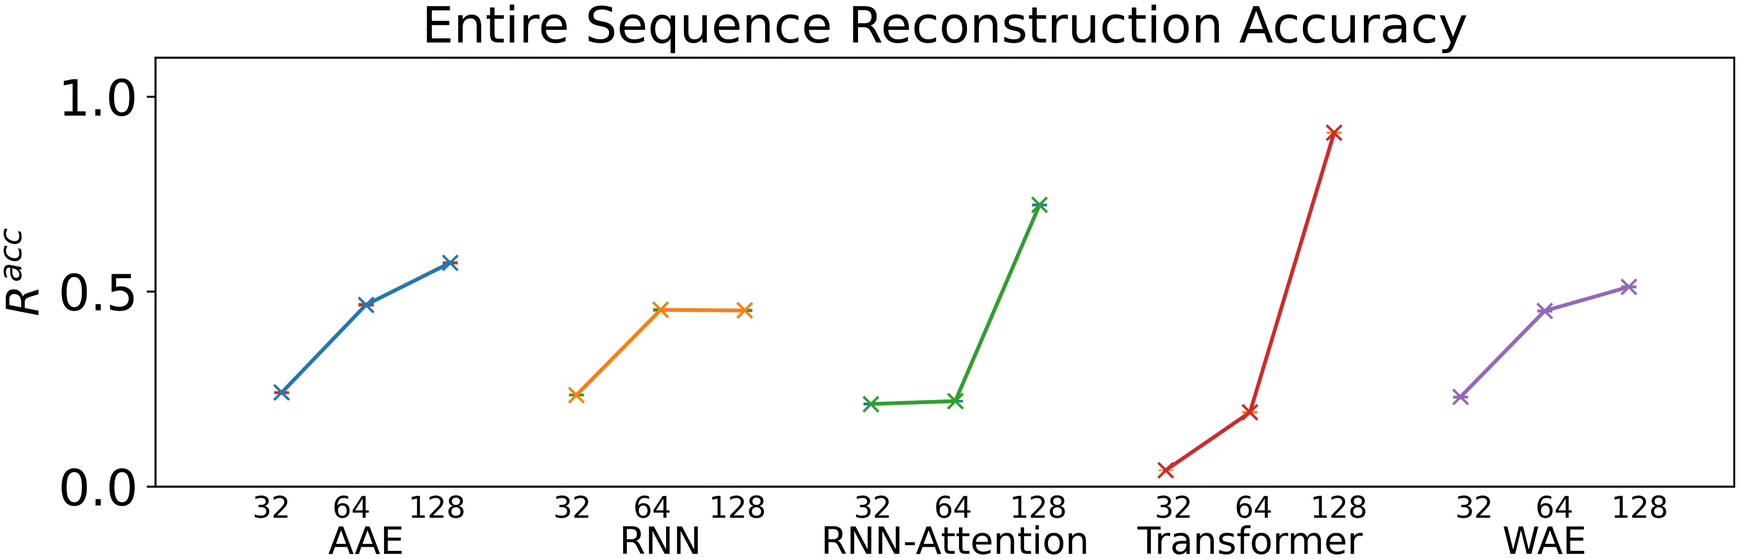 | ||
| Fig. 3 The entire-sequence reconstruction accuracies, Racc for the five models and their respective three latent space size variants. Error bars are 95% confidence intervals on the mean computed with the assumption of Bernoulli sampling. All error bars are less than 0.5% from sampling 20000 sequences. | ||
The mean overall sequence accuracy 〈Racc〉 is a measure of how many full sequences the model was able to correctly reconstruct in their entirety,
 | (2) |
Models of 64 dimensions or greater generally display moderate to high performance on the reconstruction task. They exhibit an accuracy of at least 60% for tokens up to position twenty (Fig. 2), of interest because most AMPs have sequence lengths of under twenty amino acids. The entire-sequence reconstruction accuracy (Fig. 3), is between 50% and 70% for the 128-dimensional AAE, RNN, RNN-Attention, and WAE, and about 97% for the Transformer, although reconstruction accuracy diminishes with decreasing latent space dimensionality.
It is of interest to note that in all models except the 128-dimensional Transformer, we observe an almost monotonic decrease in reconstruction accuracy for tokens later in the sequence. All 32 dimensional models, except the Transformer approach the accuracy of a random guess (5% for any one of twenty possible amino acids) near the 50th position. This clear length-dependent effect on accuracy is expected behavior arising from the increasing difficulty of the predictive task for each successive token position: the prediction depends primarily on the previous tokens in the sequence, leading to a compounding error effect. The difficulty of this task is also exacerbated by model training with teacher forcing, which corrects mistakes earlier in the sequence during training but not during testing. The 128-dimensional Transformer clearly has the capacity to represent and retain entire sequences in a holistic manner, as it was intended to do.
Indeed, the Transformer model achieves by far the highest accuracy (97%, 128 dimensions) but is also most affected by a diminishing latent dimensionality: the mean accuracy drops precipitously from 97% to 26% when going from 128 dimensions to 64 dimensions, whereas the AAE and the RNN both achieve nearly 50% reconstruction accuracy with 64 dimensions. All models display increasing accuracy with increasing dimensionality. All attention based models display a greater improvement when increasing from a dimensionality of 64 to a dimensionality of 128 than when increasing from a dimensionality of 32 to a dimensionality of 64.
3.2 Analysis of top principal components quantifies differences in the latent space
It has been shown that the simultaneous training of a property predictor on a latent space leads to a desirable “ordering” of that space visually identified in the top principal components. Although there are many such dimensionality reduction techniques available, we employ PCA here because it provides an interpretable and invertible mapping to a visualization-friendly space and has been previously used in the field of de novo molecular generation.18 In this section, we identify ordering in the top principal components (PCs) in our models and go one step further by quantifying the extent of the ordering and the PCs in which it appears.We employ a simple binary classifier trained to predict whether or not a given sequence falls within the experimentally validated AMPs category, or the unvalidated category. Although such a predictor can be of use in terms of assessing the specific properties of some given sequence of interest, in this case we use it rather as a tool to order the space such that we may expect interpolation between points in the latent space to generate sequences with desirable properties. In other words, for our case the property predictor primarily functions to ensure that the neighboring points of an experimentally-verified AMP in the latent space will display similar properties. We can consider this to be a way of enforcing a meaningful distance metric and quantifying how well we have done so. In Sec. 3.4, we will also address the question of how meaningful it is for us to identify this “ordering” in a linear projection rather than in the full latent space.
After model training with the binary classifier, we perform principal components analysis on the associated latent space of each model (32-dimensional, 64-dimensional, or 128-dimensional, respectively) and project into the top five highest-variance components of the PCA decomposition. Based on previous studies that employed PCA for two-dimensional projections, we expected to observe latent space ordering–that is a partitioning of the data points according to the label predicted by the property predictor – in the top one or two principal components of each model. To our surprise, this was not the case (Fig. 5). Further investigation revealed at least some ordering in one or two of the top five principal components for 4/5 of the models. The fifth model, the RNN-Attn, performs so poorly we do not expect to observe ordering no matter how many PCs we analyze. This indicates that despite being explicitly “instructed” – via the loss function – of the importance of the verified-AMP/non-verified-AMP labeling, most models do not “pay attention” to this to the exclusion of other characteristics of the sequences. We may quantify this idea further by investigating the fractional variance explained by different PCs as a proxy for the amount of information contained. When the extent to which these different components capture the overall latent space variance is assessed (Fig. S3†), we observe that the models differ significantly in how much fractional variance explained (FVE) is contained within the top five PCs, ranging from only about 10% in the Transformer-128 model to over 40% in the AAE-128 model. The more variance is contained within the top five PCs, the more it seems to be concentrated in the first PC—AAE, RNN demonstrate a much more significant drop from PC1 to PC2 compared to the other three models—overall we observe. Trends are largely independent of latent space dimensionality. In general, the Transformer and WAE models of various sizes contain the least FVE in their top five components, whereas the AAE models contain the most. We observe that in all models other than the Transformer, PC1 is correlated with molecular weight or length (see Sec. 3.4), with all other variances being of roughly equivalent magnitudes. Overall, we may interpret this as telling us that the models place greatest importance on length, while other descriptive variables, even those we attempt to emphasize a priori, are assigned similar levels of importance.
We quantitatively assess the extent to which the clusters of AMPs and non-AMPs are separated from one another in the model latent spaces and pairs of the top five principal components (Fig. 4). We do so through the use of the Silhouette score53 applied to the known labeling of the dataset peptides, which is a well-known metric for assessing cluster distinctness.
 | (3) |
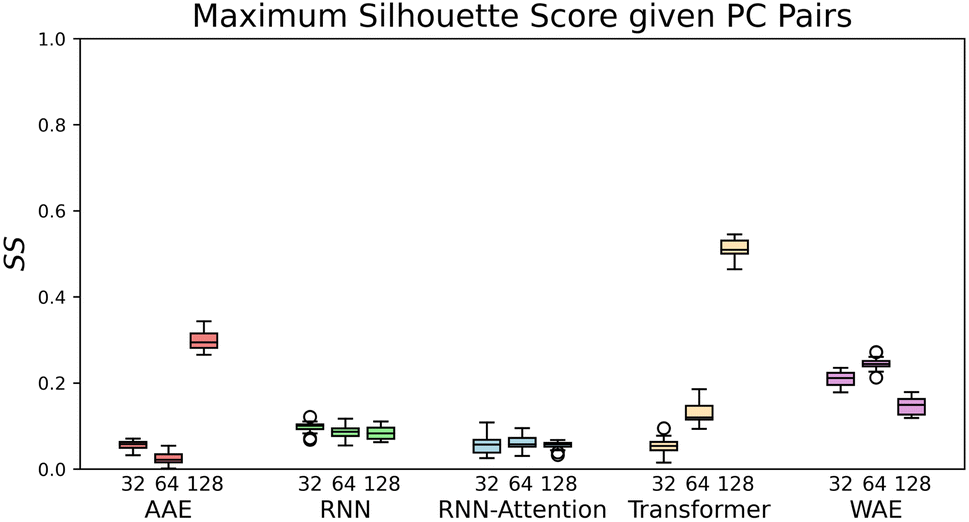 | ||
| Fig. 4 The maximal Silhouette scores, SS, for the five models with corresponding three latent sizes. Silhouette scores are shown for the principal components pairs featuring the largest score of the top five PCs calculated with PCA (see Fig. S4† for Silhouette scores of all pairs of top five PCs). The PC combinations from left to right are, AAE: [2,3], [1,5], [3,4], RNN: [4,5], [1,2], [1,2], RNN-Attention: [3,4], [3,4], [2,3], Transformer: [1,5], [2,4], [1,3], WAE: [2,5], [2,4], [2,5]. The error bars are generated by bootstrapped sampling of the latent space and calculating a 95% confidence interval computed with the assumption of Bernoulli sampling. The flier points indicate outliers from the interquartile range of the whiskers. | ||
We use the Silhouette score as our metric because its boundedness gives it a natural interpretation in this context. Scores that are too close to zero indicate that no clustering has occurred, whereas scores too close to one indicate a disconnected latent space, which might mean the model had failed at satisfying the Gaussian prior. Ideally, therefore, we would observe moderate Silhouette scores, and indeed we do. The silhouette score for each PC pair is calculated by taking subsamples of PC pair vectors and computing their Silhouette score relative to the known verified-AMP/non-verified-AMP properties. Once this has been computed for all pairs of PC's [1–5] we then find the pair that has the highest silhouette score.
If we rank the models by maximum Silhouette score in all pairs of the top five PCs, the Transformer and AAE perform the best, reaching a maximum of SS = 0.51 ± 0.02 for the Transformer at 128 dimensions, and a maximum of SS = 0.3 ± 0.03 for the AAE at 128 dimensions, in PC's [1,3] and PC's [2,3] respectively, with both of them demonstrating moderate maximal clustering ability and an increase in clustering ability with latent space dimensionality. The WAE demonstrates poorer performance, displaying a maximum of SS = 0.24 ± 0.02 in PC's [2,4] at 64 dimensions this performance is largely independent of latent space dimensionality. The RNN and RNN-Attention demonstrate the worst abilities as measured by the Silhouette score, with a maximum of SS = 0.1 ± 0.02 in any of the top five PCs for the RNN and SS = 0.02 ± 0.02 for the RNN-Attention.
To better visualize the latent space, in Fig. 5, we plot the test set of sequences embedded in the reduced latent representation for each model and color the scatter points according to whether they feature verified-AMPs (orange), or non-verified-AMPs (blue), characteristics. We observe an agreement between the Silhouette scores previously discussed and the visual clustering in the scatter plots. The AAE-128 and Transformer-128 models form more distinct clusters than the other models, though all clusters still overlap as desired.
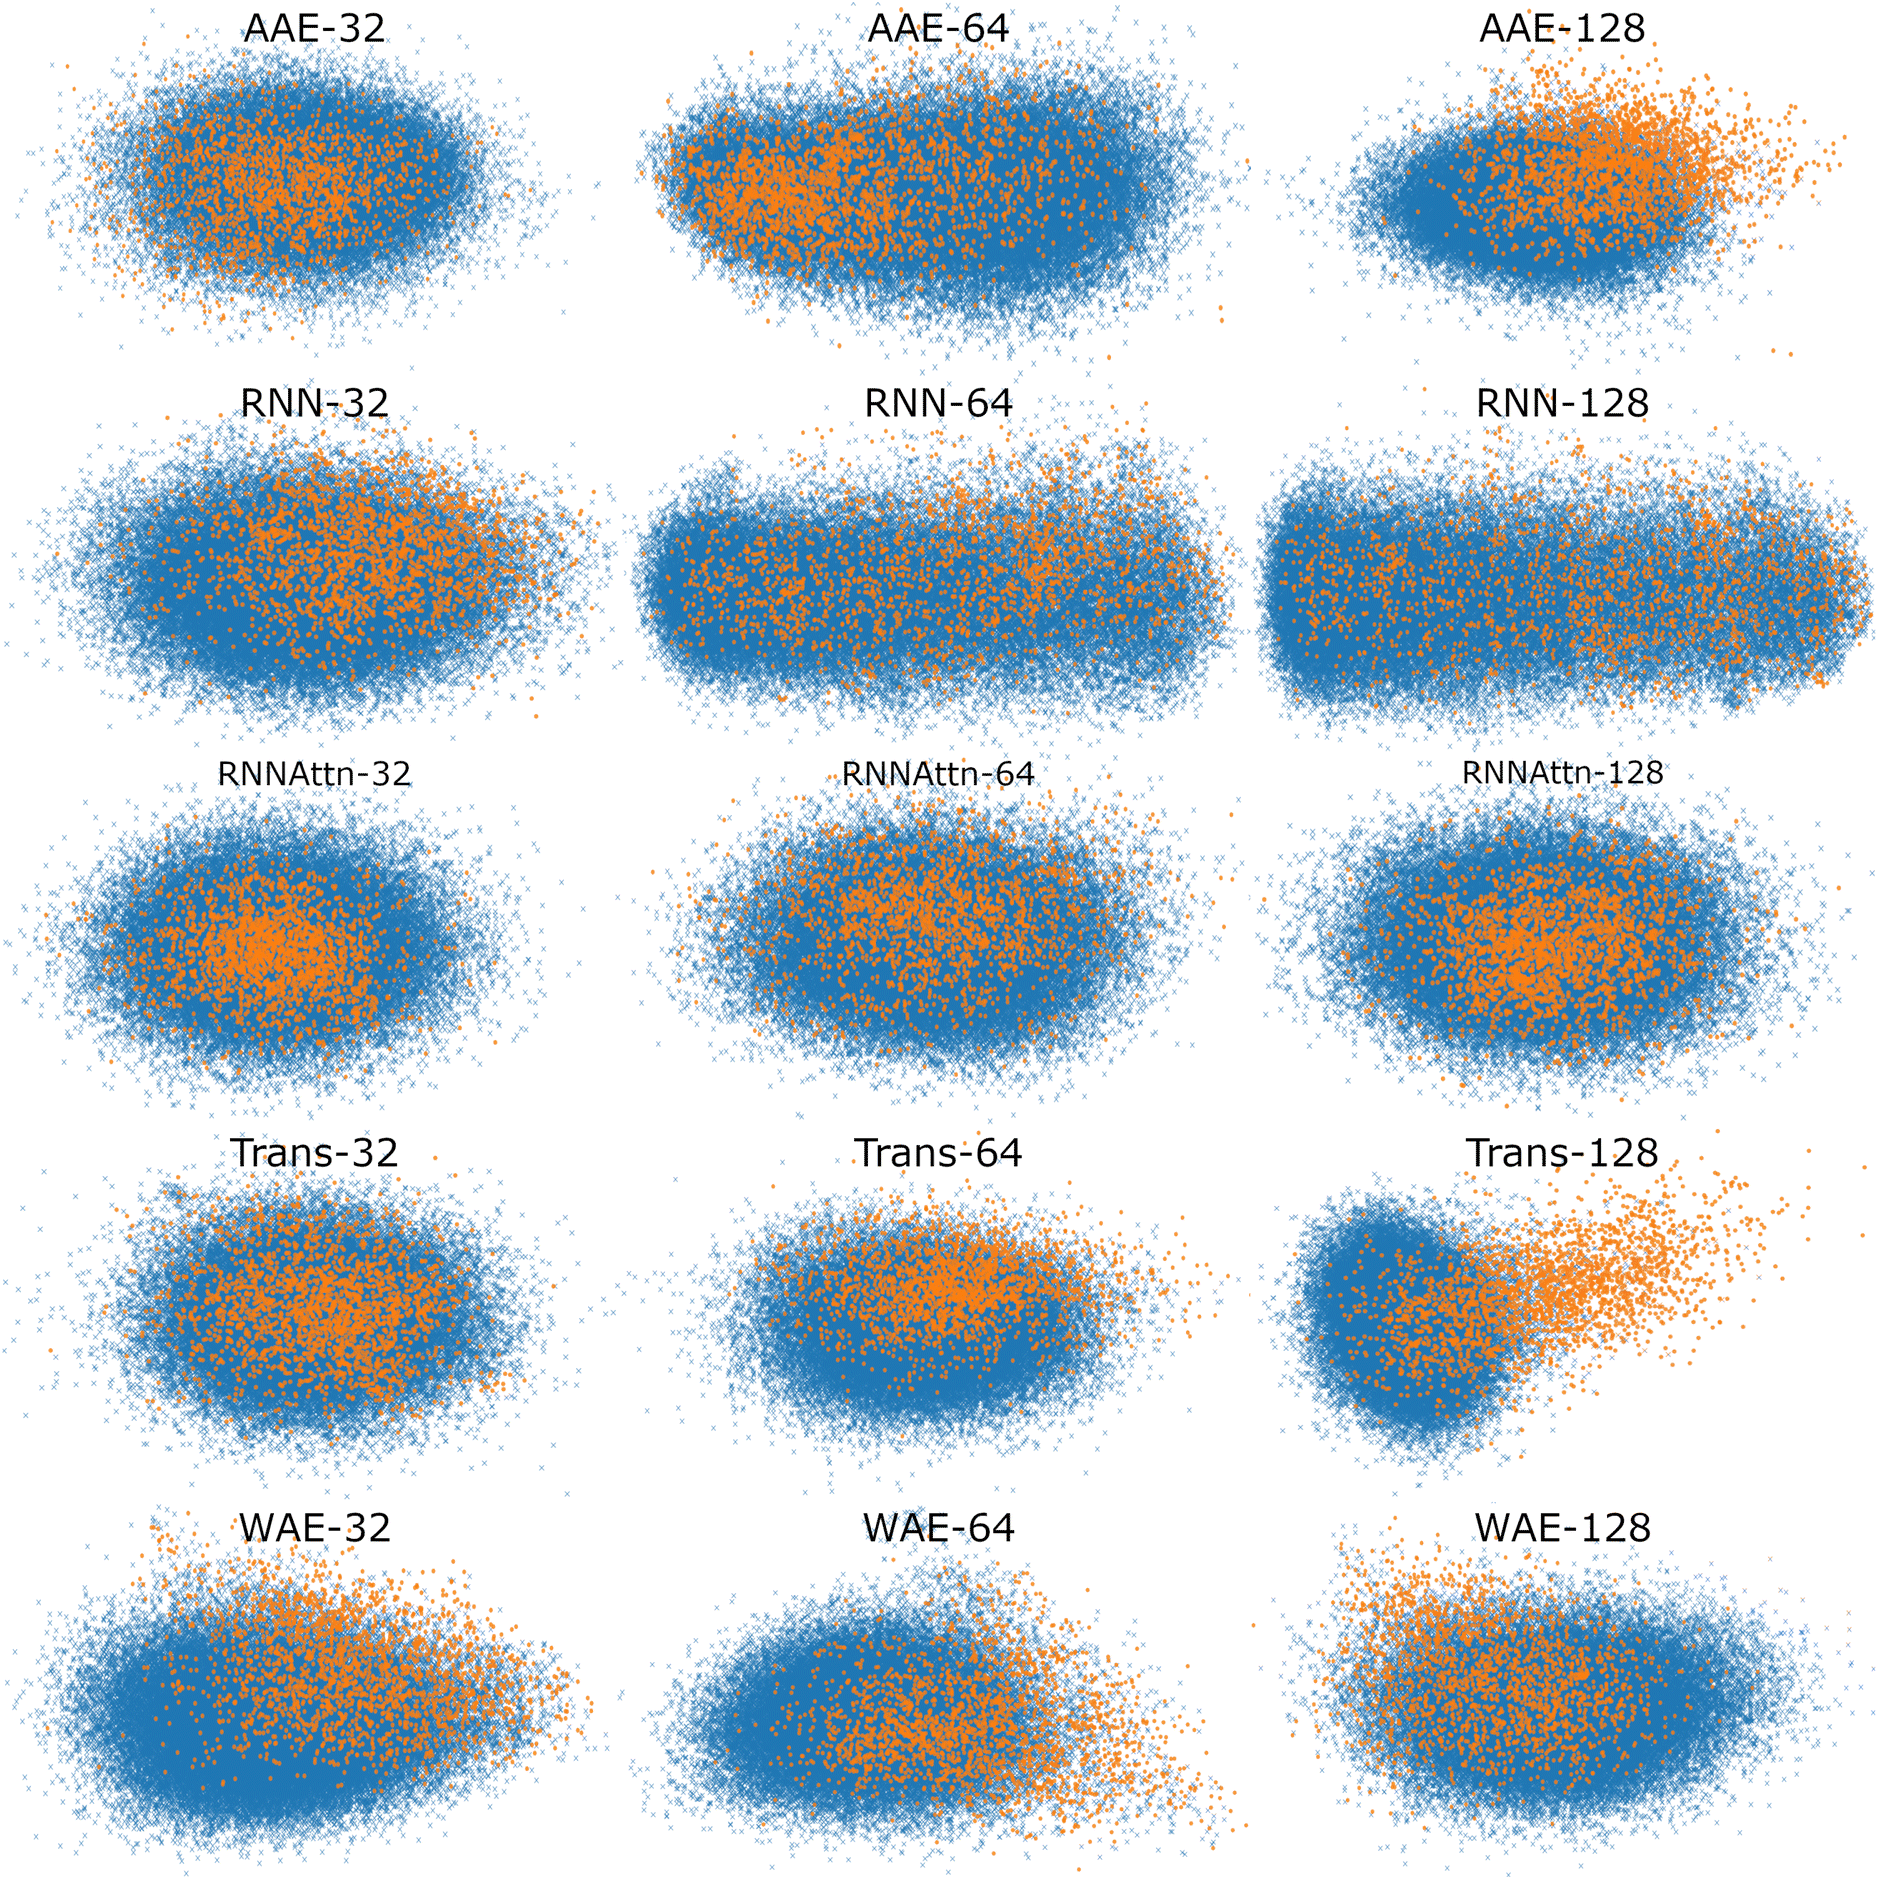 | ||
| Fig. 5 Scatter plot of maximally AMP-separating PCs presented as a visualization of the different latent spaces. We embed the test sequences into the latent space, perform PCA, and illustrate the PC pair corresponding to the largest Silhouette score (cf.Fig. 4). The PC combinations are as follows, AAE: [2,3], [1,5], [3,4], RNN: [4,5], [1,2], [1,2], RNN-Attention: [3,4], [3,4], [2,3], Trans-former: [1,5], [2,4], [1,3], WAE: [2,5], [2,4], [2,5]. Orange points denote verified-AMP sequences, and blue points denote known non-verified-AMP sequences. Different models correspond to different visible separations in the latent space, though most models demonstrate at least some separation of AMPs and non-AMPs. | ||
In summary, the latent spaces of the models were found to exhibit ordering. We quantified the ordering with the Silhouette score. Surprisingly, we found that AMP correlations are not always present in the first or second PC pairs and as such it is important to investigate downstream PCs before ruling out potential correlations in the model latent space. Once a correlation has been identified, the variance explained per PC can serve as an approximate weight factor indicating the importance attributed to this ordering by the model. For the 128-dimensional AAE, summing the variance of the two top PCs, this is about 10%; for the 128-dimensional Transformer, it is about 4%.
3.3 Latent space sampling and generative performance evaluation
Reconstruction accuracy and clustering of test set embeddings are both useful metrics to ensure that model training is proceeding as expected; however, a more important question for a generative model is whether it is capable of accurately recapitulating the underlying distribution of the data and whether the resultant overall distribution associated with the latent space is appropriate for novel data generation. In this section, we demonstrate the capacity of the model to generate unique and diverse AMP sequences in localized portions of the latent space.In contrast to the previous section, where we focused on PC pairs, in this section, for ease of calculation and visualization, we employ only a single variable per model variant. We choose the principal component (PC) having the largest Silhouette score with verified-AMP/non-verified-AMP labeling (see Fig. 9A and further discussion of PC identification in Sec. 3.4). We identify the “width” of the latent space by calculating the mean and standard deviation over the embedded sequences. Then we sample from ten evenly spaced regions that form a “line across” the latent space, limiting the min and max values of the region centers to ±4 times the standard deviation. The random sampling performed in each region follows a normal distribution with the mean determined by the region center and the standard deviation set to 20% of the standard deviation of the latent space. For external validation on a large number of generated sequences – difficult to perform experimentally – we assess in each neighborhood the probability of generating AMPs ρAMP (Fig. 6) by employing a previously published QSAR model. AMPlify is a deep neural network AMP classifier that has been shown to achieve 93.71% accuracy on the task of AMP classification.54
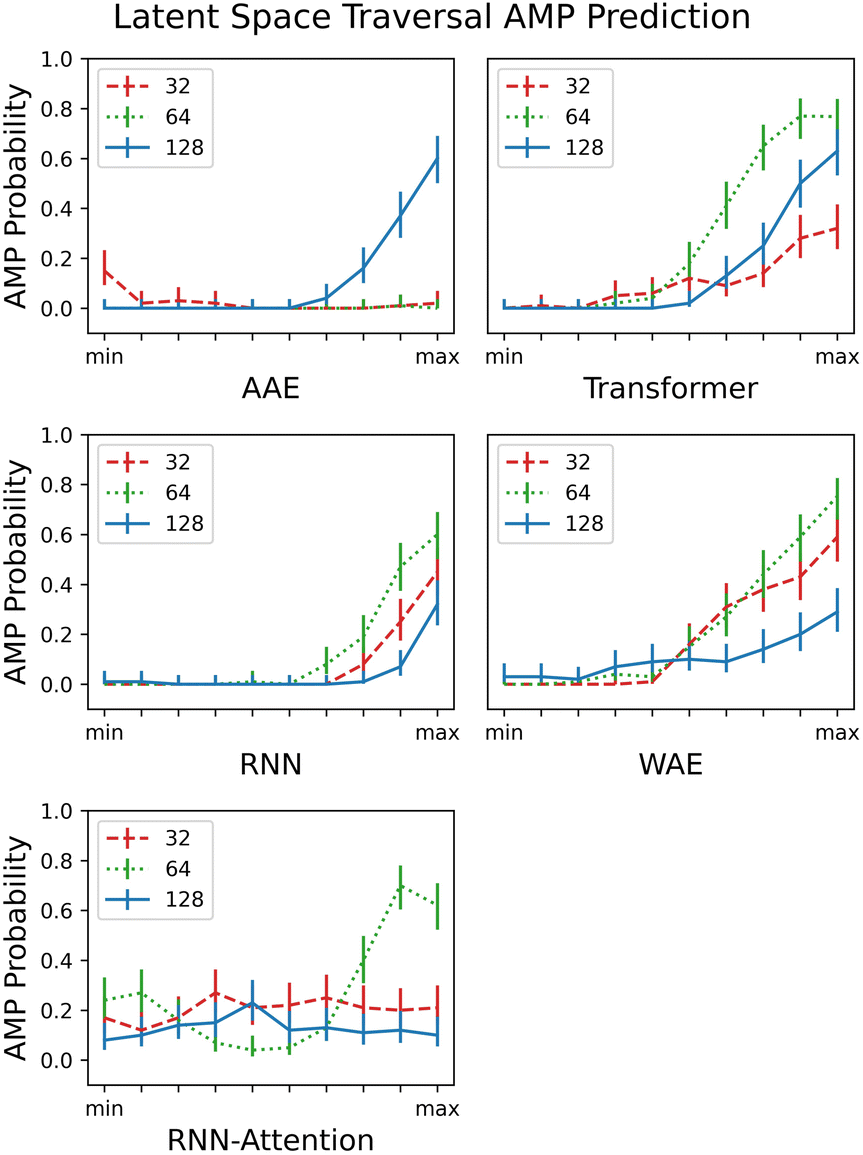 | ||
| Fig. 6 Traversing the PC's with highest AMP correlation from the smallest embedded value of each PC (min) to the largest embedded value (max), scaled to the same axis for comparison. The AMPlify QSAR 48 classifier54 is a binary classifier that returns true or false and an average AMP probability is taken over the 100 local samples. All 5 models and their respective latent dimension variants are plotted. The error bars are generated by calculating a 95% confidence interval on the AMP probabilities computed with the assumption of Bernoulli sampling. | ||
As in the previous section, where we demonstrated clustering of the test set embedded in the latent space, we expected to observe partitioning of each PC into areas of low and high AMP probability, and indeed in most cases we did. Because the task given to the models by the property predictor was essentially one of partitioning but there was no constraint on the manner in which to perform the partitioning, a partitioning of the latent space in any direction is equally expected; that is, higher probability of AMPs could be localized in various different areas across the PC.
We observe little or no (ρAMP < 0.4 for all tested values) partitioning for the 32- and 64-dimensional AAE and RNN-Attention. We observe a semi-linear partitioning – as the PC is increased or decreased, an area of zero AMP probability is followed by a monotonic, almost linear rise in probability – for all other models except the 128 dimension RNN-Attention. Interestingly, the 64 dimensional RNN-Attention model shows a non-linear partitioning of its space with a region of high AMP probability, even though the PCA visualisation and the silhouette score for this model did not demonstrate a clustering of AMPs in its latent space. Thus, we show that predicting experimentally-verified antimicrobial properties, even though many of the non-hits may also be AMP-like in nature, is in many cases sufficient to partition the space into regions of high and low antimicrobial peptide probability in general.
We next evaluate the local properties of the latent space as we interpolate across the individual PCs. In addition to demonstrating generative partitioning in the latent space, we assess the following quantities in each neighborhood and take a global average across the neighborhoods to gain a general understanding of latent space properties in the vicinity of the AMPs: (i) sequence similarity ρsim, and (ii) Jaccard similarity of 2-mers (J2) and 3-mers (J3) in the sequence.
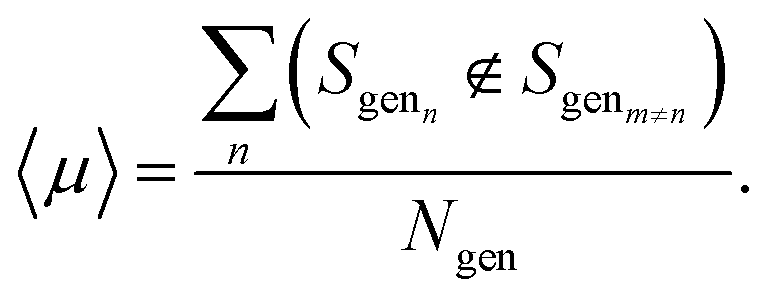
We assess the ability of the model to generate sequences that are dissimilar to one another through the uniqueness,19 〈μ〉, which we compute as an average probability by generating a random sample si of 100 sequences and counting the number that are distinct from one another,
 | (4) |
We compute the pairwise similarity between all generated sequences in the neighborhood using the pairwise2 command from the Biopython55 package, with the Blosum62 (ref. 56) substitution matrix as the scoring function. Pairwise similarity is measured by identifying an optimal sequence alignment from bioinformatics arguments and then computing the scores of amino acids that exhibit matching physicochemical classes.
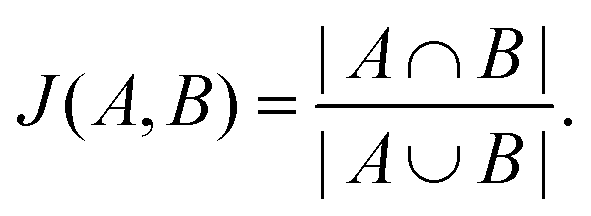
The Jaccard similarity of two sets is defined as follows,
 | (5) |
We assess the Jaccard similarity between all pairs of peptides in the local neighborhood by considering the sets of overlapping k-mers that describe the sequence, where a k-mer of a peptide is a subsequence of length k, and the spectrum of k-mers has previously been demonstrated to contain significant information about AMP properties.57 We consider k-mers of lengths two and three in this analysis. 0 ≤ J(A,B) ≤ 1 by design, and a Jaccard similarity of zero implies that two sequences share no subsequences of length k whereas a Jaccard similarity of one implies that two sequences are composed of identical subsequences.
The sequence similarity score is a relative evaluation based on the Blosum62 matrix scores, whereas the Jaccard similarity score is an absolute measure of the similarity between two sequences where identical sequences return a score of one. It should be noted, however, that the number of matches grows more quickly than the size of the set – i.e. the numerator of the Jaccard score grows more quickly than the denominator. This means that a comparatively low Jaccard score can still indicate a reasonable amount of similarity. Very roughly, for the 2-mers, a Jaccard score of 0.06 is the expected value for two random sequences of length 50, and it is significantly lower than that for the 3-mers.
The size of the latent space is not seen to have a drastic impact on the sequence similarity of peptides found in a local neighbourhood for any of the models. An interesting dynamic is displayed for the some models, in which as the center of the latent space is approached the samples become slightly more diverse. This is seen by the “U” shape seen especially in the RNN, and WAE models. This is likely due to the Gaussian nature of the space packing more peptides near the center thus increasing sampling diversity.
The Jaccard similarities for the 2-mers and 3-mers are rather low, but still significantly higher than would be predicted by random chance (Fig. 7). Due to the nature of the Jaccard score, this indicates a balance between shared and dissimilar fragments, particularly for the Transformer model. The 128 dimensional Transformer has significantly higher 2-mer and 3-mer similarity scores, from 0.24 to 0.34 for 2-mer, and 0.11 to 0.26 for 3-mer, than all other models <0.22. This is a good indication that local points in the space share similar constituent sequence fragments. Interestingly, we observe heightened similarity for the RNN and WAE models in the region corresponding to heightened AMP probability (i.e. towards the PC maximum value), whereas for the Transformer-128, the trend is opposed: there is a region of heightened similarity near the minimum corresponding to a low probability of AMP-like sequence generation, and a region of somewhat lower probability near the maximum corresponding approximately to the region of heightened probability of AMP-like sequence generation.
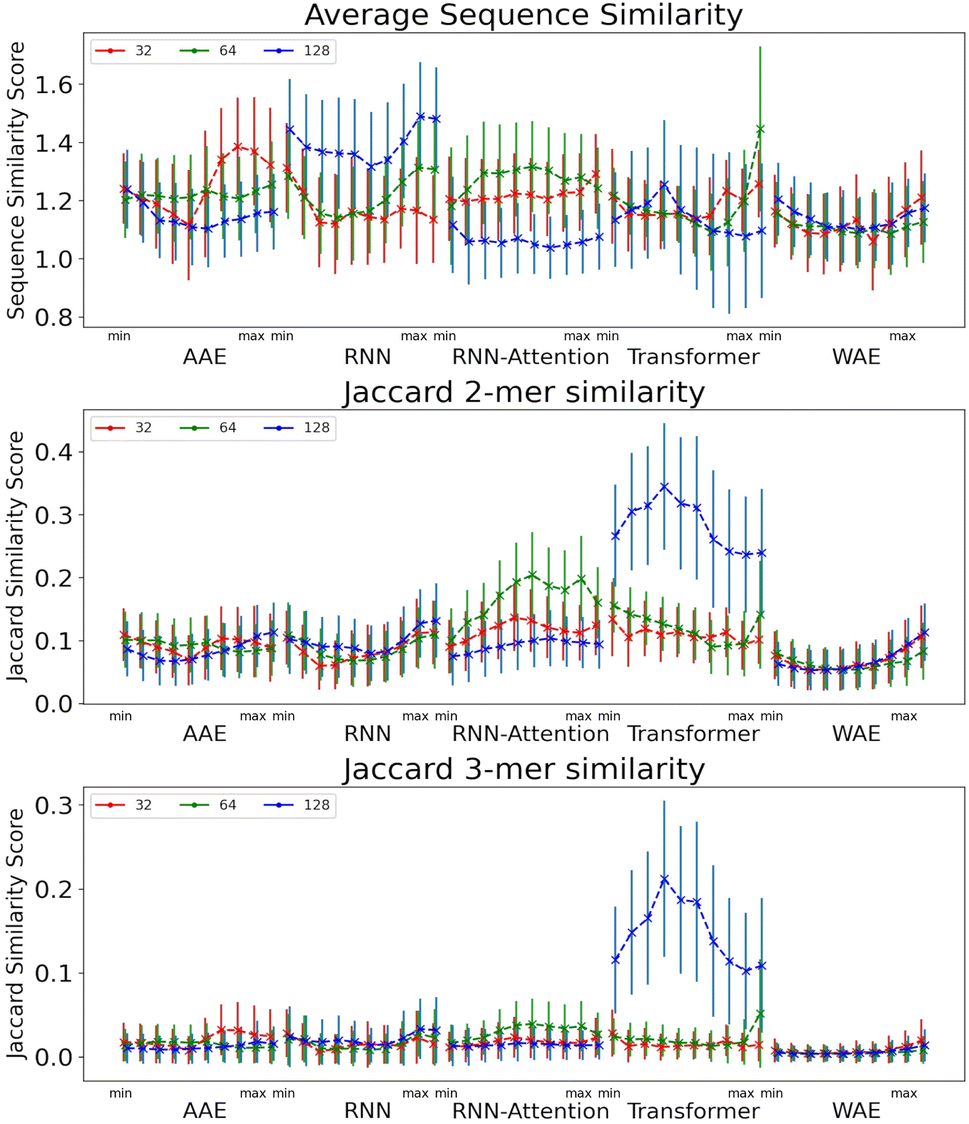 | ||
| Fig. 7 Metrics evaluating the generative capacities of models near AMPs in the latent space. The average sequence similarity (top), the Jaccard similarity of the k-mers for k = 2 (middle) and the Jaccard similarity of the k-mers for k = 3. The error bars are one standard deviation from the mean. Peptides are generated by sampling from the PC with highest AMP correlation from minimum to maximum value. | ||
Overall, most models perform similarly when reconstructing peptides in a local neighbourhood and this applies to both entire sequences and local k-mer segments. In Sec. 6.1 in the ESI,† we also show that the models generate disparate peptides not found in the testing or training sets, as desired.
3.4 Model interpretability through linearity and bridge variables
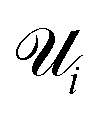
A perennial and very difficult problem to solve in deep learning is the question of how to interpret what the model is learning. We address this issue in the following manner: by recognizing that PCA performed on the latent space both creates a lower-dimensional representation which is more easily visualized and also creates a ranking of linear superpositions of the latent dimensions, we argue that a latent space that is less distorted by a PCA analysis is a more interpretable one, and we assess the models on this basis. This also addresses the question of how meaningful the observation of ordering in a linear projection of the latent space is, which, as far as we are aware, has not previously been addressed in the literature. Finally, we consider a set of physicochemical variables of interest and identify potential “bridge variables” associated with different PCs, to aid in their interpretation.We measure PCA distortion of the latent space with four metrics: trustworthiness  , continuity
  , steadiness
  , and cohesiveness
  .58 Trustworthiness is a measure of the introduction of false neighbors and the loss of true neighbors by a point k when projected from high to low dimensions,
 | (6) |
 is the set of points that are not neighbours in the original space but are now neighbors in the reduced space and r(i,j) is the rank of the sample j according to its distance from i in the original space.
Continuity is a measure of the introduction of false members into a group–a cluster of points–or the loss of true members from a group when projected from high to low dimensions,
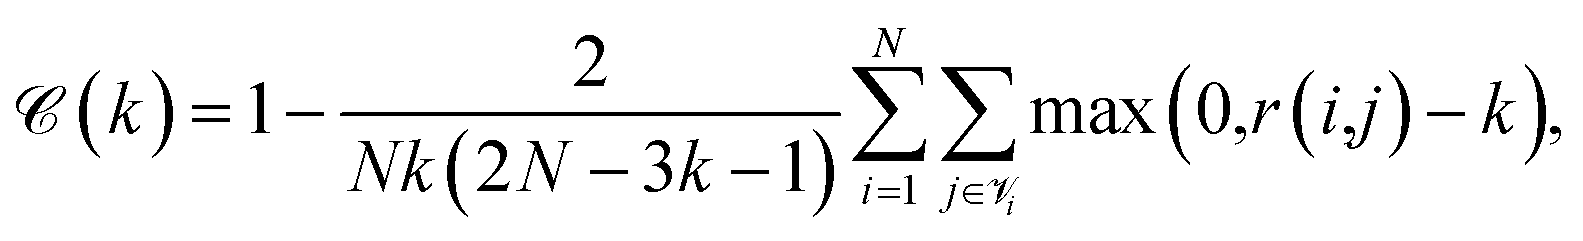 | (7) |
 is the set of points that are neighbours in the original space but are no longer neighbors in the reduced space.
Steadiness is a measure of the loss of existing groups, and cohesiveness is a measure of the introduction of false groups. Briefly, the steps to calculate the steadiness and cohesiveness are outlined below. We direct the interested reader to Jeon et al.58 for further details. First, one computes the shared-nearest neighbor distance between points in the original space and in the projected space and constructs a dissimilarity matrix identifying compression and stretching of point pairs. Then average partial distortions are computed by randomly extracting clusters from one space and evaluating their dispersion in the opposite space. Once such partial distortions are known one can aggregate the results into steadiness and cohesiveness,
 | (8) |
 | (9) |
For all models except the Transformer, scores are >0.5 for all four metrics, and the scores tend to hover around 0.75, with some exceptions (Fig. 8). While the 128-dimensional Transformer performs best according to the steadiness score (∼0.8), the Transformer model in general performs worse on all other metrics than the other models, particularly cohesiveness, for which all three Transformer models perform worse than any other model, and in particular the 128-dimensional Transformer displays an exceedingly poor performance of just over 0.25.
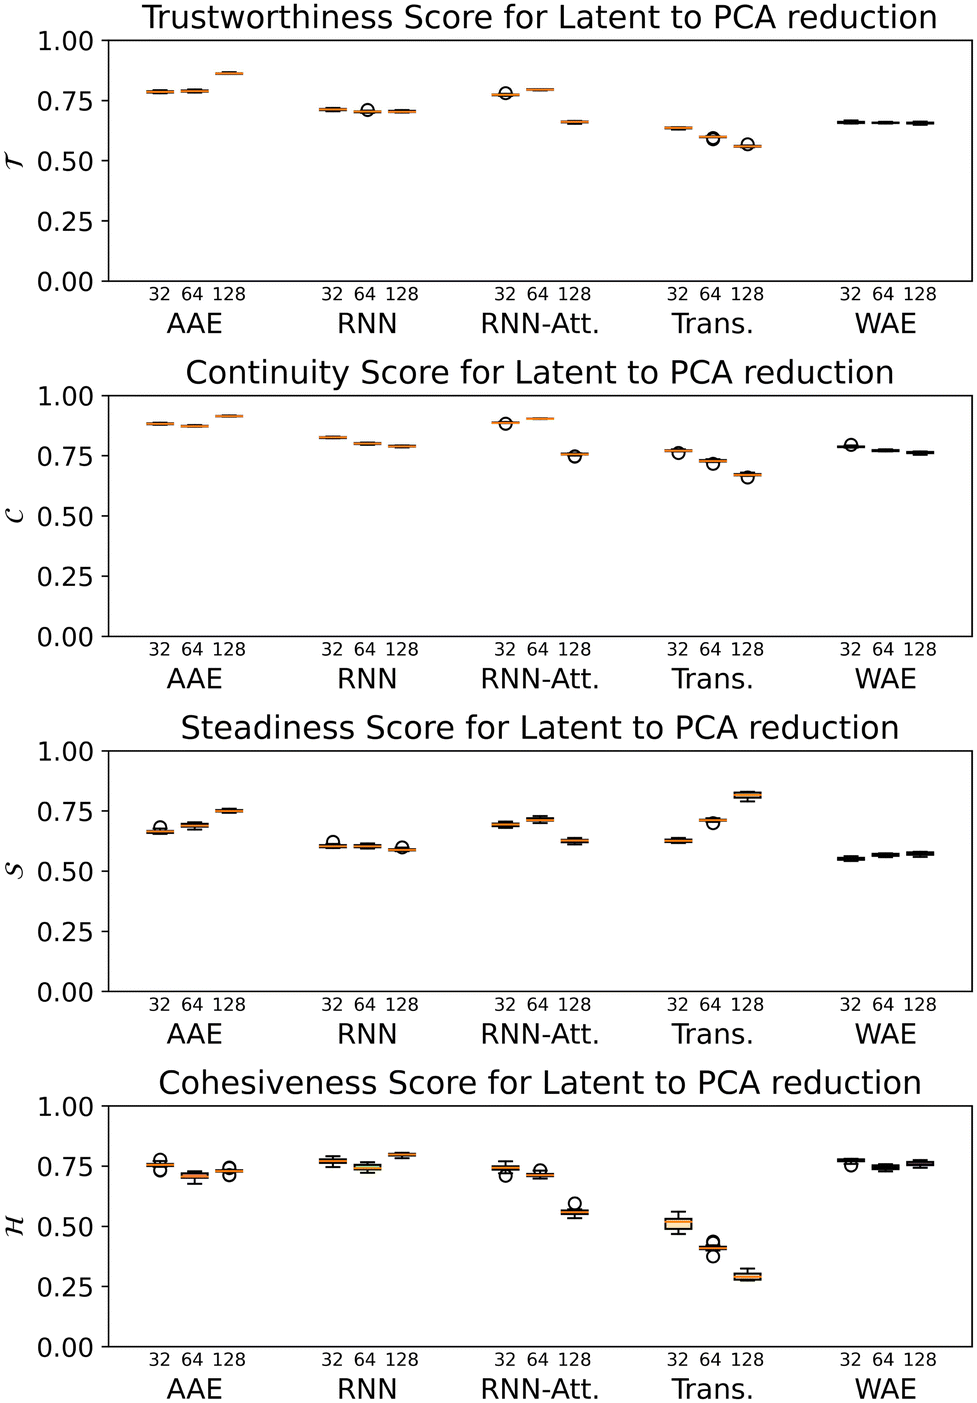 | ||
Fig. 8 The trustworthiness  , continuity , continuity  , steadiness , steadiness  and cohesiveness and cohesiveness  projection scores for the five models and three corresponding latent space size variants. The error bars are generated by bootstrapped sampling of the latent space and calculating a 95% confidence interval. The flier points indicate outliers from the interquartile range of the whiskers. projection scores for the five models and three corresponding latent space size variants. The error bars are generated by bootstrapped sampling of the latent space and calculating a 95% confidence interval. The flier points indicate outliers from the interquartile range of the whiskers. | ||
Overall we observe it is possible to construct linear projections of model latent spaces with comparatively low overall distortions; however, the model that has thus far performed particularly highly on other metrics (the 128-dimensional Transformer) has the greatest distortion, particularly in terms of cohesiveness, meaning it potentially introduces a significant number of false groupings. The Transformer's comparatively high distortion overall underscores one of the traditional trade-offs of machine learning: with greater power comes lessened interpretability.
Now that we have an idea of how confident we may be in the representation of the PCs for the model latent space, we investigate the identification of “bridge variables” for further interpretation of the latent space. Bridge variables are known quantities of relevance in a scientific problem that show correlations with unknown variables, allowing heightened interpretability of many nonlinear problems.59 We consider a series of physicochemical properties of peptides that are measurable from sequence alone: aliphatic index, Boman index, isoelectric point, charge pH = 3, charge pH = 7, charge pH = 11, hydrophobicity, instability index, and molecular weight. We measure each of these properties for the test set sequences using the peptides python package.60 We employ the Silhouette score in one dimension to measure correlation between individual PCs and verified-AMP/non-verified-AMP labeling, and we use the Pearson correlation coefficient (r) to measure correlation between individual PCs and the continuous physicochemical properties.
The aliphatic index61 is defined as the relative volume occupied by the aliphatic side chains,
| Aliphatic index = X(Ala) + aX(Val) + b(X(Ile) + X(Leu)), | (10) |
The hydrophobicity is a measure of the degree to which the peptide is hydrophobic, calculated by averaging the hydrophobicity values of each residue by using the scale proposed in Kyte and Doolittle.64 The instability index predicts whether a peptide will be stable in a test tube as presented in Guruprasad et al.65 The molecular weight66 is the average molecular weight of the peptide found by summing the individual masses of its amino acids and is directly correlated with sequence length.
In Fig. 9, we identify the single PC with the highest correlation to each one of the potential bridge variables and illustrate the value of that maximal correlation. We note that although there is a comparatively low Silhouette score in one dimension indicating that the score in two dimensions is a more appropriate quantification of ordering in the system, we may use it to indicate which PC the models consider “most” relevant for verified-AMP ordering, and thus identify whether those PC's simultaneously correlate with physicochemical properties. For example, the 32-dimensional AAE, 64-dimensional WAE, RNN, Transformer and 128-dimensional AAE and RNN models employ one of the top 5 PC's most strongly for AMP ordering (Fig. 9A), and the same PC is also correlated with charge pH = 7 (Fig. 9B) and isoelectric point (Fig. 9F) for this model (Fig. 9H).
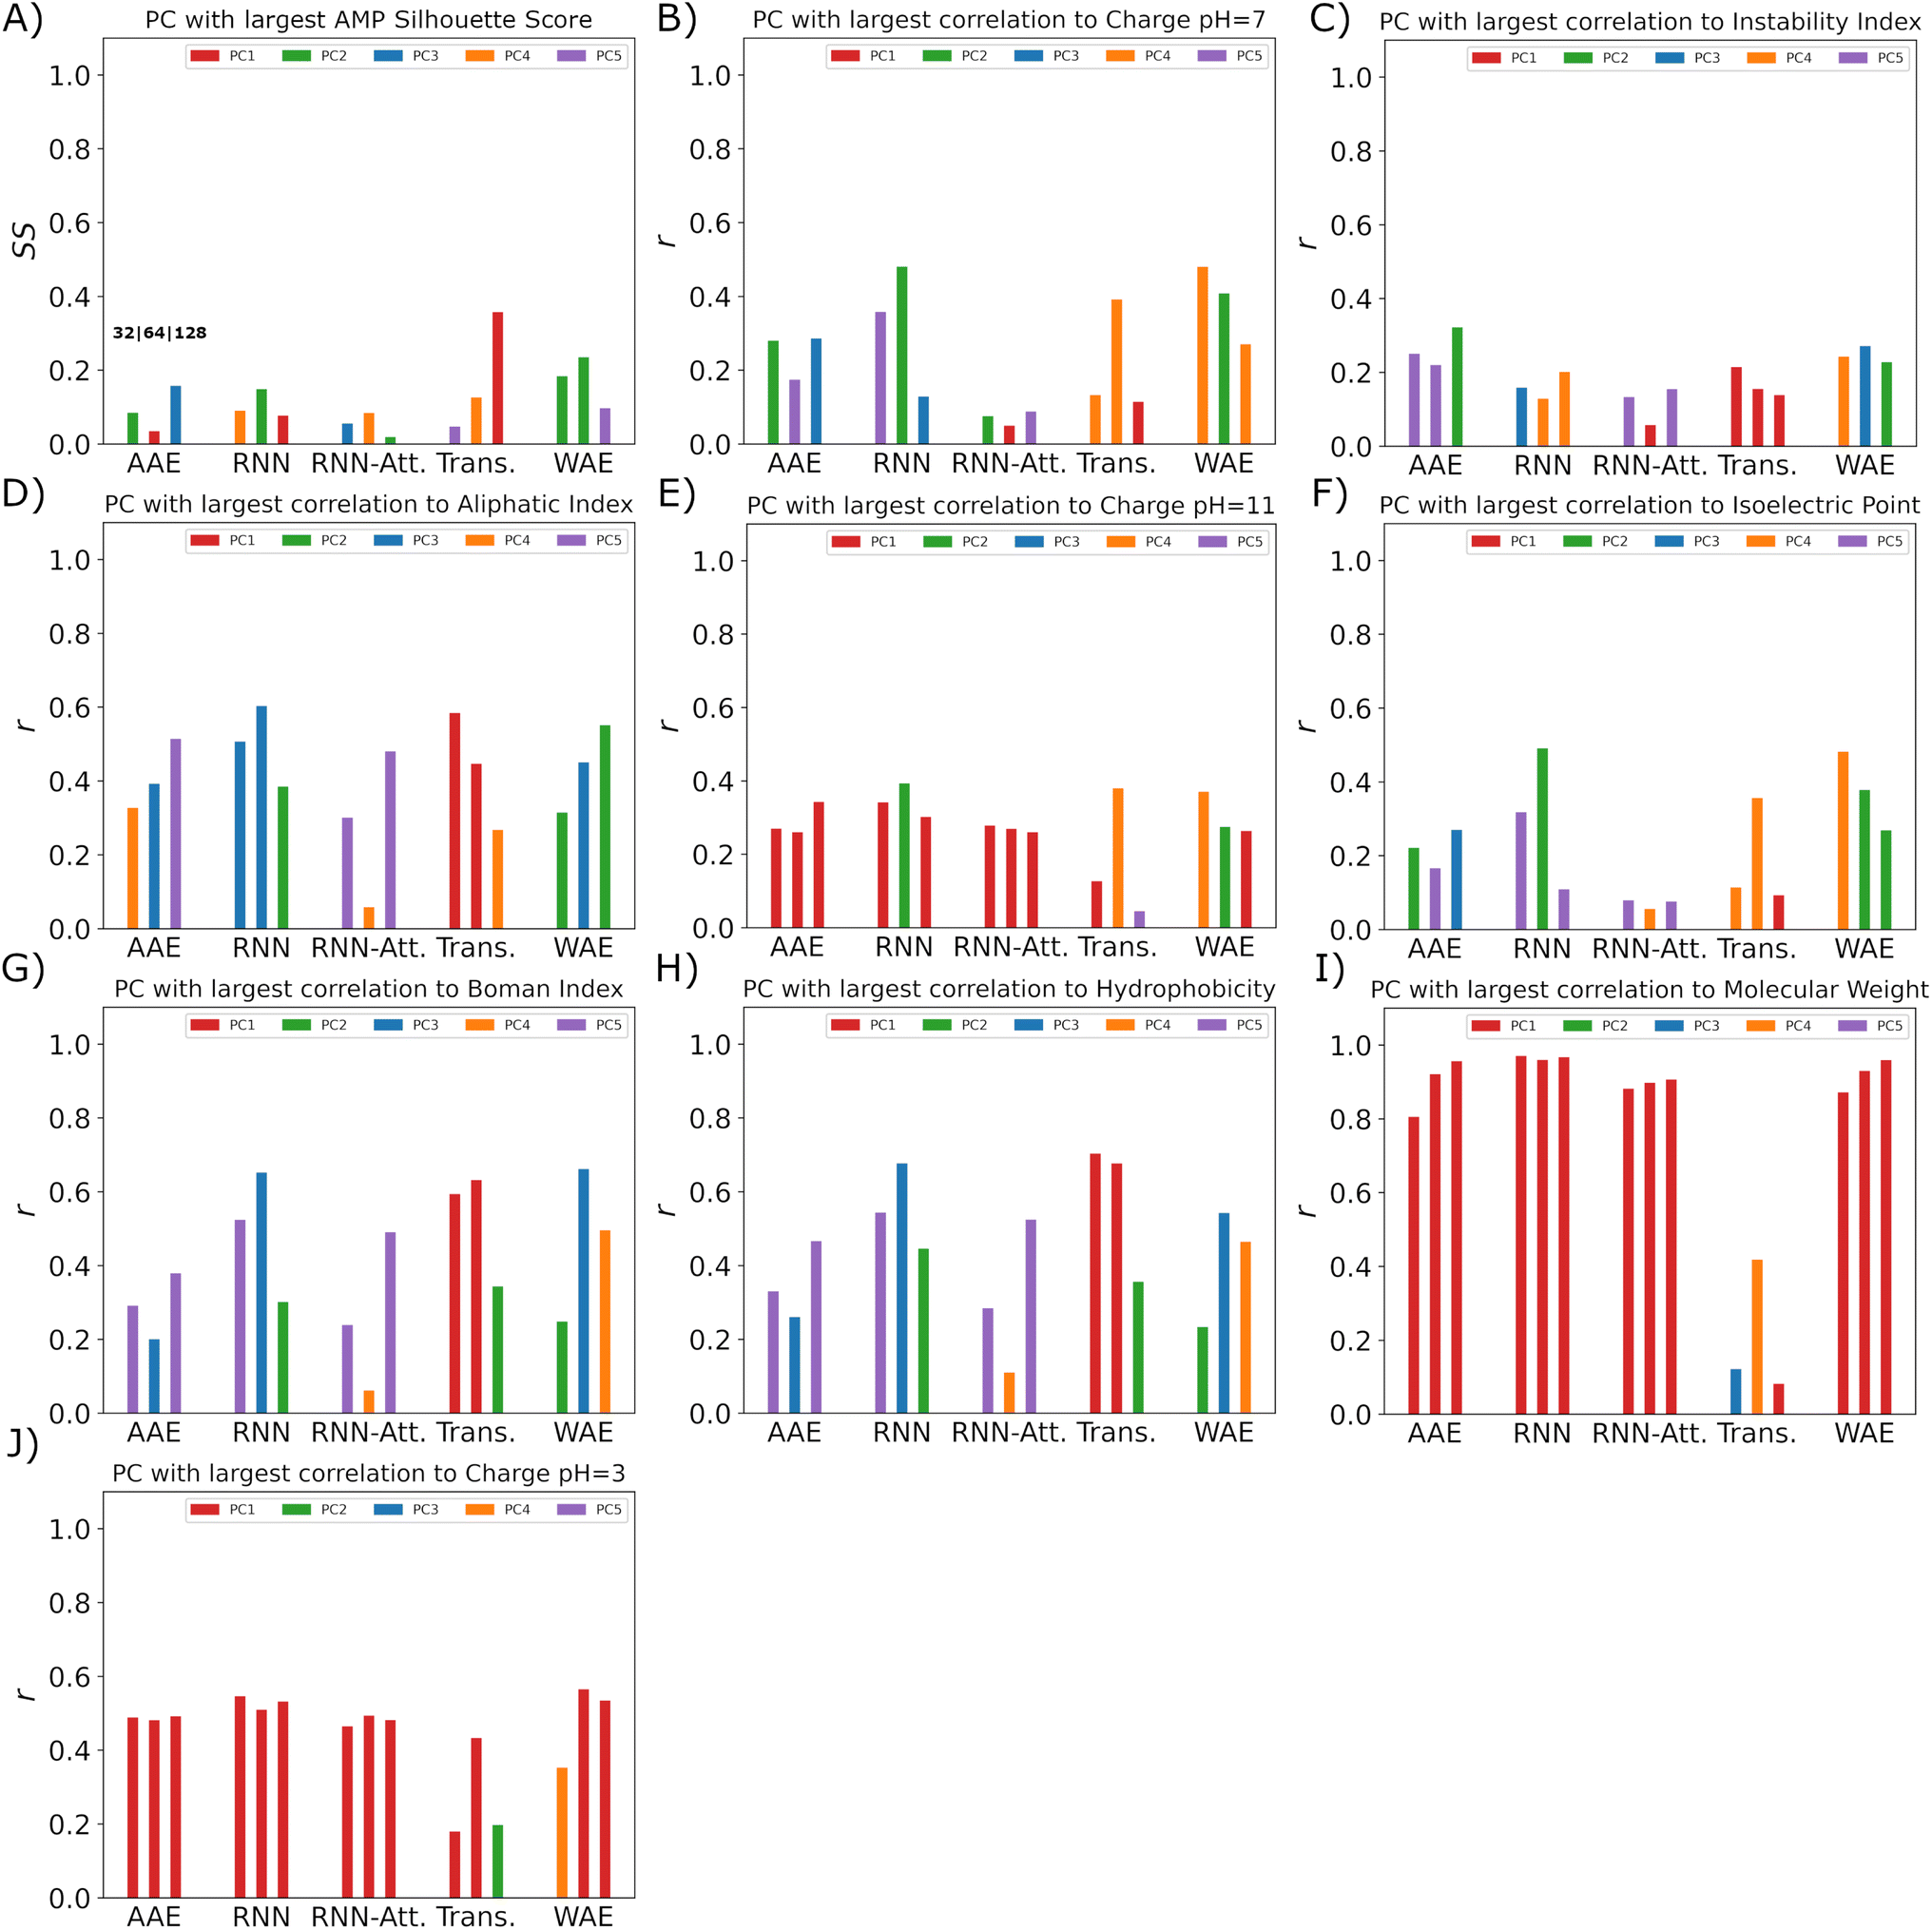 | ||
| Fig. 9 Top PC bridge variable correlation scores for all five models and their three latent sizes. (A) The AMP Spearman correlation coefficients (ρ). (B–J) The Pearson correlation coefficients (r) for the (B) charge pH = 7, (C) instability index, (D) aliphatic index, (E) charge pH = 11, (F) isoelectric point, (G) Boman index, (H) hydrophobicity, (I) molecular weight and (J) charge pH = 3. Shown in order for latent sizes 32–128 for each model. | ||
For all models but the Transformer, the first principal component is highly correlated with molecular weight (Fig. 9I), which makes sense for the RNN, AAE, and WAE, as all are length-dependent models. That the RNN-Attention model also exhibits this behavior demonstrates the need to commit fully to a Transformer model to avoid a significant component of the model's variance being devoted to sequence length. The comparative performance of the AAE with the Transformer shows, however, that it is not necessary to remove the length dependence to enforce ordering capability in the model, as long as more than the first and second PC are considered. In a more general sense, any model with a high-variance component built in as part of the architecture will likely demonstrate this behavior.
In these plots we find that the models will distribute the correlation across all of the first 5 PC's. Generally the transformer model is observed to make use of the first PC more often, and this is expected to be because it does not feature a length based correlation in the first PC.
Using these correlation coefficients it is possible to further characterise the ordering of the latent space and define directions along which interpolation should occur such that desirable characteristics will emerge from generated peptides. Each PC can be interpreted as a linear combination of the respective model's latent dimensions (32, 64 or 128). From this interpretation it is possible to construct a direct relation between the latent dimensions of the model and the physicochemical properties investigated through the PCA mapping; we have made the PCA mappings themselves available on the project Github repository, https://github.com/bcgsc/AMPlify
4 Case study: pipeline for de novo AMP discovery using PCA components
Our pipeline consists of three of the best performing models. We employ the simultaneous exploration of the Transformer-128 (high reconstruction accuracy, good clustering separation in two dimensions, linear generated sequence partitioning and low interpretability), AAE-128 (moderate reconstruction accuracy, good clustering separation in two dimensions, non-distorted PCA space linear generated sequence partitioning, moderate linearity, medium interpretability–bridge variables identified for AMP PCs), and WAE-128 models (moderate reconstruction accuracy, moderate clustering separation in two dimensions, moderate distortion in PCA space, linear generated sequence partitioning, moderate linearity, high interpretability).The pipeline takes an AMP of interest as input. The AMP is passed through the encoders of the different models and transformed into a model-specific latent representation. The AMP latent vector is appended to the embedded training data and is transformed into linear representations with PCA (Fig. 10).
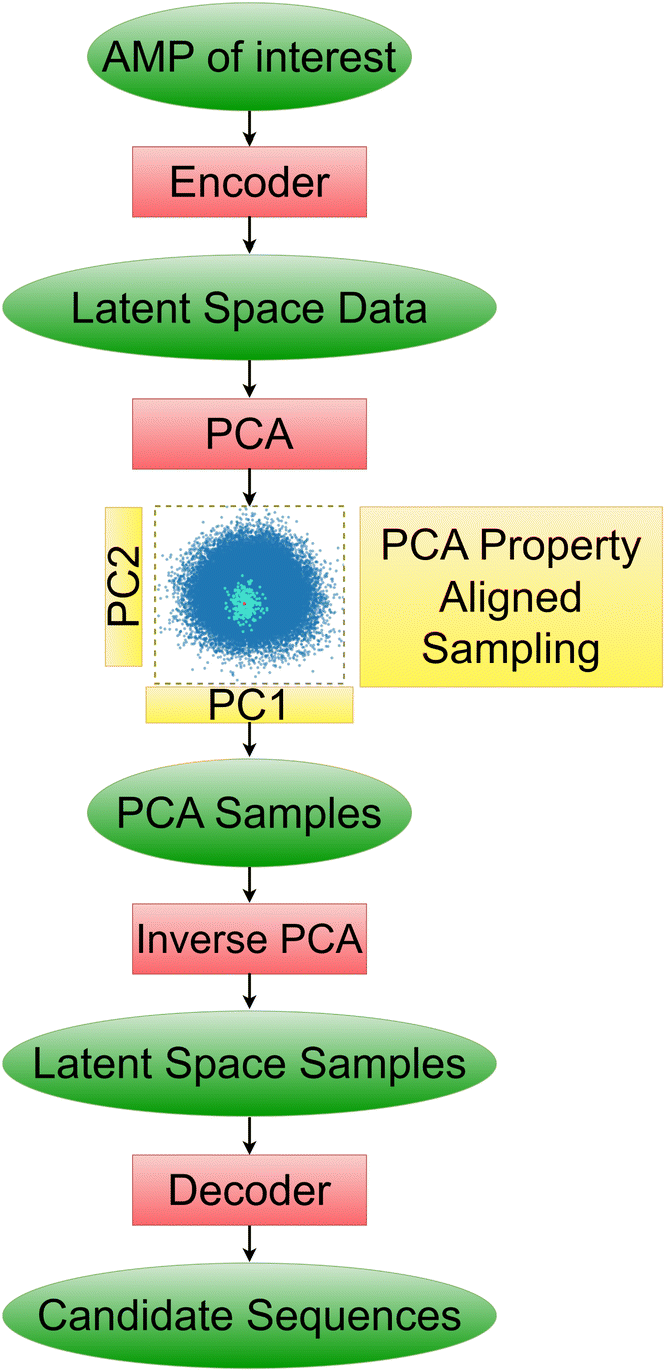 | ||
| Fig. 10 Schematic of suggested pipeline for generation of sequences of interest. | ||
We then proceed to choose variables of interest to hold constant in the latent space and perturb the others. This will allow us to find new peptides with the properties of interest maintained. We choose to maintain the verified-AMP-correlated PC and the hydrophobicity-correlated PC, to produce the sequences likelier to share experimental AMP-likeness and hydrophobicity – an important AMP property – with a chosen sequence not in the training set. We note that this procedure could be done with any identified property near any input point of interest. We study a synthetic β-sheet forming peptide called GL13K.67 We use the previously mentioned correlation coefficients (Sect. 3.4), to find the verified-AMP correlating PC and the top hydrophobicity correlating PC. Having kept track of the PCA vector for our AMP of interest, we perform sampling by keeping our two PC's of interest, AMP and hydrophobicity correlated, fixed and adding Gaussian noise to all other PC's. The added noise variance must be tuned individually for each model as the latent space organization is different for each model. The variance tuning is performed by identifying the mean and standard deviation of all training dataset points in PCA space and then sampling Gaussian noise centered at the mean with 1/5 the standard deviation. This noise vector is then summed with the PCA vector of our AMP of interest, thus shifting the sampling location to be near the AMP of interest. Once we have the noisy nearby PCA samples we perform an inverse PCA transformation returning to our latent space vector representation, demonstrating one particular valuable property of the PCA approach. We then pass the noisy latent samples to the decoder which will generate the desired candidate peptide sequences.
We demonstrate the use of the pipeline on GL13K. For each model, we generate five different sequences and display their properties (Fig. S6–S8†). In the ideal case we should observe little change in Hydrophobicity of the samples while the other physicochemical properties should vary and in general this is what we observe. We observe that certain properties of random sequences generated in the neighborhoods tend to remain more constant irrespective of model (aliphatic index, charge at pH = 3, molecular weight, isoelectric point) and certain properties tend to be more variable (Boman index, charge at pH = 11, instability index), while certain properties are more dependent on the model. Hydrophobicity varies the most in the AAE model, and the least in the WAE model. One benefit of employing multiple models is the ability to sample different local neighborhoods of the input point, with potentially different properties; another benefit is including both more interpretable and more high-performing models to generate samples.
The results from the pipeline for the AAE-128, Transformer-128 and WAE-128 presented in the ESI figures (Fig. S6–S8†) show that by locking PC's of interest and sampling nearby points along other PC's we can generate novel peptides that have similar properties to the original GL13K. While some generated samples feature drastic changes in certain properties such as the fourth peptide from the AAE-128 with a charge of 1 at pH 11 or both generated peptides with −1 charges at pH 11 for the Transformer-128 and WAE-128 models, most properties fall near the original GL13K sequence properties.
This general pipeline can be extended to any peptide function by identifying the top PC's correlating with the desired function and keeping those fixed as noise is added to the remaining PCA vectors in order to sample in the functional neighbourhood it could be employed for.
5 Discussion and conclusions
We have trained five deep learning models with VAE-like latent spaces on a library of sequences of short proteins and assessed the characteristics of the resultant models, including a careful examination of the properties of the latent spaces associated with them. We show that the models have the capability to create smooth, continuous latent spaces that can be sampled for de novo AMP generation and optimization. The inclusion of a simultaneously-trained property prediction network disentangles verified-AMP and non-verified-AMP sequences; however, to our surprise we find that, unlike in previous studies, this is not always apparent in the first two principal components derived by PCA. Different models associate different information with highly-varying PCs, and different models vary drastically in the ways in which they encode variance, and, hence, information. It is important to note that this presents a challenge for the incorporation of domain knowledge, since we see that the model does not necessarily place greater emphasis on user-provided information. Furthermore, it sounds a note of caution in the interpretation of latent space orderings, since observed orderings may occupy only a small fraction of the informational content in the model latent space. We have also addressed the question of how meaningful the use of PCA is as a tool for indicating properties of VAE-like latent spaces and argued that the less distortion imposed by PCA upon the different neighborhoods and interactions between points in the manifold, the more clearly interpretable the latent space is. The analysis that we present here may be applied to other short peptides of interest, such as anti-cancer peptides. Based on our results, we would suggest retraining our Transformer, AAE, and WAE models in conjunction with a new predictor that relates to the property of interest. One could then employ a similar analysis and pipeline to assess the quality of the resultant latent spaces and generate sequences of interest.We have investigated the use of the principal components with the highest clustering of verified AMP properties for de novo AMP generation and showed that our models generate highly diverse and unique sequences, with comparatively low sequence similarity in local neighborhoods. Despite the low similarity and the use of a predictor trained on experimentally-verified AMP properties rather than direct knowledge of AMP-like-ness, all models but the 32 and 128-dimensional RNN-Attention and 64-dimensional AAE are capable of successfully partitioning a single coordinate in the latent space into regions that generate AMP-like sequences with high probability and regions that generate non-AMP-like sequences with high probability. We observe that the capacity of the model to reconstruct input sequences is not clearly linked to its ability to partition the space, and we add our voices to a number of cautions against the over-use of reconstruction accuracy as a metric for generative models.
We have evaluated the extent to which models order their latent spaces according to standard peptide physicochemical properties that they are not trained on and identify the principal components most strongly correlated to given properties. We find that the models will order any of the first five principal components investigated according to physicochemical properties but when a model needs to assign a larger proportion of the variance to learning peptide length the first component is usually correlated with length/molecular weight. Indeed, only the 128-dimensional Transformer eschews length as a consideration almost entirely (no length dependence observed in the reconstruction accuracy, small correlation between any top five PC and molecular weight). The Transformer in general clearly has the capacity to function independent of the length but demonstrates a more rapid drop in performance as the latent space dimensionality is decreased than the RNN, WAE, or AAE. We speculate that this is due to the nature of the task: discriminating between lengths can actually discourage models from overfitting; that is, from simply “memorizing” the answers, and may encourage a more meaningful lower-dimensional representation, although we also note that the 128-dimensional Transformer shows by far the most heightened local fragment-based similarity in its verified-AMP-relevant PC. This could suggest a model relying on fundamentally different information from the others.
In terms of other relevant physicochemical variables, we observe moderate correlations (0.35 ≲ rPearson ≲ 0.65) between at least one PC and isoelectric point/charge at pH 7 in the AAE-64, RNN-32, RNN-64, Transformer-64 and all WAE models and moderate correlation between at least one PC and hydrophobicity in all but the RNN-Attention-32. As these are traditional hallmarks employed for AMP design, this is desirable behavior, and in particular aids in the interpretability of the models through a linear mapping of the latent space variables to straightforward “bridge variables” for most models. It also shows that the models are capable of identifying relevant properties from sequences alone, despite being trained only with a binary property predictor.
We may further employ the bridge variables in conjunction with the probability of AMP generation in a single PC (Fig. 6) to aid in the interpretability of the models. In our case models demonstrating a monotonic linear increase in probability, especially those reaching a prediction probability of >0.6 (128-dimensional AAE, 64-dimensional RNN, 64-dimensional RNN-Attention, 64 and 128-dimensional Transformer and 32 and 64-dimensional WAE models) are arguably the easiest to interpret, since we now essentially have a single linear mapping from the latent space to AMP probability, which for the RNNs and WAEs are comparatively non-distorted from the original space (cf. Sec. 3.4).
We demonstrate a trade-off between model complexity and model interpretability under this paradigm and suggest that for optimized design of AMPs in a continuous latent space, it may be appropriate to perform the optimization in multiple different latent spaces, using a similar philosophy to that of ensemble voting. We do a short case study to show one way this might be implemented, and indeed, in future work we plan to use this as a starting point for an active learning procedure to traverse these spaces and perform multi-scale molecular dynamics simulations upon relevant points.
In the future, we plan to investigate a phenomenon termed selective latent memories due to Kullback–Leibler divergence constraints. This effect is observed during training and causes a drop in the entropy of certain latent dimensions when the KLD is minimized. In addition, we will generalize from a binary AMP/non-AMP classifier to a multi-class predictor capable of grouping sequences by expected mechanism of action. Finally, as a prelude to the previously mentioned active learning traversal of the space, we plan to investigate the incorporation of structural data into the models, perhaps leveraging the recent success of AlphaFold2 (ref. 14) and similar structural prediction algorithms.
The models developed in this research used deep learning to discover embeddings for sequences of amino acids, but future work should investigate other peptide representations, such as protein structure distance graphs which can embed structural information and the SMILES strings used in the world of small drug design. SMILES strings encode chemical information into a sequence of characters, thus allowing the models to learn chemical distinctions between the amino acids.
Overall, we have performed a thorough qualitative and quantitative analysis of the latent spaces of five different generative models for AMP design, identifying strengths and weaknesses of each, as well as developing a suite of analysis methods for latent space design and sampling in the context of generative deep learning of AMP sequences. We provide a much-needed set of benchmarking protocols in this nascent area of research.
Data availability
The code for the 5 deep learning models and specific datasets curated are made available on Github: https://github.com/Mansbach-Lab/latent-spaces-amps. The QSAR deep learning AMP classifier used to evaluate the model predictions can be found at https://github.com/bcgsc/AMPlify. The datasets were created using Uniprot and the Starpep databases found at https://www.uniprot.org/ and http://mobiosd-hub.com/starpep/.Author contributions
Rachael A. Mansbach: conceptualization, methodology, resources, writing – review & editing, supervision, project administration, funding acquisition. Samuel Renaud: methodology, software, validation, formal analysis, investigation, data curation, writing – original draft, writing – review & editing, visualization.Conflicts of interest
The authors declare no conflicts of interest.Acknowledgements
This research was supported in part by Discovery Grant #RGPIN-2021-03470 from the National Sciences and Engineering Research Council of Canada. This research was enabled in part by support provided by Calcul Quebec (https://www.calculquebec.ca) and the Digital Research Alliance of Canada (https://alliancecan.ca/en). This research was undertaken, in part, thanks to funding from the Canada Research Chairs Program. The authors thank Dr Yiming Xiao, Dr Brandon Helfield, Adam Graves, and Natalya Watson for useful discussions.Notes and references
- Centers for Disease Control and Prevention, Antibiotic resistance threats in the United States, National Center for Emerging Zoonotic and Infectious Diseases (U.S.) technical report, 2019 Search PubMed.
- C. L. Ventola, P and T, 2015, 40, 277–283 Search PubMed.
- K. Bush, P. Courvalin, G. Dantas, J. Davies, B. Eisenstein, P. Huovinen, G. A. Jacoby, R. Kishony, B. N. Kreiswirth, E. Kutter, S. A. Lerner, S. Levy, K. Lewis, O. Lomovskaya, J. H. Miller, S. Mobashery, L. J. V. Piddock, S. Projan, C. M. Thomas, A. Tomasz, P. M. Tulkens, T. R. Walsh, J. D. Watson, J. Witkowski, W. Witte, G. Wright, P. Yeh and H. I. Zgurskaya, Nat. Rev. Microbiol., 2011, 9, 894–896 CrossRef CAS PubMed.
- J. Li, J. J. Koh, S. Liu, R. Lakshminarayanan, C. S. Verma and R. W. Beuerman, Front. Neurosci., 2017, 11, 73 Search PubMed.
- M. Magana, M. Pushpanathan, A. L. Santos, L. Leanse, M. Fernandez, A. Ioannidis, M. A. Giulianotti, Y. Apidianakis, S. Bradfute, A. L. Ferguson, A. Cherkasov, M. N. Seleem, C. Pinilla, C. de la Fuente-Nunez, T. Lazaridis, T. Dai, R. A. Houghten, R. E. Hancock and G. P. Tegos, Lancet Infect. Dis., 2020, 20, e216–e230 CrossRef CAS PubMed.
- J. J. Schneider, A. Unholzer, M. Schaller, M. Schäfer-Korting and H. C. Korting, J. Mol. Med., 2005, 83, 587–595 CrossRef CAS PubMed.
- J. Koehbach and D. J. Craik, Trends Pharmacol. Sci., 2019, 40, 517–528 CrossRef CAS PubMed.
- J. Lei, L. Sun, S. Huang, C. Zhu, P. Li, J. He, V. Mackey, D. H. Coy and Q. He, Am. J. Transl. Res., 2019, 11, 3919–3931 CAS.
- F. Guilhelmelli, N. Vilela, P. Albuquerque, L. d. S. Derengowski, I. Silva-Pereira and C. M. Kyaw, Front. Microbiol., 2013, 4, 1–12 Search PubMed.
- A. Bin Hafeez, X. Jiang, P. J. Bergen and Y. Zhu, Int. J. Mol. Sci., 2021, 22, 11691 CrossRef CAS.
- G. Wang, Protein Sci., 2020, 29, 8–18 CrossRef CAS.
- S. P. Piotto, L. Sessa, S. Concilio and P. Iannelli, Int. J. Antimicrob. Agents, 2012, 39, 346–351 CrossRef CAS.
- F. H. Waghu and S. Idicula-Thomas, Protein Sci., 2020, 29, 36–42 CrossRef CAS PubMed.
- P. Cramer, Nat. Struct. Mol. Biol., 2021, 28, 704–705 CrossRef CAS PubMed.
- I. J. Goodfellow, Y. Bengio and A. Courville, Deep Learning, MIT Press, Cambridge, 2016 Search PubMed.
- D. P. Kingma and M. Welling, 2nd International Conference on Learning Representations, ICLR 2014 - Conference Track Proceedings, ArXiv, 2013, preprint, ArXiv:1312.6114.
- D. P. Kingma and M. Welling, Found. Trends Mach. Learn., 2019, 12, 307–392 CrossRef.
- R. Gómez-Bombarelli, J. N. Wei, D. Duvenaud, J. M. Hernández-Lobato, B. Sánchez-Lengeling, D. Sheberla, J. Aguilera-Iparraguirre, T. D. Hirzel, R. P. Adams and A. Aspuru-Guzik, ACS Cent. Sci., 2018, 4, 268–276 CrossRef.
- D. Polykovskiy, A. Zhebrak, B. Sanchez-Lengeling, S. Golovanov, O. Tatanov, S. Belyaev, R. Kurbanov, A. Artamonov, V. Aladinskiy, M. Veselov, A. Kadurin, S. Johansson, H. Chen, S. Nikolenko, A. Aspuru-Guzik and A. Zhavoronkov, Front. Pharmacol., 2020, 11, 1–19 CrossRef.
- A. Tucs, D. P. Tran, A. Yumoto, Y. Ito, T. Uzawa and K. Tsuda, ACS Omega, 2020, 5, 22847–22851 CrossRef CAS PubMed.
- H. Chen, O. Engkvist, Y. Wang, M. Olivecrona and T. Blaschke, Drug Discovery Today, 2018, 23, 1241–1250 CrossRef.
- M. H. Segler, T. Kogej, C. Tyrchan and M. P. Waller, ACS Cent. Sci., 2018, 4, 120–131 CrossRef CAS.
- P. Das, T. Sercu, K. Wadhawan, I. Padhi, S. Gehrmann, F. Cipcigan, V. Chenthamarakshan, H. Strobelt, C. dos Santos, P.-Y. Chen, Y. Y. Yang, J. P. K. Tan, J. Hedrick, J. Crain and A. Mojsilovic, Nat. Biomed. Eng., 2021, 5, 613–623 CrossRef CAS.
- T. Sercu, S. Gehrmann, H. Strobelt, P. Das, I. Padhi, C. D. Santos, K. Wadhawan and V. Chenthamarakshan, Deep Generative Models for Highly Structured Data, DGS@ICLR 2019 Workshop, 2019 Search PubMed.
- C. M. Van Oort, J. B. Ferrell, J. M. Remington, S. Wshah and J. Li, J. Chem. Inf. Model., 2021, 61, 2198–2207 CrossRef CAS.
- D. Nagarajan, T. Nagarajan, N. Roy, O. Kulkarni, S. Ravichandran, M. Mishra, D. Chakravortty and N. Chandra, J. Biol. Chem., 2018, 293, 3492–3509 CrossRef CAS.
- A. Capecchi, X. Cai, H. Personne, T. Köhler, C. van Delden and J. L. Reymond, Chem. Sci., 2021, 12, 9221–9232 RSC.
- O. Dollar, N. Joshi, D. A. C. Beck and J. Pfaendtner, Chem. Sci., 2021, 12, 8362–8372 RSC.
- O. Prykhodko, S. V. Johansson, P.-C. Kotsias, J. Arús-Pous, E. J. Bjerrum, O. Engkvist and H. Chen, J. Cheminf., 2019, 11, 74 Search PubMed.
- M. J. Kusner, B. Paige and J. M. Hernández-Lobato, 2017, preprint, arXiv:1703.01925, DOI:10.48550/arXiv.1703.01925.
- F. Grisoni, M. Moret, R. Lingwood and G. Schneider, J. Chem. Inf. Model., 2020, 60, 1175–1183 CrossRef CAS.
- H. Dai, Y. Tian, B. Dai, S. Skiena and L. Song, 6th International Conference on Learning Representations, ICLR 2018 – Conference Track Proceedings, ArXiv, 2018, preprint, ArXiv:1802.08786, DOI:10.48550/arXiv.1802.08786.
- B. Dai, Z. Wang and D. Wipf, 2019, preprint, arXiv:1912.10702, DOI:10.48550/arXiv.1912.10702.
- R. Chowdhury, N. Bouatta, S. Biswas, C. Floristean, A. Kharkar, K. Roy, C. Rochereau, G. Ahdritz, J. Zhang, G. M. Church, P. K. Sorger and M. AlQuraishi, Nat. Biotechnol., 2022, 40, 1617–1623 CrossRef CAS.
- E. C. Alley, G. Khimulya, S. Biswas, M. AlQuraishi and G. M. Church, Nat. Methods, 2019, 16, 1315–1322 CrossRef CAS.
- H. J. Kim, S. E. Hong and K. J. Cha, Electron. Commer. Res. Appl., 2020, 43, 101003 CrossRef.
- A. Bateman, Nucleic Acids Res., 2019, 47, D506–D515 CrossRef.
- S. A. Pinacho-Castellanos, C. R. García-Jacas, M. K. Gilson and C. A. Brizuela, J. Chem. Inf. Model., 2021, 61, 3141–3157 CrossRef CAS.
- S. Ramazi, N. Mohammadi, A. Allahverdi, E. Khalili and P. Abdolmaleki, Database, 2022, 2022, 1–17 CrossRef.
- D. P. Kingma, T. Salimans and M. Welling, 2015, preprint, arXiv:1506.02557, DOI:10.48550/arXiv.1506.02557.
- D. P. Kingma, T. Salimans, R. Jozefowicz, X. Chen, I. Sutskever and M. Welling, 2016, preprint, arXiv:1606.04934, DOI:10.48550/arXiv.1606.04934.
- A. Makhzani, J. Shlens, N. Jaitly, I. Goodfellow and B. Frey, 2015, preprint, arXiv:1511.05644, DOI:10.48550/arXiv.1511.05644.
- I. Tolstikhin, O. Bousquet, S. Gelly and B. Schölkopf, 6th International Conference on Learning Representations, ICLR 2018 - Conference Track Proceedings, 2018, pp. 1–20 Search PubMed.
- K. Cho, B. van Merriënboer, D. Bahdanau and Y. Bengio, Proceedings of SSST 2014 - 8th Workshop on Syntax, Semantics and Structure in Statistical Translation, 2014, pp. 103–111 Search PubMed.
- T. Karras, M. Aittala, S. Laine, E. Härkönen, J. Hellsten, J. Lehtinen and T. Aila, Proceedings of the IEEE Computer Society Conference on Computer Vision and Pattern Recognition, 2021, pp. 438–448 Search PubMed.
- T. Karras, S. Laine, M. Aittala, J. Hellsten, J. Lehtinen and T. Aila, Proceedings of the IEEE Computer Society Conference on Computer Vision and Pattern Recognition, 2019, pp. 8107–8116 Search PubMed.
- A. Gretton, K. M. Borgwardt, M. J. Rasch, B. Schölkopf and A. Smola, J. Mach. Learn. Res., 2012, 13, 723–773 Search PubMed.
- D. Bahdanau, K. Cho and Y. Bengio, 3rd International Conference on Learning Representations, ICLR 2015 - Conference Track Proceedings, 2014, pp. 1–15 Search PubMed.
- A. Vaswani, N. Shazeer, N. Parmar, J. Uszkoreit, L. Jones, A. N. Gomez, L. Kaiser and I. Polosukhin, Adv. Neural Inf. Process. Syst., 2017, 2017, 5999–6009 Search PubMed.
- J. Vig, ACL 2019 - 57th Annual Meeting of the Association for Computational Linguistics, Proceedings of System Demonstrations, 2019, pp. 37–42 Search PubMed.
- T. B. Brown, B. Mann, N. Ryder, M. Subbiah, J. Kaplan, P. Dhariwal, A. Neelakantan, P. Shyam, G. Sastry, A. Askell, S. Agarwal, A. Herbert-Voss, G. Krueger, T. Henighan, R. Child, A. Ramesh, D. M. Ziegler, J. Wu, C. Winter, C. Hesse, M. Chen, E. Sigler, M. Litwin, S. Gray, B. Chess, J. Clark, C. Berner, S. McCandlish, A. Radford, I. Sutskever and D. Amodei, arXiv, 2020, preprint, arXiv:2005.14165, DOI:10.48550/arXiv.2005.14165.
- C. Saharia, W. Chan, S. Saxena, L. Li, J. Whang, E. Denton, S. K. S. Ghasemipour, B. K. Ayan, S. S. Mahdavi, R. G. Lopes, T. Salimans, J. Ho, D. J. Fleet and M. Norouzi, 2022, preprint, arXiv:2205.11487, DOI:10.48550/arXiv.2205.11487.
- P. J. Rousseeuw, J. Comput. Appl. Math., 1987, 20, 53–65 CrossRef.
- W. Chen and A. L. Ferguson, J. Comput. Chem., 2018, 39, 2079–2102 CrossRef CAS.
- P. J. Cock, T. Antao, J. T. Chang, B. A. Chapman, C. J. Cox, A. Dalke, I. Friedberg, T. Hamelryck, F. Kauff, B. Wilczynski and M. J. De Hoon, Bioinformatics, 2009, 25, 1422–1423 CrossRef CAS.
- S. Henikoff and J. G. Henikoff, Proc. Natl. Acad. Sci. U. S. A., 1992, 89, 10915–10919 CrossRef CAS.
- F. Cipcigan, A. P. Carrieri, E. O. Pyzer-Knapp, R. Krishna, Y.-W. Hsiao, M. Winn, M. G. Ryadnov, C. Edge, G. Martyna and J. Crain, J. Chem. Phys., 2018, 148, 241744 CrossRef.
- H. Jeon, H. K. Ko, J. Jo, Y. Kim and J. Seo, IEEE Trans. Vis. Comput. Graph., 2022, 28, 551–561 Search PubMed.
- R. A. Mansbach and A. L. Ferguson, J. Chem. Phys., 2015, 142, 105101 CrossRef PubMed.
- M. Larralde, Peptides, 2021 Search PubMed , https://github.com/althonos/peptides.py.
- A. Ikai, J. Biochem., 1980, 88, 1895–1898 CAS.
- H. G. Boman, J. Intern. Med., 2003, 254, 197–215 CrossRef CAS PubMed.
- Compendium of Chemical Terminology (the “Gold Book”), compiled by A. D. McNaught and A. Wilkinson, Blackwell Scientific Publications, Oxford, 2nd edn, 1997, DOI:10.1351/goldbook.
- J. Kyte and R. F. Doolittle, J. Mol. Biol., 1982, 157, 105–132 CrossRef CAS.
- K. Guruprasad, B. V. Reddy and M. W. Pandit, Protein Eng., Des. Sel., 1990, 4, 155–161 CrossRef CAS.
- P. J. Mohr and B. N. Taylor, Rev. Mod. Phys., 2000, 72, 351–495 CrossRef CAS.
- H. Hirt and S.-U. Gorr, Antimicrobial Peptide GL13K Is Effective in Reducing Biofilms of Pseudomonas aeruginosa, Antimicrob. Agents Chemother., 2013 DOI:10.1128/AAC.00311-13.
Footnote |
| † Electronic supplementary information (ESI) available: With supplementary figures and tables. See DOI: https://doi.org/10.1039/d2dd00091a |
| This journal is © The Royal Society of Chemistry 2023 |