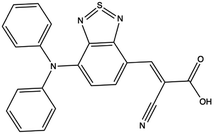
 Open Access Article
Creative Commons Attribution 3.0 Unported Licence
An automated quantum chemistry-driven, experimental characterization for high PCE donor–π–acceptor NIR molecular dyes†
Taylor J.
Santaloci‡
a,
William E.
Meador‡
 a,
Austin M.
Wallace
 a,
E. Michael
Valencia
a,
Blake N.
Rogers
a,
Jared H.
Delcamp
a,
E. Michael
Valencia
a,
Blake N.
Rogers
a,
Jared H.
Delcamp
 abc and
Ryan C.
Fortenberry
 *a
*a
aDepartment of Chemistry and Biochemistry, University of Mississippi, Oxford, Mississippi 38655, USA. E-mail: r410@olemiss.edu
bCurrent Location: Materials and Manufacturing Directorate, Air Force Research Laboratory, Wright Patterson AFB, 0445433, USA
cUES. inc., 4401 Dayton Xenia Rd., Dayton, OH 45432, USA
First published on 12th July 2023
Abstract
A readily accessible (less than four synthetic steps) dye molecule with potential properties well-beyond the current state-of-the-art for use in dye-sensitized solar cells (DSCs) is realized from extensive quantum chemical characterization of nearly 8000 stochastically-derived novel molecules. The synthesized molecule, 23ed_20b_1ea/WM3, possesses a julolidine electron donor group and promises to exhibit a 17.5% power conversion efficiency (PCE) if paired with a suitable redox shuttle based on practical performance analysis (and up to 26.8% in a tandem system). This represents a notable PCE increase for DSC technology. The stochastic quantum chemical analysis exploring molecular dyes is based on combinations of electron donors, π-bridges, and electron acceptors to create the D–π–A molecular dye design. The D–π–A dye combinations are defined via SMILES strings and converted to Cartesian coordinates. The theoretical dyes then undergo density functional theory geometry optimizations, absorption computations, and molecular orbital analyses where a least squares fitting of two functionals minimizes the error with respect to benchmark experiment. While only a small percentage of the computed, novel molecular dyes have better properties than the current best performing benchmark molecular dyes, these still represent a notable increase in potential targets for subsequent experiment as evidenced by the experimental characterization of the synthesized 23ed_20b_1ea/WM3 molecular dye.
1 Introduction
Solar radiation is 49.0% near-infrared (NIR), 42.3% visible, and 8.7% ultraviolet. The power conversion efficiency (PCE) of a solar cell will increase if NIR photons can be absorbed with a larger wavelength crossection of photons compared to just being able to absorb visible photons. For solar cells, the maximum theoretical PCE is ≈32% and is known as the Shockley–Queisser limit.1,2 Modern GaAs solar cells can achieve performance nearest to this limit with a PCE of 29.1%.3–5 A close second, and the most commonly used solar cells, are crystalline Si cells, which have a PCE of 26.7%.3–5 In spite of such promising properties, these solar cells have many drawbacks including manufacturing costs (especially GaAs solar cells), weight, and end-of-life disposal considerations. Dye sensitized solar cells (DSCs), on the other hand, are made from organic materials promising to reduce these three drawbacks. However, the most efficient DSCs, only have PCE values of less than 15%.6–9A DSC would need to have an absorption onset between 900 to 1000 nm in order to approach the Shockley–Queissar limit and the performance of GaAs and Si solar cells.10 To date, the most efficient dye molecules for use in DSCs are ADEKA-1/LEG4 with a PCE of 14.3% and an incident photon-to-current conversion efficiency (IPCE) onset of 750 nm.7 Additionally, SGT-149/SGT-021 molecules produce a DSC with a PCE of 14.2% and an IPCE onset of 750 nm.9 A molecule with a sub-500 nm absorption onset typically cannot exhibit more than a 13% PCE since the PCE is related directly to IPCE onset. Additionally, the absorption onset is loosely correlated to the IPCE onset. As a result, the ideal DSC dye molecule would need an absorption onset value in the NIR.10–12
Typically, DSCs convert photons to energy in a three-step process: light absorption, electron transport, and hole transport. In light absorption, the organic dye absorbs the photons and excites an electron into its lowest unoccupied molecular orbital (LUMO).2,13 In electron transport, the excited electron is injected into a semiconductor conduction band. Common semiconductors include titanium oxide (TiO2), tin oxide (SnO2), or zinc oxide (ZnO), and their inclusion in the process converts the electron excitation into electricity.2,14,15 Finally, in hole transport, a redox shuttle, returns the electrons from a counter electrode to the organic dye completing the electronic circuit.2,16 DSCs are the only solar cells that have a separate material for each step, but this introduces notable flexibility since each material can be modified to improve the PCE.2,15,16
The light absorption properties of organic dyes can be theoretically improved by altering the highest occupied molecular orbital (HOMO) and LUMO energies as a result of changing the structure of the organic dye molecule. A common means of constructing a dye molecule is incorporation of an electron donor (D), π-bridge (π), and electron acceptor (A) group each into a given organic molecule. The electron donor is an electron-rich moiety that donates electron density to the electron acceptor, and the energy of this donation is affected by the HOMO and LUMO energies.17 Examples of common donor structures are triphenylamines, and indolines.18 The π-bridge structure is a π-conjugated system that transfers the electron from the donor to the acceptor upon photo excitation and assists with tuning the HOMO–LUMO energy gap. Examples of common π-bridge structures include benzothiadiazole, thiophene, and porphyrin.18 The electron acceptor collects the electrons from the π-bridge upon excitation and is anchored to the semiconductor.19 Examples of common electron acceptors include cyanoacrylic acid and benzoic acid.20 In order to improve the PCE, the HOMO energy level needs to be below the redox shuttle energy level, and the LUMO energy level needs to be above the −4.0 eV TiO2 semiconductor energy level when taking vacuum as −4.5 V versus normal hydrogen electrode (NHE). However, the PCE is only one such consideration. The loss-in-potential must also be considered and is defined as the energy difference between the optical gap and the open circuit voltage of the solar cell. The loss-in-potential decreases the closer the dye molecule HOMO–LUMO energy gap is to the redox shuttle-semiconductor band gap. Additionally, when the HOMO–LUMO energy gap energy is smaller, the dye will absorb lower energy photons. As a result, modifying the electron donor, π-bridge, and/or electron acceptor has the possibility to improve the PCE of dye sensitized solar cells by designing organic molecular dyes to maximize the desired properties.
The ability to manipulate molecular components in dye sensitizers can lead to an innumerable variation of solar cell designs. As of now, synthetic chemists manually design dyes with the help of chemical intuition and density functional theory (DFT).21 However, finding the perfect combination has been a slow (and often expensive) process due to the number of possible combinations. The pharmaceutical and medical industries have attempted to solve a similar problem by creating databases and combinatorial libraries filled with thousands of novel peptides and using computational chemistry to predict desired molecular properties.22 A similar strategy for DSCs would speed up the process for finding the best molecular dye sensitizer.
A combinatorial approach to finding optimal dye structures has been used both experimentally and theoretically.23–29 Experimentally, Fuse and coworkers synthesized organic dyes with a one-pot procedure and made 112 unique DSCs.23 The procedure utilized the Suzuki–Miyaura coupling procedure to find hundreds of combinations of molecular dyes. While notable for experimental synthesis, such methods are still limited by the cost of materials, the time-consuming procedure, and restricted lab bench space. However, computationally exploring combinations is much cheaper and faster for composing numerous combinations ahead of investing capital and time experimentally. Quantum chemical methods can optimize dye geometries and compute electronic properties of thousands of dye sensitizers in a matter of months instead of decades. Quantum chemical modeling can be utilized to search for optimal dye structures by computing the HOMO/LUMO energies, electronic excitation energies/wavelengths, and the electron transfer properties of the organic structure. Past work has shown that DFT is a valuable tool to optimize an organic dye molecule's geometry and to compute the HOMO–LUMO energy gap of the organic dye molecule with less computational costs than wavefunction methods for these large structures.30 Time-dependent DFT (TD-DFT) can then be utilized to compute the electronic properties of a given molecule.11,30–39 A previous study on a set of 100 visible light absorbing organic dyes shows that on average CAM-B3LYP is above the experimental absorption value 0.26 eV above experiment, while PBE0 is below experimental values by an average of 0.97 eV.33–36 The smallest error in such computations has been shown to be PBE0, which has an absolute standard deviation from experiment of 0.14 eV for the sampled molecules.33–36
While past computational studies have created databases for known DSCs,26,29 the present work establishes a protocol to compute the molecules or properties needed to populate a combinatorial library that aims to find favorable electronic properties of theoretically generated organic dye molecules. Once the most promising dyes are determined computationally, the most synthetically-accesible candidates are produced and analyzed in order to determine both the validity of the computational approach as well as a potential new dye molecule for enhancing DSC performance.
2 Methods
2.1 Computational details
Seventy-five benchmark molecular dyes are selected to find the most accurate quantum chemical approach to predict the absorption maxima (λmax), the LUMO energy, and charge transfer properties of the combinatorially-derived, novel, theoretical molecules for analysis in this work.6,40–73 The LUMO energy is a primary focus since all high performance DSCs use TiO2, but the redox shuttle is tunable to the organic dye's HOMO energy. The choice of λmax will be utilized here since the preferred absorption onset (λonset) is much more involved to model theoretically, and λmax roughly correlates with λonset. Previous work has shown that B3LYP is a sufficient level of theory for excited state computations on larger molecules, i.e. those with more than a dozen atoms.74–78 Geometry optimizations of the benchmark dyes utilize B3LYP/6-311G(d,p) within Gaussian09 and Gaussian16.79,80 The geometry optimizations provide the molecular structures for the subsequent TD-DFT31 excited state computations producing the approximate λmax (i.e. vertical transition) and molecular orbital computations needed to determine the LUMO energy for each dye molecule. The TD-DFT excited state computations are computed with three TD-DFT methods: CAM-B3LYP/6-311G(d,p),81 BHandHLYP/6-311G(d,p),82 and PBE0/6-311G(d,p).83 The molecular orbitals are computed with PBE0/6-311G(d,p) in order to determine the charge transfer properties. Previous studies utilized the 6-311G(d,p) basis set with the TD-DFT computations producing accurate results compared to experiment leading to its use in this study.56The three TD-DFT methods are chosen because they each have different Hartree–Fock (HF) contributions. The CAM-B3LYP HF contributions are 19% short range and 65% long range. The BHandHLYP HF total contribution is 50%, and the PBE0 HF contribution is 25%. Having these different levels of HF contributions allows for the shortcomings of an individual method to be corrected with another through using a least-square fitting (LSF, described below) in order to minimize error in the predictions. Thus, these methods, along with the experimentally reported values, are used to construct the LSF to form a more predictive model through their combination. Specifically, the LSF is a statistical parameter that produces a best fitting function by utilizing a set of points and minimizing the error based on the residuals for the individual points. The set of points come from the CAM-B3LYP and PBE0 excitation energies, and the resulting curve is fit to the benchmark experimental values. Additionally, the LUMO energies are also improved through applying a LSF on the calculated CAM-B3LYP/6-311G(d,p) and PBE0/6-311G(d,p) results in order to map experimental values more accurately. After acquiring the parameters from the benchmark portion of this study, the theoretical dyes are sent down this same computational pipeline of geometry optimizations and electronic excited state computations. Thus, the dyes are optimized with B3LYP/6-311G(d,p) and have electronic excited states computed with CAM-B3LYP/6-311G(d,p), BHandHLYP/6-311G(d,p), and PBE0/6-311G(d,p). Then, the CAM-B3LYP/6-311G(d,p) and PBE0/6-311G(d,p) excitation energies are combined using the coefficients from the least-squares fitting on the benchmark dyes to produce a LSF value.
Furthermore, implicit solvation effects are also incorporated into the benchmark study to determine if the λmax values are improved compared to experiment. The three polarized continuum model (PCM) solvents examined herein are dichloromethane (DCM), tetrahydrofuran (THF), and N,N-dimethylformamide (DMF); these are commonly used for the characterization of molecules utilized in DSCs.84–86
The extent of electron transfer across the molecule is predicted by summing the atomic orbital coefficients that comprise the MOs responsible for the electronic transition. Typically, this transition is a HOMO to LUMO transition. Regardless, by acquiring the atomic orbitals, the approximate contributions to the MOs can be computed. The position of the electron can be determined to specifically find the percent contribution on the electron acceptor, anchor, and electron donor. Ideally, the HOMO involved in the electronic excitation should be contained primarily within the donor portion while the LUMO will be dominated spatially by the acceptor with some notable percentage, arbitrarily chosen here to be at least 4%, on the anchor. Within the electron acceptor portion, the anchor attached to the semi-conductor should have a maximum electron density within the LUMO, as well. The probability for the electron to transfer to the semi-conductor will increase with more orbital density on the anchor portion of the acceptor. Ultimately, a script reads the molecular orbitals and the user-defined SMILES strings to determine which atoms belong to which portion of the molecule and returns the percentages of the selected pieces for a given orbital, HOMO or LUMO. The benchmark dyes are used to determine the numerical values that must be met to permit favorable charge transfer to the semiconductor.
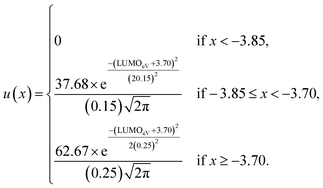
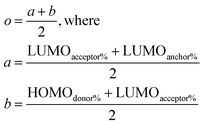
Once the data for the three metrics are collected, the dyes are scored to find the best dyes with equations that test the absorption wavelength (l), the LUMO energy (u), and the charge transfer (o) according to the following equations:
| s = l + u + o | (1) |
 | (2) |
 | (3) |
 | (4) |
Such scoring is necessary in order to process large numbers of theoretical dyes anticipated to be produced in this and following works. Eqn (1) is written with equal weighting to all three criteria with the target values of a 1000 nm λmax giving a score of a 100 from eqn 2, −3.75 eV LUMO energy giving a score of a 100 from eqn 3, and a complete transfer of charge from the donor to acceptor scoring a 100 in eqn (4), respectively, for a maximum of 300. The λmax target value is in relation to the Shockley–Queissar limit, the LUMO target energy is selected to give a 250 mV driving force for electron injection into the TiO2, and the charge transfer percentages maximize the probability of injection. In more detail, eqn (2) is constructed so that the minimum value for λmax to be considered is 600 nm. The ideal value is, again, 1000 nm giving 1000–600 = 400 which is why the denominator is a value of 400. This is, then, transformed into a percentage. For eqn (3), variance about the ideal −3.75 eV LUMO energy is allowed, but straying beyond −3.85 eV could lead to experimental study on a molecule where the experimentally-derived LUMO energy could be closer to −4.00 eV. Such would render the molecule ineffective at initiating a circuit. Eqn (4) produces a percentage where the anchor portion is weighted evenly with the charge transfer itself to make an ideal circumstance where the entire LUMO density would fall onto the anchor.
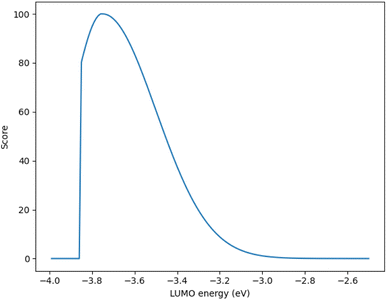
Although, the best scoring NIR dye could exhibit a score of >300 if a λmax value above 1000 nm is obtained, for the purpose of this study a 300 is considered perfect. The LUMO energy maximum is −3.75 eV and exponentially decreases if the LUMO energy increases or decreases from −3.75 eV. Fig. 1 illustrates a Gaussian curve that implements the LUMO energy scoring. Since, the dye would not work if the LUMO energy is too close to the −4.0 eV TiO2 conduction band energy, all of the LUMO energy values that are less than −3.85 eV return an automatic zero. Lastly, if the orbital percentage located on the LUMOacceptor, LUMOanchor, or HOMOdonor is below 4%, then the dye scores zero. These hard limits are implemented in order to eliminate dyes that will likely fail to function efficiently beyond the limits of the accuracy of the quantum chemical methods. After these filters, the highest scoring dyes are presented as attractive synthetic targets.
2.2 Combinatorial details
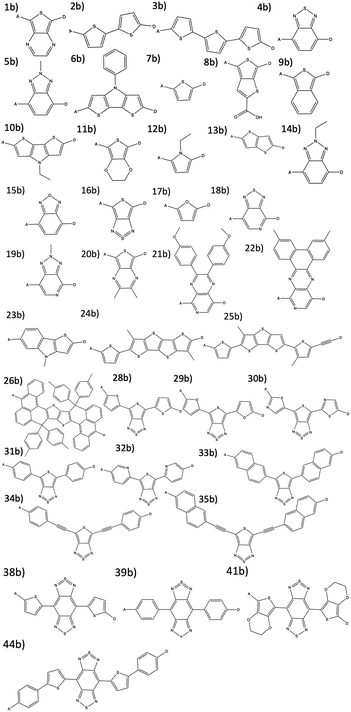
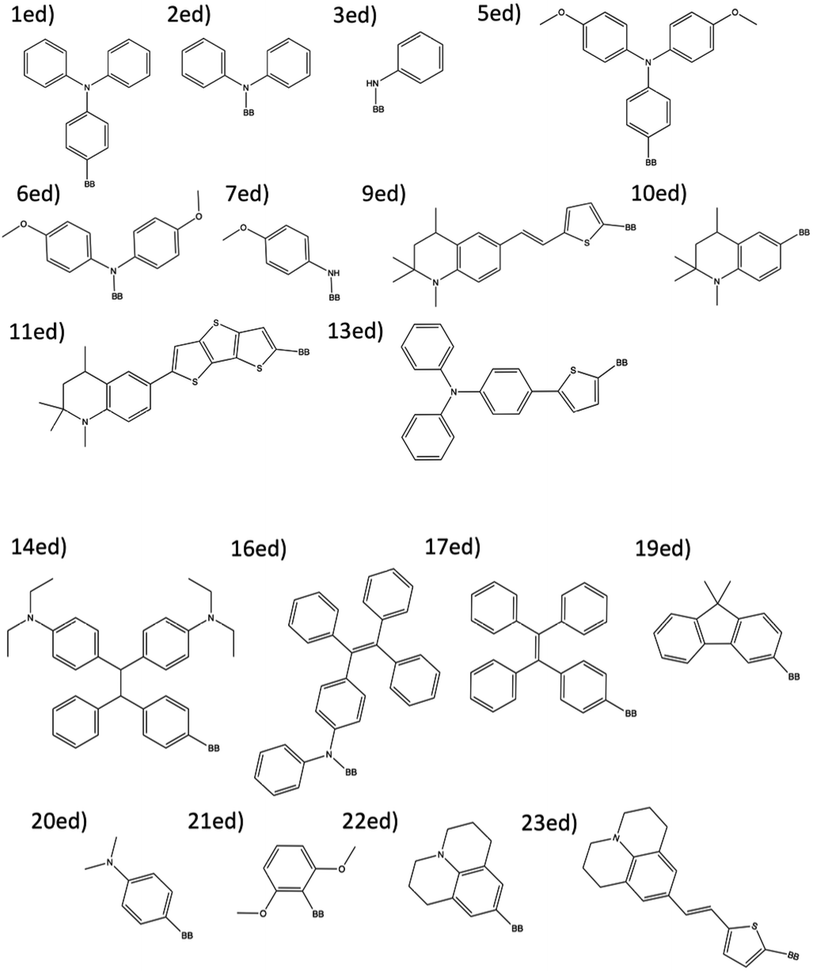
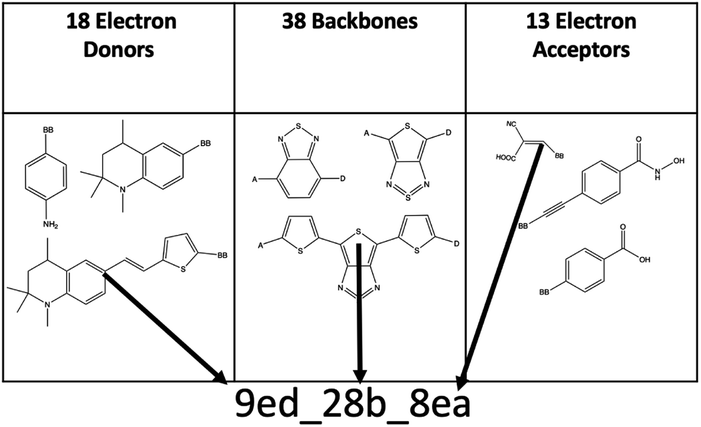
The combinatorial library is generated through a python codebase that connects three substructures together to form a dye within the D–π–A dye framework. Each dye sensitizer has an electron donor (ED), a π-bridge (B), and an electron acceptor (EA). There are 18 EDs, 38 Bs, and 13 EAs considered in this work. Fig. 2–4 depict the substructures in a 2D ChemDraw format. First, each molecular component is given a SMILES string along with both a π-bridge to acceptor connection point (BBA) and a π-bridge to donor connection point (BBD) label. The three SMILES strings are assembled through disconnected dot syntax, and the pieces are adjoined by converting BBA and BBD to unique integers to define connections between the pieces. Fig. 5 illustrates how the SMILES strings combine and shows that the format for naming is ED_B_EA. Finally, the computational package open Babel (OBabel) converts the SMILES strings into Cartesian coordinates87 for quantum chemical computations.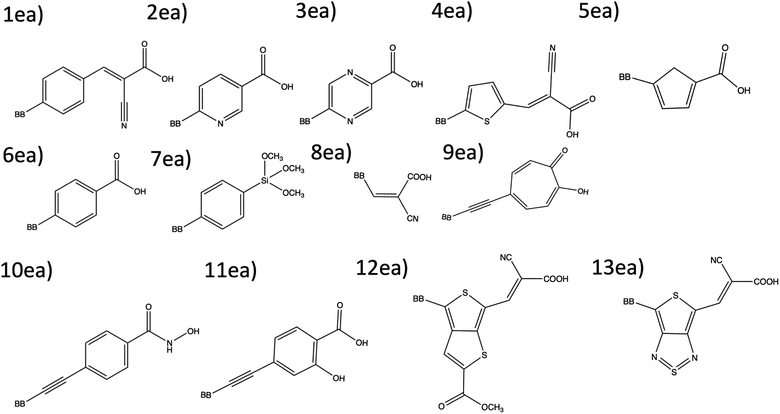 | ||
| Fig. 2 The 13 electron acceptor substructures that are combined, in part, to create theoretical dyes. | ||
There are exactly 7906 unique combinations constructed and presented in this work. After the quantum chemical analysis is undertaken (described above), the main script creates a JSON file that contains the local ED_BB_EA name, generalized SMILES string, HOMO energy, LUMO energy, oscillator strength, and excited state absorption energies. Additionally, the JSON file ensures there are no repeats and creates the possibility to store this data remotely for potential open access to the community. Table S12† lists all of the theoretical dyes' SMILES strings utilized in this work.
3 Computational results
3.1 Benchmark molecule analysis
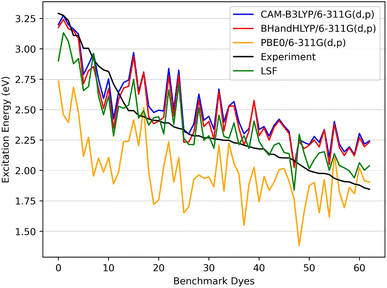 | ||
| Fig. 6 The benchmark dyes excitation energies CAM-B3LYP/6-311G(d,p), BHandHLYP/6-311G(d,p), and PBE0/6-311G(d,p) along with the calculated LSF model with respect to experiment. | ||
In Fig. 6 the CAM-B3LYP and BHandHLYP excitation energies are shown to overestimate the experimental excitation energies 85% and 72% of the time, respectively. However, PBE0 underestimates the experimental excitation energies for 98% of the dyes. By using CAM-B3LYP as an upper energy limit and PBE0 as a lower energy limit, the combination of these methods together produces a range in which the experimental value will fall for 83% of the dyes. Comparatively, if BHandHLYP is an upper energy limit and PBE0 is a lower energy limit, the probability of framing experiment drops from 83% to 71%. As a result, the CAM-B3LYP and PBE0 gap is more likely to produce a better LSF value than the BHandHLYP to PBE0 range.
Thus, a LSF on the CAM-B3LYP and PBE0 excitation energies minimizes the error relative to experiment, and the experimental excitation energies that generally fall between the two methods. Table 1 shows the contributions of CAM-B3LYP and PBE0 for a constructed LSF with each solvation. Fig. S1, S2, and S3† show the DCM, THF, and DMF PCM phase excitation energies. In all cases, the dominate contributor is CAM-B3LYP, but the PBE0 contribution counters the overestimated CAM-B3LYP excitation energies and, as a result, improves the predicted excitation energies. Furthermore, Table 2 shows that the LSF mean absolute error (MAE) has the best predicted excitation energies than simply just using a single DFT functional on its own. Interestingly, BHandHLYP has the best MAE of the standalone DFT methods but only differs from CAM-B3LYP by 0.012 eV (Tables 3 and 4).
| Name | CAM-B3LYPc | PBE0c |
|---|---|---|
| LSFvac | 1.31 | −0.47 |
| LSFDCM | 1.10 | −0.17 |
| LSFTHF | 1.12 | −0.19 |
| LSFDMF | 1.05 | −0.11 |
| Name | MAE LSF | MAE CAM | MAE BHandLYP | MAE PBE |
|---|---|---|---|---|
| Vacuum | 0.13 | 0.21 | 0.19 | 0.36 |
| DCM | 0.13 | 0.16 | 0.15 | 0.43 |
| THF | 0.13 | 0.16 | 0.15 | 0.42 |
| DMF | 0.13 | 0.16 | 0.15 | 0.42 |
| Name | CAM-B3LYPc | PBE0c |
|---|---|---|
| LSF vacuum HOMO | 0.97 | −0.12 |
| LSF DCM HOMO | 0.21 | 0.77 |
| LSF vacuum LUMO | 0.76 | 0.67 |
| LSF DCM LUMO | 0.47 | 0.85 |
| Name | MAE CAM | MAE BHandLYP | MAE PBE | MAE LSF |
|---|---|---|---|---|
| Vacuum HOMO | 0.83 | 0.49 | 0.16 | 0.10 |
| DCM HOMO | 0.86 | 0.52 | 0.11 | 0.08 |
| Vacuum LUMO | 1.52 | 1.41 | 0.65 | 0.16 |
| DCM LUMO | 1.46 | 1.36 | 0.56 | 0.11 |
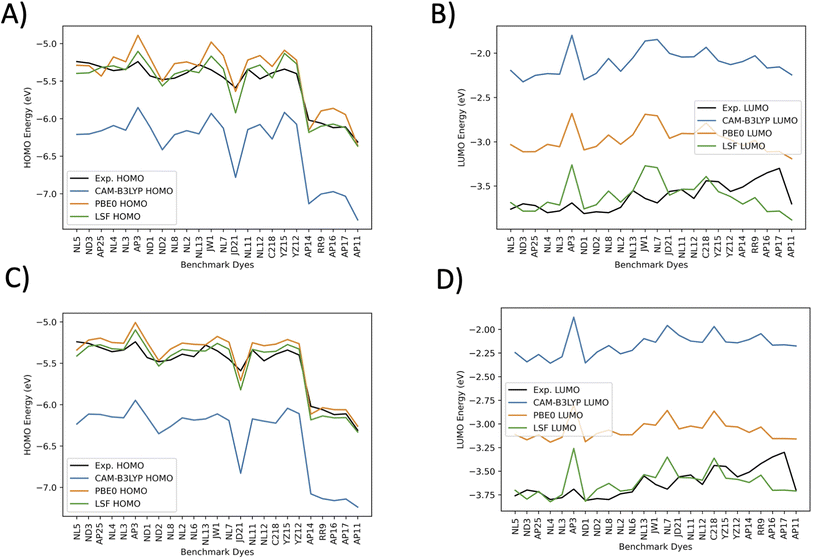
Fig. 7 plots the orbital energies for 25 selected benchmark dyes. Each selected dye orbital energy is measured through the same cyclic voltammetry procedure in DCM, leading to the same electrochemical approximations for orbital energies.40–42,44,56–58,61 This consistency allows the computed orbital energies to be empirically corrected through a LSF once again. Furthermore, all three methods overestimate the LUMO energies. PBE0 is the closest to the experimentally-derived values. CAM-B3LYP and BHandHLYP overestimate the HOMO energies, but PBE0 tends to underestimate the HOMO energies. Interestingly, the pattern for the CAM-B3LYP and PBE0 trend lines nearly perfectly mirror one another. The HOMO energies have less error than the LUMO energies for the benchmarked set. The LSF value exhibits the smallest MAE of 0.08 eV for DCM HOMO energies and 0.11 eV for DCM LUMO energies. When solvation is not involved, the HOMO orbitals are destabilized, and the LSF MAE changes from 0.08 eV to 0.10 eV, which is a difference of 0.02 eV. The LUMO energies have a shift from 0.11 eV to 0.16 eV, a difference of 0.05 eV. The minimum and maximum have a small difference from each other, which indicates that there are no major outliers. Due to the marginal benefit of using solvation for predicting LUMO and HOMO orbitals after applying the LSF, the theoretical study on the D–π–A design, theoretical dyes will utilize the vacuum model.
| Name | Absorption score | LUMO score | Charge transfer score | HOMO donor | LUMO acceptor | LUMO anchor | HOMO energy | LUMO energy | λ max | Total score |
|---|---|---|---|---|---|---|---|---|---|---|
| AP25 | 1 | 93 | 55 | 63 | 66 | 28 | −5.30 | −3.81 | 601 | 149 |
| NL4 | 10 | 100 | 35 | 59 | 33 | 16 | −5.29 | −3.74 | 640 | 145 |
| NL2 | 4 | 99 | 40 | 63 | 39 | 19 | −5.35 | −3.72 | 616 | 143 |
| NL5 | 2 | 99 | 42 | 71 | 39 | 19 | −5.39 | −3.71 | 608 | 142 |
| ND1 | 2 | 87 | 52 | 64 | 62 | 21 | −5.31 | −3.83 | 608 | 141 |
| AP11 | 0 | 0 | 54 | 42 | 67 | 41 | −6.35 | −3.86 | 428 | 0 |
| NL11 | 0 | 63 | 44 | 69 | 42 | 24 | −5.34 | −3.51 | 571 | 0 |
| NL6 | 0 | 0 | 36 | 64 | 32 | 18 | −5.58 | −3.99 | 540 | 0 |
| NL13 | 0 | 68 | 45 | 61 | 48 | 24 | −5.38 | −3.53 | 578 | 0 |
| NL12 | 0 | 63 | 46 | 75 | 43 | 24 | −5.28 | −3.51 | 569 | 0 |
| ND2 | 0 | 100 | 45 | 24 | 66 | 23 | −5.56 | −3.75 | 580 | 0 |
| ND3 | 0 | 0 | 47 | 44 | 62 | 21 | −5.38 | −3.86 | 620 | 0 |
| AP14 | 0 | 91 | 60 | 50 | 72 | 45 | −6.17 | −3.64 | 431 | 0 |
| JW1 | 0 | 11 | 37 | 60 | 34 | 19 | −5.17 | −3.23 | 580 | 0 |
| JD21 | 0 | 65 | 36 | 36 | 36 | 36 | −5.93 | −3.52 | 562 | 0 |
| C218 | 0 | 28 | 47 | 75 | 38 | 38 | −5.46 | −3.35 | 506 | 0 |
| AP17 | 0 | 100 | 68 | 92 | 70 | 42 | −6.12 | −3.73 | 396 | 0 |
| AP16 | 0 | 100 | 68 | 91 | 70 | 42 | −6.07 | −3.75 | 405 | 0 |
The best total score is AP25 at 149, but NL4, NL2, NL5, and ND1 are relatively close. AP11, AP14, AP16, AP17, C218,44 JD21,44 and JW1 (ref. 56) are computed to produce λmax values below 600 nm. The ND series λmax values are above 600 nm save for ND2. Furthermore, the ND3 λmax is above 600 nm, but the LUMO energy is too negative leading to a 0 score. ND1 is the only dye of that series that scores, and scores a 141. To reiterate, the maximum target score is 300. Thus, much room for improvement remains in the design of dye molecules with ideal properties.
3.2 Novel dyes
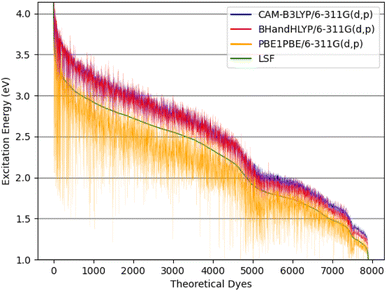 | ||
| Fig. 8 The theoretical dyes' excitation energies for the quantum chemical methods: CAM-B3LYP/6-311G(d,p), BHandHLYP/6-311G(d,p), and PBE0/6-311G(d,p) along with the calculated LSF model. | ||
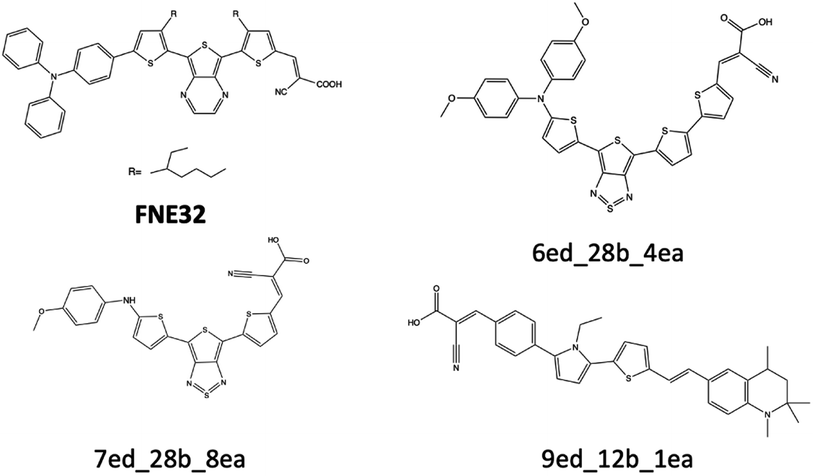 | ||
| Fig. 9 FNE32 benchmark dye and three theoretical dyes that are discussed for their excitation energy properties. | ||
The excitation energy is most often in a range between CAM-B3LYP and PBE0. For example, the 6ed_28b_4ea CAM-B3LYP excitation energy is 832 nm, but the PBE0 excitation energy is 918 nm. As a result, the size of the CAM-B3LYP to PBE0 range is 86 nm with a percent change of 11%. Furthermore, the predicted LSF value is within this 86 nm span, and that provides bounds for any physical experiment beyond simply the predicted LSF wavelength. Additionally, the percent difference is 32% for the CAM-B3LYP to PBE0 λmax range for 9ed_12b_1ea (shown in Fig. 9), and the minimum percent difference size is 4% for 7ed_28b_8ea (shown in Fig. 9). The mode for the percent change size is 14%, and the absolute average percent range is 15%. As a result, any actual experimental value for these predicted dyes will more likely fall in between a 15% interval of the CAM-B3LYP to PBE0 excitation energies.
The main reason that the theoretical dyes have lower LSF excitation energies than FNE32 is the π-bridge substructure. The overwhelming majority of the 2992 theoretical dyes with predicted longer wavelength LSF excitation energies than FNE32 share the 16b (or a derivative of 16b) π-bridge substructure. Fig. S5† shows the frequency of each common π-bridge substructure involved. Specifically, 2678 of the theoretical dyes have the π-bridge substructure including 16b, 28b, 29b, 30b, 31b, 33b, 32b, 34b, or 35b, which are all based on the thienthiadiazole building block. The other 314 theoretical dyes are predominantly the π-bridge substructures 1b (benzothiadiazole) or 20b (thienopyrazine).
Additionally, the excitation energy should not be significantly affected by slight shifts in the dihedral angles between the donors, π-bridges, and acceptor portions. Preliminary computations on 23ed_20b_1ea twist the donor and acceptor dihedrals to as much as 90° relative to the π-bridge independently as well as both dihedral twists with in the same tested structure. The excitation energies change by less than 0.005 eV in all instances in line with previous work.77
The spectral regions are considered as would be used in tandem or multi-junction devices which are known to give higher PCE than single chromophore devices.89–93 The 400–600 nm range is the high voltage region,88 the 600–800 nm range is the balanced region between current and voltage, and the 800–1000 nm range is the high current region. Combining a strategically chosen region for the DSC with any solar cell technology can theoretically improve the performance relative to single absorber devices.91 Thus, depending on application, all three regions are valuable, and all three regions require the LUMO to be near to but more positive than TiO2 on the vacuum scale for maximum efficiency.
Fig. S6A† gives the MO energies of 980 dyes that have λmax values between 800 and 1000 nm. Of these, there are 128 proposed dyes that have a more positive LUMO energy than the TiO2 conduction band, rendering them candidates for the orbital analysis step. 61 theoretical dye LUMO energies are above −3.85 eV, and will go on to the scoring procedure. 6ed_29b_7ea (shown in Fig. S20†) has the most positive LUMO energy in the 800 to 1000 nm group. Specifically, the LUMO energy is −3.44 eV, and the HOMO energy is −4.78 eV. Furthermore, the theoretical dye with the most negative HOMO energy and a LUMO energy greater than −3.85 eV is 6ed_16b_5ea. The HOMO energy is −5.16 eV while the LUMO energy is −3.60 eV making 6ed_16b_5ea an optimal candidate for the charge transfer step.
Fig. S6B† gives the MO diagram for 2124 theoretical dyes with λmax values in the 600 to 800 nm range. Typically, when the wavelength lowers, the energy gap of the dyes will become larger. As a result, there are 330 theoretical dyes that have LUMO energies above −3.85 eV, which is 269 more dyes than the 800 to 1000 nm group. 22ed_11b_9ea (shown in Fig. S21†) has the most positive LUMO energy at −2.67 eV. 21ed_16b_2ea has the most negative HOMO energy of −5.82 eV with a LUMO energy of −3.65 eV. Lastly, 13ed_20b_1ea is the most negative HOMO energy of −5.44 eV with a LUMO energy that is at the limit of −3.85 eV LUMO energy level.
Fig. S6C† shows the HOMO and LUMO energies for 4346 theoretical dyes with λmax values that reside in the 400 to 600 nm range. This group has the largest band gaps and, as a result, has the most dye molecules with LUMO energies above −3.85 eV: 4099 theoretical dyes. The most common goal in this range is to have a LUMO well positioned with respect to the TiO2 conduction band, followed by the most negative HOMO possible since the maximal photovoltage output possible is related to the HOMO energy level for the dye in question. 22ed_11b_7ea (shown in Fig. S22†) has the most positive LUMO energy at −0.97 eV. 17ed_22b_4ea also (shown in Fig. S22†) shows the most negative HOMO energy at −5.98 eV, and 1ed_24b_12ea (in Fig. S22†) has the most positive HOMO energy at −5.60 eV.
| Name | HOMO donor (%) | LUMO acceptor (%) | LUMO anchor (%) | HOMO (eV) | LUMO (eV) | λ max (nm) | Score |
|---|---|---|---|---|---|---|---|
| 22ed_16b_5ea | 35 | 9 | 4 | −5.06 | −3.7 | 807 | 164 |
| 6ed_16b_5ea | 30 | 8 | 4 | −5.16 | −3.6 | 803 | 147 |
| 22ed_29b_7ea | 21 | 1 | 0 | −4.79 | −3.51 | 850 | 0 |
| 22ed_26b_11ea | 19 | 1 | 0 | −5.04 | −3.6 | 903 | 0 |
| 6ed_29b_6ea | 17 | 3 | 1 | −4.91 | −3.68 | 865 | 0 |
| 5ed_29b_7ea | 28 | 2 | 0 | −4.9 | −3.66 | 826 | 0 |
| 6ed_29b_2ea | 17 | 3 | 1 | −4.9 | −3.69 | 866 | 0 |
| 3ed_29b_7ea | 11 | 2 | 0 | −4.88 | −3.57 | 854 | 0 |
| 6ed_29b_10ea | 16 | 3 | 0 | −4.9 | −3.64 | 844 | 0 |
| 10ed_28b_7ea | 20 | 2 | 0 | −4.97 | −3.74 | 839 | 0 |
| 6ed_29b_5ea | 16 | 4 | 1 | −4.88 | −3.73 | 880 | 0 |
| 16ed_29b_7ea | 16 | 2 | 0 | −4.97 | −3.66 | 832 | 0 |
| 9ed_29b_7ea | 32 | 2 | 0 | −4.87 | −3.75 | 852 | 0 |
| 10ed_29b_7ea | 18 | 2 | 0 | −4.86 | −3.58 | 846 | 0 |
| 7ed_29b_7ea | 13 | 2 | 0 | −4.85 | −3.53 | 852 | 0 |
| 20ed_29b_7ea | 15 | 2 | 0 | −4.86 | −3.58 | 845 | 0 |
| 7ed_29b_9ea | 12 | 6 | 1 | −4.9 | −3.74 | 856 | 0 |
| 20ed_28b_7ea | 15 | 2 | 0 | −4.99 | −3.74 | 837 | 0 |
| 7ed_28b_7ea | 16 | 2 | 0 | −4.97 | −3.7 | 850 | 0 |
| 6ed_29b_7ea | 17 | 2 | 0 | −4.78 | −3.44 | 867 | 0 |
| 21ed_29b_7ea | 9 | 2 | 0 | −5.05 | −3.68 | 800 | 0 |
| 6ed_29b_9ea | 16 | 3 | 1 | −4.92 | −3.68 | 846 | 0 |
| 21ed_28b_7ea | 8 | 2 | 0 | −4.99 | −3.68 | 835 | 0 |
| 6ed_29b_11ea | 17 | 3 | 1 | −4.9 | −3.7 | 868 | 0 |
| 6ed_28b_7ea | 20 | 2 | 0 | −4.85 | −3.61 | 872 | 0 |
| 22ed_28b_7ea | 25 | 2 | 0 | −4.91 | −3.62 | 820 | 0 |
Table 7 shows the attributes, and score of the top 50 scoring theoretical dyes that have LUMO energies above −3.85 eV for the 600–800 nm group. In the same vein as the 800 to 1000 nm group, the problem is the electron density is often trapped on the π-bridge rather than the electron acceptor and its anchor. Case in point, the 10ed_16b_9ea (Fig. 13) has the best score at 154/300. The strength of this theoretical dye is the λmax of 755 nm and a LUMO value of −3.74 eV. The next best candidate has better charge transfer tendencies, but only has a λmax of 641 nm. The major difference between the best and next-best scoring dyes is the λmax and LUMO anchor %, which results in 16b behaving as a stronger electron sink than 9b (benzothiophene). Since, 9b is a weaker acceptor, the charge transfer process more efficiently reaches the anchor. As a result, the 23ed_9b_4ea LUMO has 12% electron density on the anchor. Finally, the molecules give in Table 7 are more likely to produce the highest PCE and to approach the Shockley–Queissar as individual devices.
| Name | HOMO donor | LUMO acceptor | LUMO anchor | HOMO | LUMO | λ max | Score |
|---|---|---|---|---|---|---|---|
| 10ed_16b_9ea | 32 | 14 | 4 | −5.14 | −3.74 | 755 | 154 |
| 23ed_9b_4ea | 63 | 48 | 12 | −5.18 | −3.72 | 641 | 152 |
| 23ed_20b_4ea | 66 | 35 | 9 | −5.08 | −3.82 | 706 | 152 |
| 22ed_16b_2ea | 43 | 8 | 4 | −5.24 | −3.71 | 746 | 151 |
| 6ed_8b_12ea | 27 | 50 | 12 | −5.36 | −3.75 | 665 | 151 |
| 10ed_20b_12ea | 32 | 39 | 10 | −5.28 | −3.74 | 681 | 150 |
| 5ed_16b_9ea | 45 | 17 | 4 | −5.14 | −3.82 | 753 | 148 |
| 20ed_16b_5ea | 30 | 9 | 4 | −5.21 | −3.82 | 780 | 147 |
| 9ed_9b_12ea | 60 | 49 | 12 | −5.3 | −3.8 | 638 | 147 |
| 2ed_9b_12ea | 20 | 54 | 13 | −5.47 | −3.72 | 642 | 145 |
| 6ed_1b_12ea | 26 | 34 | 8 | −5.36 | −3.7 | 683 | 144 |
| 20ed_16b_9ea | 32 | 9 | 4 | −5.29 | −3.78 | 725 | 143 |
| 23ed_20b_1ea | 72 | 34 | 10 | −5.09 | −3.65 | 650 | 142 |
| 9ed_20b_1ea | 68 | 33 | 10 | −5.2 | −3.68 | 643 | 142 |
| 23ed_1b_3ea | 76 | 15 | 7 | −5.19 | −3.79 | 664 | 141 |
| 5ed_16b_2ea | 59 | 9 | 4 | −5.26 | −3.69 | 693 | 140 |
| 11ed_20b_1ea | 73 | 32 | 10 | −5.3 | −3.79 | 624 | 139 |
| 5ed_9b_12ea | 43 | 56 | 14 | −5.37 | −3.64 | 621 | 138 |
| 11ed_1b_5ea | 67 | 14 | 7 | −5.25 | −3.68 | 658 | 137 |
| 11ed_26b_8ea | 91 | 22 | 13 | −5.36 | −3.65 | 626 | 136 |
| 5ed_20b_12ea | 49 | 39 | 10 | −5.28 | −3.84 | 677 | 136 |
| 20ed_20b_4ea | 37 | 41 | 12 | −5.41 | −3.67 | 627 | 135 |
| 20ed_20b_12ea | 32 | 47 | 11 | −5.4 | −3.66 | 630 | 135 |
| 7ed_1b_12ea | 18 | 26 | 6 | −5.39 | −3.76 | 667 | 135 |
| 23ed_1b_1ea | 72 | 28 | 8 | −5.16 | −3.85 | 680 | 134 |
| 11ed_1b_9ea | 63 | 26 | 6 | −5.22 | −3.65 | 646 | 134 |
| 11ed_1b_3ea | 77 | 14 | 6 | −5.35 | −3.76 | 623 | 133 |
| 1ed_20b_4ea | 53 | 38 | 5 | −5.46 | −3.7 | 601 | 132 |
| 16ed_20b_4ea | 42 | 41 | 12 | −5.52 | −3.66 | 617 | 131 |
| 20ed_16b_2ea | 38 | 7 | 4 | −5.41 | −3.83 | 719 | 131 |
| 13ed_1b_5ea | 61 | 16 | 8 | −5.35 | −3.67 | 642 | 130 |
| 6ed_1b_4ea | 36 | 31 | 9 | −5.45 | −3.64 | 654 | 130 |
| 5ed_20b_4ea | 60 | 36 | 4 | −5.3 | −3.64 | 624 | 130 |
| 10ed_20b_4ea | 43 | 38 | 11 | −5.39 | −3.64 | 629 | 130 |
| 11ed_1b_11ea | 73 | 12 | 5 | −5.34 | −3.7 | 621 | 129 |
| 23ed_20b_8ea | 73 | 17 | 10 | −5.24 | −3.84 | 659 | 128 |
| 16ed_9b_12ea | 30 | 55 | 13 | −5.48 | −3.61 | 616 | 128 |
| 22ed_20b_4ea | 43 | 42 | 11 | −5.25 | −3.58 | 652 | 127 |
| 2ed_20b_12ea | 26 | 46 | 11 | −5.53 | −3.64 | 617 | 127 |
| 2ed_20b_4ea | 32 | 38 | 11 | −5.57 | −3.66 | 617 | 127 |
| 1ed_20b_12ea | 49 | 45 | 11 | −5.49 | −3.83 | 613 | 127 |
| 9ed_26b_8ea | 84 | 22 | 13 | −5.31 | −3.61 | 624 | 126 |
| 22ed_1b_8ea | 52 | 16 | 10 | −5.57 | −3.74 | 606 | 125 |
| 11ed_20b_3ea | 75 | 17 | 7 | −5.35 | −3.68 | 602 | 125 |
| 10ed_1b_1ea | 52 | 33 | 10 | −5.49 | −3.65 | 603 | 125 |
| 16ed_1b_1ea | 50 | 32 | 10 | −5.63 | −3.65 | 602 | 124 |
| 3ed_1b_4ea | 20 | 24 | 7 | −5.62 | −3.8 | 629 | 121 |
| 16ed_20b_12ea | 36 | 45 | 10 | −5.5 | −3.6 | 611 | 120 |
| 22ed_1b_1ea | 50 | 36 | 11 | −5.35 | −3.58 | 625 | 119 |
| 6ed_26b_8ea | 43 | 22 | 13 | −5.18 | −3.61 | 619 | 115 |
3.3 Selected theoretical dyes
In order to highlight the results of what the combinatorial analysis has produced, first, Fig. S24† illustrates the molecular geometry, the HOMO, and the LUMO for theoretical dye 22ed_16b_5ea, which scored the highest study at 164. The anchor is a carboxylic acid functionalized onto a 5-membered ring. Fig. S24A† shows how the HOMO electron density is spread throughout the molecule. Specifically, this dye exhibits 36% of the electron density of the HOMO on the donor substructure, 38% on the thienothiadiazole group, 9% on the acceptor substructure, and only 4% on the anchor. The electron density of the LUMO spreads mostly on the π-conjugated substructure with 78% of the electron density. This highlights that a majority of the molecular orbitals surrounds the π-bridge. The low percentage of electron density of the LUMO on the anchor indicates that the molecule may poorly transfer electrons to the semiconductor. However, the dye has an excellent LSF λmax of 807 nm, which is ≈100 nm longer in wavelength than the most red LSF benchmark dye, FNE32, and the LUMO energy is sufficiently above the TiO2 conduction band, implying that it will minimize loss-in-potential energy during injection. Specifically, in Table S6,† the absorption score and LUMO score for theoretical dye, 22ed_16b_5ea are 52% and 98%, and the charge transfer scored the lowest at 14%. In spite of these promising photophysical features, the presence of the 16b moiety produces other drawbacks including difficulty in its potential synthesis. Since disymmetric synthetic example molecules with thienothiadiazole dyes are not readily available and numerous synthetic attempts by our team to install the thienothiadiazole ring late stage were unsucessful due to numerous competing reactions when attempting to synthesize a basic model structure with a carboxylic acid using 16b.Fig. S25† illustrates the molecular geometry, the HOMO, and the LUMO for theoretical dye 9ed_20b_1ea which scores 142. Specifically, for 9ed_20b_1ea, 68% of the electron density of the HOMO is on the donor substructure, 20% is on the π conjugated substructure, 9% is on the acceptor substructure, and only 3% is on the anchor. Furthermore, the 9ed_20b_1ea electron density for the LUMO is 18% on the donor, 48% on the π-bridge, 33% on the acceptor, and 11% on the anchor. Alternatively from 22ed_16b_5ea, a majority of the electron density is either on the HOMO donor or LUMO acceptor, which indicates this would be an improvement in the electrons transfer to the semiconductor. This causes the charge transfer score to increase to 36%, but the λmax score decreases to 11%. However, the λmax is still 10 nm longer than FNE32. Lastly, simlar to 22ed_16b_5ea, the LUMO score is above 90% and is sufficiently above the TiO2 conduction band, making this a potentially promising synthetic target.
Fig. 10 illustrates the molecular geometry, the HOMO, and the LUMO for theoretical dye 23ed_20b_1ea, which scores the same as 9ed_20b_1ea but with more promising properties. Specifically, 23ed_20b_1ea exhibits 72% of the electron density of the HOMO on donor substructure, 18% on the π-conjugated substructure, 6% on the acceptor substructure, and only 2% on the anchor (Table S7†). Furthermore, the electron density for the LUMO of 23ed_20b_1ea is 9% on the donor, 48% on the π-conjugated backbone, 34% on the acceptor, and 11% on the anchor (Table S7†). The properties for 23ed_20b_1ea are just slightly better than the properties of 9ed_20b_1ea. The biggest difference is that 9ed_20b_1ea HOMO energy is −5.20 eV, and the 23ed_20b_1ea HOMO energy is −5.09 eV, which is a 0.11 eV energy shift.
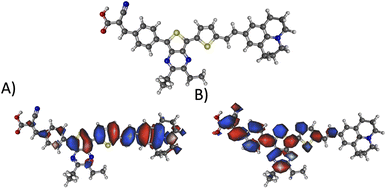 | ||
| Fig. 10 The geometry and selected orbitals for theoretical dye, 23ed_20b_1ea. (A) HOMO and (B) LUMO. | ||
Fig. 10A shows that the HOMO electron density resides between the π-bridge substructure and the electron donor substructure. Furthermore, Fig. 10B shows that the LUMO electron density is not on the electron donor region of the molecule. As mentioned before, the percentage change between the HOMO and LUMO donor, the HOMO and LUMO acceptor, and the HOMO and LUMO anchor indicates promising charge transfer properties. As a result, 23ed_20b_1ea is a promising synthetic target. Additionally, the synthetic approach for producing this molecule (discussed below) has the fewest perceived roadbloacks of the high-scoring dyes theoretically determined. As a result, this dye is selected for synthesis and experimental analysis and is coded WM3 once synthesized.
4 Synthesis and experimental characterization
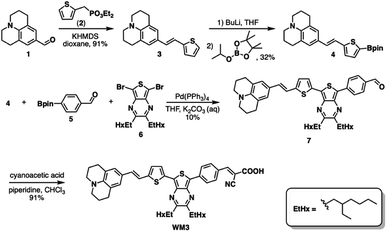
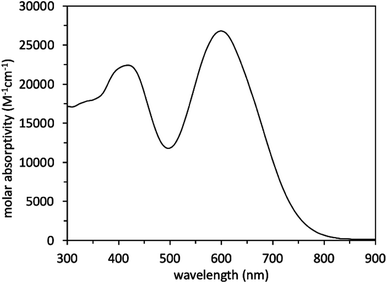
Scheme 1 illustrates a schematic of the synthesis procedure to reach the target molecular dye, WM3. The target structure synthesis begins by subjecting 1 to the Horner–Wadsworth–Emmons reaction using 2 and KHMDS as a base to yield 3 at 91% yield. Subsequently, The borylation of 3 occurs via deprotonation with n-butyl lithium and the addition of isopropyl pinacol borate to yield 4 at 32% yield. While the isolated yield of this reaction is quite low, both steps of the reaction appear to be nearly quantitative in conversion (as seen by 1H-NMR monitoring), which indicates a much higher reaction yield. Qualitative observations show that the isolated yield diminishes due to the instability of the product during the column chromatography purification process because the purified product decomposes at a significant rate on silica as seen via 2D TLC. With 4 in hand, a double Suzuki reaction is run along with 5 and 6 (synthesized as previously described)94 to yield the aldehyde precursor, 7, in 10% overall yield. The reaction yield is quite low because of several side products that include the dicoupled acceptor, the dicoupled donor, side reactions of 6 and deborylation of both Bpin starting materials. With the aldehyde in hand though, a Knoevenagel condensation creates the final product, WM3, in an excellent 91% yield. Notably, while some of the yields are low for some steps, the dye is rapidly accessible in just four linear synthetic steps from the commercial donor 1.Analysis of the WM3 solution photophysical and electrochemical properties determines if the dye has suitable energetics to function inside a DSC device. In DCM solution, absorption spectroscopy reveal the photophysical properties are an absorption maximum (λmax) of 604 nm for the primary transition. An additional lower energy feature is present at a higher energy (400 nm, Fig. 11 and Table 8). The experimental λmax blue shifts 46 nm or 0.14 eV (604 nm versus 650 nm, 2.05 eV versus 1.91 eV) from the theoretical λmax, which is a shift of less than 7%. Furthermore, the lower energy feature exhibits a molar absorptivity of 27![[thin space (1/6-em)]](https://www.rsc.org/images/entities/char_2009.gif) 000 M−1 cm−1, which is typical of charge transfer dyes for DSC applications. The combination of the two overlapping features maintain a respectable molar absorptivity (>10
000 M−1 cm−1, which is typical of charge transfer dyes for DSC applications. The combination of the two overlapping features maintain a respectable molar absorptivity (>10![[thin space (1/6-em)]](https://www.rsc.org/images/entities/char_2009.gif) 000 M−1 cm−1) across the entire visible spectrum and demonstrates the potential to be a panchromatic sensitizer which is a desirable feature in dyes for high current DSC devices. The absorption spectrum of WM3 in DCM solution onsets at 760 nm (via the tangent line of the downward slope on the low energy side of the lowest energy absorption feature). The equation Eoptg = 1240/λonset determines the Eoptg to be 1.63 eV. This is comparable to the absorption onset of other NIR DSC dyes such as the record setting benchmark dye AP25 (ref. 42) (Fig. S5†), which has an absorption onset of 780 nm and an Eoptg of 1.59 eV.
000 M−1 cm−1) across the entire visible spectrum and demonstrates the potential to be a panchromatic sensitizer which is a desirable feature in dyes for high current DSC devices. The absorption spectrum of WM3 in DCM solution onsets at 760 nm (via the tangent line of the downward slope on the low energy side of the lowest energy absorption feature). The equation Eoptg = 1240/λonset determines the Eoptg to be 1.63 eV. This is comparable to the absorption onset of other NIR DSC dyes such as the record setting benchmark dye AP25 (ref. 42) (Fig. S5†), which has an absorption onset of 780 nm and an Eoptg of 1.59 eV.
| Name | λ max (nm) | Molar Abs. (M−1 cm−1) | λ onset (nm) | E optg (eV) | E S+/S (eV) | E S+/S* (eV) |
|---|---|---|---|---|---|---|
| a * see ‘device fabrication’ in the ESI for device manufacturing, electrode, dipping, and electrolyte components. | ||||||
| WM3 | 604 | 27![[thin space (1/6-em)]](https://www.rsc.org/images/entities/char_2009.gif) 000 000 |
760 | 1.63 | 0.6 | −1.03 |
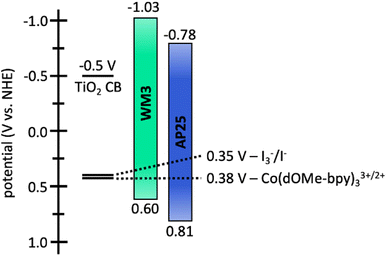
The electrochemical properties of WM3 are analyzed with cyclovoltammetry in DCM solution that contains a 0.1 M tetrabutylammonium hexafluorophosphate (TBAPF6) electrolyte in order to determine the oxidation potential (E(S+/S)) of the dye (Fig. 12, S6,†Table 8). The E(S+/S) value is 0.60 V versus the normal hydrogen electrode (NHE) when taking ferrocenium/ferrocene (Fc+/Fc) at 0.70 vs. NHE in DCM.95,96 The exceptionally electron rich julolidine donor produces a remarkably negative E(S+/S) value (on the NHE scale) for a DSC dye, which previous literature supports.97 Using the information from the solution absorption and cyclic voltammetry experiments, the equation E(S+/S*) = E(S+/S) − Egopt calculates the excited state oxidation potential (E(S+/S*)) to be −1.03 eV. As a result, the WM3 E(S+/S*) is 250 mV higher than AP25 (−1.03 V vs. −0.78 V, respectively) and leaves a generous 530 mV overpotential for injection of electrons into the conduction band (CB) of TiO2 (Fig. 12). Since many NIR DSC dyes struggle with injection efficiency due to E(S+/S*) values being too positive versus NHE, high Li+ loadings are often required to generate respectable photocurrent as is the case with AP25, the more negative E(S+/S*) value of WM3 is an attractive feature since high Li+ loadings are undesirable because they lower the maximum device VOC by downward shifting the TiO2 conduction band
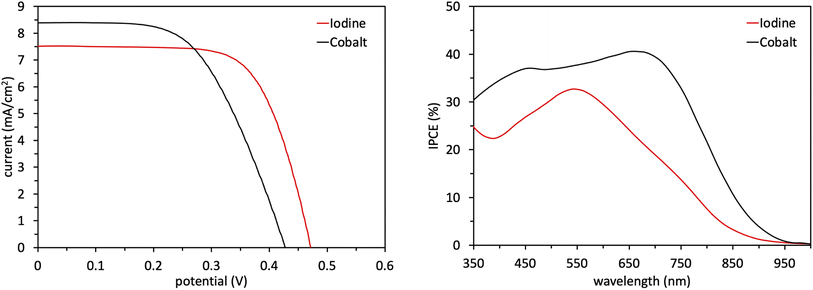
Following the characterization and interpretation of the dye energetics, WM3 is suitable energetically for incorporation into a DSC device. The experimental section of the ESI† discusses the parameters and procedure for how the device is fabricated. Since the WM3 E(S+/S) value is 0.60 V (Fig. 12 and S6,†Table 8) a redox shuttle with a more negative redox couple is chosen, which includes I3−/I− (I-RS, 0.35 V vs. NHE) and Co(dOMe-bpy)33+/2+ (Co-RS, 0.38 V vs. NHE, synthesized as previously described98). The WM3 devices produce a photocurrent of 7.6 mA cm−2 for I-RS cells and 8.3 mA cm−2 for Co-RS cells as seen in the current density–voltage (J–V) plot (Fig. 13, left; Table 9). I-RS cells produce a slightly higher open-circuit voltage (VOC) than the Co-RS cells by ≈40 mV (472 mV versus 434 mV, respectively) and higher fill factors (FF, 68.5% versus 57.8%, respectively). The higher VOC and FF of the I-RS cells leads to an overall higher PCE (determined by the equation PCE = (JSC × VOC × FF)/I0 where I0 is the incident photon flux calibrated to be 1 sun (100 mW cm−2)), with I-RS cells having a PCE of 2.45% versus that of 2.08% observed for the Co-RS containing cells. Both devices have substantial losses in VOC compared to the theoretical maximum which is based on the energy difference between the conduction band of TiO2 (−0.5 V versus NHE, Fig. 13) and the redox couple of the electrolyte. I-RS-based devices produce 55% of the theoretical max VOC of 850 mV, and Co-RS-based DSCs produce 49% of the theoretical max VOC of 880 mV. A predominant VOC loss mechanism likely originates from recombination between injected electrons and the oxidized dye at the TiO2−dye interface due to a low driving force for regeneration (ΔGreg) of only 250 mV, which is a significantly low value for the iodide/triiodide redox couple.99
| Name | V OC (mV) | J SC (mA cm−2) | FF (%) | PCE (%) |
|---|---|---|---|---|
| Iodine | 472 ± 2 | 7.6 ± 0.1 | 68.5 ± 0.1 | 2.45 ± 0.04 |
| Cobalt | 434 ± 9 | 8.3 ± 0.3 | 57.8 ± 1.2 | 2.08 ± 0.01 |
IPCE measurements are consistent with the J–V plots where WM3 cells that contain the Co-RS electrolyte for both a higher JSC and IPCE response than I-RS cells (Fig. 13, right). Co-RS containing cells have a peak IPCE of just over 40% at ≈700 nm while I-RS containing cells has a peak IPCE of just over 30% at ≈550 nm. Both electrolyte conditions produce an impressive IPCE onset with I-RS cells that generate a photocurrent out to 900 nm and the Co-RS cells that generate a photocurrent out to 950 nm. The fabrication of a DSC device that produces electricity until 950 nm and low lithium loadings of 0.05–0.10 M is an exceptional result. Unfortunately, a redox shuttle is not directly obvious to pair with WM3 to showcase the exceptional performance the dye can theoretically produce, since a more negative redox potential system than the I-RS or Co-RS is needed for efficient regeneration. These two shuttles are some of the most negative potential shuttles known versus NHE. A more negative shuttle would increase the ΔGreg and undoubtedly boost the peak IPCE value and JSC values experimentally.
Table 10 showcases the importance of the WM3 discovery by extrapolating device performances if a well-matched redox shuttle were found based on parameters from examples of well matched shuttle dye pairs from literature. This extrapolative analysis consists of common reasonable values that are based off of well-studied and highly optimized DSC systems that have a FF of 70%, a ΔGreg of 250 mV, a 200 mV voltage loss,100 a 300 mV driving force for injection, and an optimized 90% IPCE. The equation VOC = VmaxOC − (ΔGreg + VlossOC) extrapolates the VOC values, where VmaxOC is the energetic distance from the TiO2 conduction band to the dye oxidation potential (or HOMO) and VlossOC value accounts for non-ideal device behavior with respect to the direction of electron transfer (e.g. losses due to recombination). Lastly, the current is calculated at a rate of 7.0 mA cm−2 per 100 nm and is only applied in measurements beyond 400 nm in order to compute the JSC term.16 For example, as mentioned in the introduction section, the highest known PCE of porphyrin systems is 14.2% from the SGT-149+SGT-021 co-sensitized DSC system.9 Using the above assumption, the SGT-149+SGT-021 co-sensitized DSC system PCE would increase from 14.2% to 15.2% meaning some loss mechanisms could practically be corrected based on empirically observed literature values. Furthermore, under the same assumptions, a device that couples WM3 with a high quality redox shuttle has a PCE of 17.5%, which surpasses the present DSC performance record by 2.2%.7 Critically, the ability of WM3 to generate high photocurrents and broad absorption properties is important for sequential series multijunction (SSM)-DSCs.42,89,90,101
| Name of dye | V oc (V) | J sc (mA cm−2) | PCE (%) | IPCE onset (nm) |
|---|---|---|---|---|
| a Observed values.9 | ||||
| Single active area devices | ||||
| RR9 | 1.61 | 7.0 | 7.9 | 500 |
| D35 | 1.09 | 14.0 | 10.7 | 600 |
| 2ed_4b_8ea | 1.60 | 14.0 | 15.7 | 600 |
| SGT-149+SGT-021a | 0.91 | 20.9 | 14.2 | 750 |
| SGT-149+SGT-021 | 0.89 | 24.5 | 15.2 | 750 |
| WM3 | 0.65 | 38.5 | 17.5 | 950 |
![[thin space (1/6-em)]](https://www.rsc.org/images/entities/char_2009.gif) |
||||
| SSM-DSC systems | ||||
| D35/SGT-149 + SGT-021 | 2.00 | 12.2 | 17.1 | |
| SGT-149 + SGT-021/WM3 | 1.54 | 19.2 | 20.7 | |
| D35/SGT-149 + SGT-021/WM3 | 2.65 | 10.4 | 19.2 | |
| 2ed_4b_8ea/SGT-149+SGT-021/WM3 | 3.14 | 12.2 | 26.8 | |
Similar to tandem systems, SSM-DSC devices use a single illuminated area. However, an important note is that tandem specifically refers to the use of 2 active areas and SSM-DSCs, as constructed in our lab, can have up to 5 active area devices wired in series. In SSM-DSC devices, The sum of the individual active layer DSC device voltages is the total voltage, but the smallest photocurrent output of any active layer is the total amount of photocurrent. The photocurrent is not summed because the photons pass through one layer to the next, and the earlier active layers filter out photons before reaching the lower active layers. As a result, there is a reduction in the possible amount of photocurrent between the active layers. Theoretically, a tandem system using SGT-149+SGT-021/WM3 would give a PCE of 20.7% which renders DSCs competitive with organic photovoltaics and perovskites based on PCE analysis alone. Furthermore, a theoretical molecular dye that is suitable for a high-voltage device (i.e. a largely negative HOMO value and a vertical transition centered at 500 nm), such as 2ed_4b_8ea (shown in Fig. 14), could improve the PCE to 26.8%. Notably, this higher voltage dye would be an improvement over current higher voltage systems such as RR9 and D35 due to a balance between current and photovoltage that would align well with SGT-149+SGT-021 (Table 10).61 Interestingly, without a target dye approach that can identify promising targets in all spectral regions, such as that set forward in this study, it would be difficult to realize such a system especially given that desirable redox shuttles may not be known for the high photocurrent and high photovoltage dyes. The probing of possible DSC devices constructs a best case scenario estimation that quickly let researchers know the potential return on their research efforts and showcases the value of a broad combinatorial library system that creates new molecular dyes. Also, this approach clarifies a direction available for boosting DSC devices to values beyond 20% PCE.
5 Conclusions
From a computational perspective, the D–π–A motif is a viable means of producing thousands of dye molecules from combinations of dozens of arbitrarily selected parts. While some of the combinations successfully combine, the work still has produced 7906 dyes out of 8398 possible combinations. Future work will continue to employ this approach now that the methodology has been established and will utilize a larger selection of molecular constituents for construction and analysis of a plethora of additional molecular dyes. On top of that, the structure of the code can be expanded to different types of dye sensitizers or redox shuttles and even into finding exotic types of catalysts. These will hopefully exhibit more desirable properties (i.e., higher scores).The combination of CAM-B3LYP and PBE0 into a LSF fit predicts relatively accurate excitation energies and has a common trend that CAM-B3LYP tends to overestimate excitation energies. PBE0 on the other hand underestimates excitation energies. The 25 selected benchmark dyes orbital energies illustrate that PBE0 agrees with experiment the best out of the three methods for computing orbital energies. Most notably, the implementation of the LSF to CAM-B3LYP and PBE0 forms an accurate predictor as to what the experimental λmax and LUMO energy could be for automated analysis of novel dyes.
A major limiting factor in current construction of DSCs comes in producing a promising molecular dye for inclusion in the device. This work shows that dye candidates can be harvested from combinatorial construction and empirically-corrected DFT analysis. The hope is that money and time can be saved from avoiding failed sensitizer experiments by focusing on select dyes that computational automation and subsequent quantum chemical investigation are able to generate.
WM3 (23ed_20b_1ea) is one of hundreds of novel molecules predicted (out of thousands analyzed) in this work to exhibit highly favorable properties for improving DSC devices. Overall, the experimental device data demonstrates that WM3 has excellent energetics that do not require high Li+ loadings, exhibits a panchromatic IPCE response, and possesses a ≈50 nm lower energy IPCE onset than record setting organic sensitizers like AP25. The more negative E(S+/S) of WM3, however, also requires a compatible redox shuttle with a more negative redox couple than what is currently available. Future studies should focus on the design of device architectures that feature NIR dyes with more negative ES+/S* and ES+/S similar to WM3 which are paired with new redox shuttles having more negative redox couples. Additionally, the λmax is near the Shockley–Queissar limit with its onset just into the NIR. These fortuitous properties are only discovered as a result of the immense, novel, and automated theoretical characterization performed in this work.
Case in point, of the 7906 candidates dyes produced in this work, seven have promising properties that are as good or better than the standard benchmark, AP25, and even better than the synthesized 23ed_20b_1ea (WM3) dye molecule. These include 22ed_16b_5ea, 10ed_16b_9ea, 23ed_9b_4ea, 23ed_20b_4ea, 22ed_16b_2ea, 6ed_8b_12ea, and 10ed_20b_12ea. The experimentally synthesized 23ed_20b_1ea molecule has a score of 142 and is lower than the AP25 score. However, the most promising property that differs from the highest scoring dye in 22ed_16b_5ea is that the anchor percentage is 10% indicating better charge transfer properties. These nine candidates and 23ed_20b_1ea have excellent LUMO energies. Furthermore, at least a dozen more candidates are computed in this work to have properties similar to 23ed_20b_1ea (WM3) leaving the door wide open to future synthetic targets that may yet provide even better dye properties. 2ed_4b_8ea could even increase efficiencies for high voltage dyes that absorb at shorter wavelengths opening options for higher profile further synthetic targets and energy regimes.
Data availability
The datasets supporting this article have been uploaded as part of the ESI.†Conflicts of interest
The authors do not have any conflict of interests.Acknowledgements
TJS would like to thank Chesney T. Nguyen of University of Mississippi and Marie E. Strauss of Biola University for assistance with writing. TJS would also like to acknowledge Gabedit, OBabel, ChemDraw, and Python for the open source software. TJS would like to thank the Mississippi Space Grant Consortium (MSSGC) for assistance with funding. The authors acknowledge funding from NSF Grant OIA-1757220 and the University of Mississippi. They would also like to acknowledge the Mississippi Center for Supercomputing Research for use of the computational facilities needed to perform this research. JHD thanks NSF for award 1954922. This material is based upon work supported by the National Science Foundation Graduate Research Fellowship Program awarded to WEM and by the Barry Goldwater Scholarship and Excellence in Education Foundation awarded to AMW. Any opinions, findings, and conclusions or recommendations expressed in this material are those of the author(s) and do not necessarily reflect the views of the National Science Foundation. The authors would also like to acknowledge Horiba Scientific for their assistance in collecting the emission data in this study.References
- W. Shockley and H. Queisser, Detailed Balance Limit of Efficiency of p–n Junction Solar Cells, J. Appl. Phys., 1961, 32, 510 CrossRef CAS.
- B. Hardin, H. Snaith and M. McGehee, The Reniassance of Dye-Sensitized Solar Cells, Nat. Photonics, 2012, 6, 162–169 CrossRef CAS.
- M. Green, E. Dunlop and J. Hohl-Ebinger, et al., Solar Cell Efficiency Tables (Version 57), Prog. Photovoltaics, 2020, 29, 3 Search PubMed.
- K. Yoshikawa, H. Kawasaki and W. Yoshida, et al., Silicon Heterojunction Solar Cell with Interdigitated Back Contacts for a Photoconversion Efficiency Over 26%, Nat. Energy, 2017, 2, 17032 CrossRef CAS.
- B. Kayes, H. Nie, R. Twistet al., 27.6% Conversion Efficiency, a New Record for Single-Junction Solar Cells Under 1 Sun Illumniation, in 2011 37th IEEE Photovoltaic Specialists Conference, 2011. pp. 000004–8 Search PubMed.
- L. Zhang, X. Yang and W. Wang, et al., 13.6% Efficient Organic Dye-Sensitized Solar Cells by Minimizing Energy Losses of The Excited State, ACS Energy Lett., 2019, 4, 943–951 CrossRef CAS.
- K. Kakiage, Y. Aoyama and T. Yano, et al., Highly-efficient dye-sensitized solar cells with collaborative sensitization by silyl-anchor and carboxy-anchor dyes, Chem. Commun., 2015, 51, 15894–15897 RSC.
- D. Zhang, M. Stojanovic and Y. Ren, et al., A molecular photosensitizer achieves a Voc of 1.24 V enabling highly efficient and stable dye-sensitized solar cells with copper(II/I)-based electrolyte, Nat. Commun., 2021, 12, 1777 CrossRef CAS PubMed.
- J. M. Ji, H. Zhou and Y. K. Eom, et al., 14.2% Efficiency Dye-Sensitized Solar Cells by Co-sensitizing Novel Thieno[3,2-b]indole-Based Organic Dyes with a Promising Porphyrin Sensitizer, Adv. Energy Mater., 2020, 10, 2000124 CrossRef CAS.
- H. Snaith, Estimating the Maximum Attainable Efficiency in Dye-Sensitized Solar Cells, Adv. Funct. Mater., 2009, 20, 13 CrossRef.
- L. Peter, Characterization and Modeling of Dye-Sensitized Solar Cells, J. Phys. Chem., 2006, 111, 6601 Search PubMed.
- L. Peter, The Gratzel Cell: Where Next?, J. Phys. Chem. Lett., 2011, 15, 1861–1867 CrossRef.
- S. Ardo and G. Meyer, Photodriven Heterogeneous Charge Transfer with Transition-Metal Compounds Anchored to TiO2 Semiconductor Surfaces, Chem. Soc. Rev., 2008, 38, 115–164 RSC.
- M. Gratzel, Photoelectrochemical Cells, Nature, 2001, 414, 338–344 CrossRef CAS PubMed.
- A. Hagfeldt and M. Gratzel, Molecular Photovoltaics, Acc. Chem. Res., 2000, 5, 269–277 CrossRef PubMed.
- A. Hagfeldt, G. Boschloo and L. Sun, et al., Dye-Sensitized Solar Cells, Chem. Rev., 2010, 110, 6595–6663 CrossRef CAS PubMed.
- Y. Li, X. Li and Y. Xu, Theoretical Screening of High-Efficiency Sensitizers with D–π–A Framwork for DSSCs by Altering Promising Donor Groups, Sol. Energy, 2020, 196, 146–156 CrossRef CAS.
- J. M. Ji, H. Zhou and H. K. Kim, Rational Design criteria for D–π–A Structured Organic and porphyrin sensitizers for highly efficient dye-sensitized solar cells, J. Mater. Chem. A, 2018, 6, 14518–14545 RSC.
- A. Slimi, M. Hachi and A. Fitri, et al., Effects of Electron Acceptors Groups on Triphenylamine-Based Dyes for Dye-Sensitized Solar Cells: Theoretical Investigation, J. Photochem. Photobiol., A, 2020, 398, 112572 CrossRef CAS.
- F. Pakravesh, M. Izadyar and F. Arkan, Effect of Electron Donor and Acceptor on the Photovoltaic Properties of Organic Dyes for Efficient Dye-Sensitized Solar Sells, Phys. B, 2021, 609, 412815 CrossRef CAS.
- K. Sharma, V. Sharma and S. Sharma, Dye-Sensitized Solar Cells: Fundamentals and Current Status, Nanoscale Res. Lett., 2018, 13, 381 CrossRef PubMed.
- R. Liu, X. Li and K. Lam, Combinatorial Chemistry in Drug Discovery, Curr. Opin. Chem. Biol., 2017, 38, 117–126 CrossRef CAS PubMed.
- S. Fuse, S. Sugiyama and M. M. Maitani, et al., Elucidating the Structure-Property Relationships of Donor-π-Acceptor Dyes for Dye-Sensitized Solar Cells (DSSCs) through Rapid Library Synthesis by a One-Pot Procedure, Chem. – Eur. J., 2014, 20, 10685–10694 CrossRef CAS PubMed.
- K. Matsumura, S. Yoshizaki and M. M. Maitani, et al., Rapid Synthesis of Thiophene-Based, Organic Dyes for Dye-Sensitized Solar Cells (DSSCs) by a One-Pot, Four-Component Coupling Approach, Chemistry, 2015, 27, 9742–9747 CrossRef PubMed.
- Y. Ciou, P. Lin and W. Li, et al., Cross-Dehydrogenative Coupling (CDC) as Key-Transformations to Various D-π-A Organic Dyes: C-H/C-H Synthetic Stud Directed toward Dye-Sensitized Solar Cells Applications, J. Org. Chem., 2017, 82, 3538–3551 CrossRef CAS PubMed.
- V. Venkatraman, R. Raju and S. Oikonomopoulos, et al., The Dye-Sensitized Solar Cell Database, J. Cheminf., 2018, 10, 18 Search PubMed.
- M. Janjua, M. Usman Khan and M. Khalid, et al., Theoretical and Conceptual Framework to Design Efficient Dye-Sensitized Solar Cells (DSSCs): Molecular Engineering by DFT Method, J. Cluster Sci., 2021, 32, 243–253 CrossRef CAS.
- C. Christopher, B. Edward, V. Alvaro, S. Liliana, S. Gavin, N. Daniel, V. Julian, T. Tina, J. Jingwen, B. Govardhana Babu, C. Song, A. Lucia Gallego, O. Santiago Franco, C. Antonio, T. Justin, X. Song, Z. Xunjin and C. Jacqueline, Design-to-Device Approach Affords Panchromatic Co-Sensitized Solar Cells, Adv. Energy Mater., 2018, 9, 5 Search PubMed.
- E. J. Beard and J. M. Cole, Perovskite- and Dye-Sensitized Solar-Cell Device Databases Auto-generated Using ChemDataExtractor, Sci. Data, 2022, 9, 329 CrossRef CAS PubMed.
- N. Martsinovich and A. Troisi, Theoretical Studies of Dye Sensitized Solar Cells: from Electronic Structure to Elementary Processes, Energy Environ. Sci., 2011, 4, 4473 RSC.
- E. Runge and E. Gross, Density-Functional Theory for Time-Dependent Systems, Phys. Rev. Lett., 1984, 52, 997 CrossRef CAS.
- W. Zhang, L. Wang and L. Mao, et al., Computational Protocol for Precise Prediction of Dye-Sensitized Solar Cell Performance, J. Phys. Chem. C, 2020, 124, 3980–3987 CrossRef CAS.
- D. Jacquemin, E. Perpete and G. Scuseria, et al., TD-DFT Performance for The Visble Absorption Spectra of Organic Dyes: Conventional Versus Long-Range Hybrids, J. Chem. Theory Comput., 2008, 4, 123–135 CrossRef CAS PubMed.
- D. Jacquemin, V. Wathelet and E. Perpete, et al., Extensive TD-DFT Benchmark: Singlet-Excited States of Organic Molecules, J. Chem. Theory Comput., 2009, 5, 2420–2435 CrossRef CAS PubMed.
- M. Pastore, E. Mosconi and F. Angelis, et al., A Computational Investigation of Organic Dyes for Dye-Sensitized Solar Cells: Benchmark, Strategies, and Open Issues, J. Phys. Chem. C, 2010, 114, 7205–7212 CrossRef CAS.
- D. Casanova, F. P. Rotzinger and M. Gratzel, Computational Study of Promising Organic Dyes for High-Performance Sensitized Solar Cells, J. Chem. Theory Comput., 2010, 6, 1219–1227 CrossRef CAS.
- J. Nelson, Continuous-Time Random-Walk Model of Electron Transport in Nanocystalline TiO2 Electrodes, Phys. Rev. B: Condens. Matter Mater. Phys., 1999, 59, 15374 CrossRef CAS.
- J. Nelson, Diffusion-Limited Recombination in Polymer-Fullerene Blends and It's Influence on Photocurrent Collections, Phys. Rev. B: Condens. Matter Mater. Phys., 2003, 67, 155209 CrossRef.
- M. Nazeeruddin, F. Angelis and S. Fantacci, et al., Combined Experimental and DFT-TDDFT Computational Study of Photoelectrochemical Cell Ruthenium Sensitizers, J. Am. Chem. Soc., 2005, 127, 16835–16847 CrossRef CAS PubMed.
- A. Peddapuram, H. Cheema and R. Adams, et al., A Stable Panchromatic Green Dual Acceptor and Dual Donor Organic Dye for Dye-Sensitized Solar Cells, J. Phys. Chem. C, 2017, 121, 8770–8780 CrossRef CAS.
- R. Rodrigues, A. Peddapuram and A. Dorris, et al., Thienopyrroledione-Based Photosensitizers as Strong Photoinduced Oxidants: Oxidation of Fe(bpy)32+ in a > 1.3 V Dye-Sensitized Solar Cell, ACS Appl. Energy Mater., 2019, 2, 5547–5556 CrossRef CAS.
- H. Cheema, J. Watson and A. Peddapuram, et al., A 25 mA cm2, Dye Sensitized Solar Cell Based on a Near-Infrared-Absorbing Organic Dye and Application of the Device in SSM-DSCs, Chem. Commun., 2020, 56, 1741–1744 RSC.
- S. Haid, M. Marszalek and A. Mishra, et al., Significant Improvement of Dye-Sensitized Solar Cell Performance by Small Structural Modification in π-Conjugated Donor-Acceptor Dyes, Adv. Funct. Mater., 2012, 22, 1291–1302 CrossRef CAS.
- Y. Zhang, H. Cheema and L. McNamara, et al., Ullazine Donor-π bridge-Acceptor Organic Dyes for Dye-Sensitized Solar Cells, Chem. - Eur. J., 2018, 24, 5939–5949 CrossRef CAS PubMed.
- M. Zhang, Y. Wang and M. Xu, et al., Design of High-Efficiency Organic Dyes for Titania Solar Cells Based on the Chromophoric Core of Cyclopentadithiophene-Benzothiadiazole, Energy Environ. Sci., 2013, 6, 2944 RSC.
- Z. Yao, H. Wu and Y. Ren, et al., A Structurally Simple Perylene Dye with Ethynylbenzothiadiazole-Benzoic Acid as the Electron Acceptor Achieves an Over 10% Power Conversion Efficiency, Energy Environ. Sci., 2015, 8, 1438–1442 RSC.
- X. Yu, Y. Wang and T. Huang, et al., Performance Improvement of Dye-Sensitized Solar Cell by Phenanthrothiadiazole Unit-Based π-Conjugated Bridge, J. Mater. Sci., 2018, 6, 25–34 CAS.
- S. Feldt, E. Gibson and E. Gabrielsson, et al., Design of Organic Dyes and Cobalt Polypridine Redox Mediators for High-Efficiency Dye-Sensitized Solar Cells, J. Am. Chem. Soc., 2010, 132, 16714–16724 CrossRef CAS PubMed.
- Z. S. Huang, X. F. Zang and T. Hua, et al., 2,3-Dipentyldithieno[3,2-f.2’,3’-h]quinoxaline-Based Organic Dyes for Efficient Dye-Sensitized Solar Cells: Effect of π-Bridges and Electron Donors on Solar Cell Performance, ACS Appl. Mater. Interfaces, 2015, 36, 20418–20429 CrossRef PubMed.
- X. Lu, G. Zhou and H. Wang, et al., Near Infrared Thieno[3,4-b]pyrazine Sensitizers for Efficient Quasi-Solid-State Dye-Sensitized Solar Cells, Phys. Chem. Chem. Phys., 2012, 14, 4802–4809 RSC.
- Q. Feng, X. Jia and G. Zhou, et al., Embedding an Electron Donor or Acceptor Into Naphtho[2,1-b:3,4-b’]dithiophene Based Organic Sensitizers for Dye-Sensitized Solar Cells, Chem. Commun., 2013, 49, 7445–7447 RSC.
- D. Lee, M. Lee and H. Song, et al., Organic Dyes Incorporating Low-Band-Gap Chromophores Based on π-Extended Benzothiadiazole for Dye Sensitized Solar Cells, Dyes Pigm., 2011, 91, 192–198 CrossRef CAS.
- K. Pei, Y. Wu and A. Islan, et al., Constructing High-Efficiency D-A-π-A Featured Solar Cell Sensitizers: A Promising Building Block of 2,3-Diphenylquinoxaline for Antiaggregation and Photostability, ACS Appl. Mater. Interfaces, 2013, 5, 4986–4995 CrossRef CAS PubMed.
- K. Pei, Y. Wu and A. Islam, et al., Dye-Sensitized Solar Cells Based on Quinoxaline Dyes: Effect of π- Linker on Absorption, Energy Levels, and Photovoltaic Performances, J. Phys. Chem. C, 2014, 118, 16552–16561 CrossRef CAS.
- K. Pei, Y. Wu and H. Li, et al., Cosensitization of D-A-π-A Quinoxaline Organic Dye: Efficiently Filling the Absorption Valley with High Photovoltaic Efficiency, ACS Appl. Mater. Interfaces, 2015, 7, 5296–5304 CrossRef CAS PubMed.
- J. Watson, T. Santaloci and H. Cheema, et al., Fully Visible Spectrum Panchromatic Triple Donor Dye for Dye-Sensitized Solar Cells, J. Phys. Chem. C, 2020, 46, 25211 CrossRef.
- D. Ndaleh, D. Nugegoda and J. Watson, et al., Donor Group Influence on Dye-Sensitized Solar Cell Device Performances: Balancing Dye Loading and Donor Size, Dyes Pigm., 2021, 187, 109074 CrossRef.
- N. Liyanage, A. Yella and M. K. Nazeeruddin, et al., Thieno[3,4-b] pyrazine as an Electron Deficient π-Bridge in D-A-π-A DSCs, ACS Appl. Mater. Interfaces, 2016, 8, 5376–5384 CrossRef CAS PubMed.
- N. Liyanage, H. Cheema and A. Baumann, et al., Effect of Donor Strength and Bulk on Thieno[3,4-b]-pyrazine-Based Panchromatic Dyes in Dye-Sensitized Solar Cells, ChemSusChem, 2017, 10, 2635–2641 CrossRef CAS PubMed.
- Y. Ren, D. Sun and Y. Cao, et al., A Stable Blue Photosensitizer for Color Palette of Dye-Sensitized Solar Cells Reaching 12.6% Efficiency, J. Am. Chem. Soc., 2018, 140, 2405–2408 CrossRef CAS PubMed.
- R. Rodrigues, H. Cheema and J. Delcamp, A High-Voltage Molecular-Engineered Organic Sensitizer-Iron Redox Shuttle Pair: 1.4 V DSSC and 3.3 V SSM-DSSC Devices, Angew. Chem., Int. Ed., 2018, 57, 5472–5476 CrossRef CAS PubMed.
- J. S. Kim, B. M. Kim and U. Y. Kim, et al., Molecular Engineering for Enhanced Charge Transfer in Thin-Film Photoanode, ACS Appl. Mater. Interfaces, 2017, 40, 34812–34820 CrossRef PubMed.
- Z. Shen, J. Chen and X. Li, et al., Synthesis and Photovoltaic Properties of Powerful Electron-Donating Indeno[1,2-b]thiophene-Based Green D-A-π-A Sensitizers for Dye-Sensitized Solar Cells, ACS Sustainable Chem. Eng., 2016, 4, 3518–3525 CrossRef CAS.
- Y. K. Eom, I. T. Choi and S. H. Kang, et al., Thieno[3,2-b][1]benzothiophene Derivative as a New π-Bridge Unit in D-π-A Structural Organic Sensitizers with Over 10.47% Efficient for Dye-Sensitized Solar Cells, Adv. Energy Mater., 2015, 5, 1500300 CrossRef.
- Y. K. Eom, S. H. Kang and I. T. Choi, et al., Significant Light Absorption Enhancement by a Single Heterocyclic Unit Change in the π-Bridge Moiety from Thieno[3,2-b]benzothiophene to Thieno[3,2-b]indole for High Performance Dye-Sensitized and Tandem Solar Cells, J. Mater. Chem. A, 2017, 5, 2297–2308 RSC.
- H. Tian, X. Yang and R. Chen, et al., A Metal-Free ”Black Dye” for Panchromatic Dye-Sensitized Solar Cells, Energy Environ. Sci., 2009, 2, 674 RSC.
- T. Kono, T. N. Murakami and J. ichi Nishida, et al., Synthesis and Photo-Electrochemical Properties of Novel Thienopyrazine and Quinoxaline Derivatives, and Their Dye-Sensitized Solar Cell Performance, Org. Electron., 2012, 13, 3097–3101 CrossRef CAS.
- N. Zhou, K. Prabakaran and B. Lee, et al., Metal-Free Tetrathienoacene Sensitizers for High-Performance Dye-Sensitized Solar Cells, J. Am. Chem. Soc., 2015, 137, 4414–4423 CrossRef CAS PubMed.
- J. Qi, C. Sun and A. Zebibula, et al., Real-Time and High-Resolution Bioimaging with Bright Aggregation-Induced Emission Dots in Short-Wave Infrared Region, Adv. Mater., 2018, 30, 1706856 CrossRef PubMed.
- Y. Ezhumalai, B. Lee and M. S. Fan, et al., Metal-Free Branched Alkyl Tetrathienoacene (TTAR)-Based Sensitizers for High-Performance Dye-Sensitized Solar Cells, J. Mater. Chem. A, 2017, 5, 12310–12321 RSC.
- Y. Wu, W. Li and Z. S. Wang, et al., Hexylthiophene-Featured D-A-pi-A Structural Indoline Chromophores for Coadsorbent-Free and Panchromatic Dye-Sensitized Solar Cells, Adv. Energy Mater., 2012, 2, 149–156 CrossRef CAS.
- Y. Xie, W. Wu and H. Zhu, et al., Unprecedentedly Targeted Customization of Molecular Energy Levels with Auxiliary-Groups in Organic Solar Cell Sensitizers, Chem. Sci., 2016, 7, 544–549 RSC.
- X. Zhang, Y. Xu and F. Giordano, et al., Molecular Engineering of Potent Sensitizers for Very Efficient Light Harvesting in Thin-Film, J. Am. Chem. Soc., 2016, 138, 10742 CrossRef CAS PubMed.
- M. Theis, A. Candian and A. Tielens, et al., Electronically Excited States of Anisotropically Extended Singly-Deprotonated PAH Anions, J. Phys. Chem. A, 2015, 119(52), 13048–13054 CrossRef CAS PubMed.
- M. Theis, A. Candian and A. Tielens, et al., Electronically Excited States of PANH anions, Phys. Chem. Chem. Phys., 2015, 17, 14761 RSC.
- R. Fortenberry, M. Moore and T. Lee, Excited State Trends in Bidirectionally Expanded Closed-Shell PAH and PANH Anions, J. Phys. Chem. A, 2016, 120, 7327–7334 CrossRef CAS PubMed.
- N. Quynh, W. Peters and R. Fortenberry, Highly excited State Properties of Cumulenone Chlorides in the Vacuum-Ultraviolet, Phys. Chem. Chem. Phys., 2020, 22, 11838–11849 RSC.
- Q. Alkhatib, W. Helal and A. Marashdeh, Accurate predictions of the electronic excited states of BODIPY based dye sensitizers using spin-component-scaled double-hybrid functionals: a TD-DFT benchmark study, R. Soc. Chem., 2022, 12, 1704–1717 CAS.
- M. J. Frisch, G. W. Trucks, H. B. Schlegelet al.Gaussian 16 Revision C.01; 2016. Gaussian Inc.Wallingford CT Search PubMed.
- M. J. Frisch, G. W. Trucks, H. B. Schlegelet al.Gaussian 09 Revision D.01; 2009. Gaussian Inc.Wallingford CT Search PubMed.
- A. Becke, Density-Functional Thermochemistry. III. The Role of Exact Exchange, J. Chem. Phys., 1993, 98, 5648 CrossRef CAS.
- A. Becke, A New Mixing of Hartree–Fock and Local Density-Functional Theories, J. Chem. Phys., 1993, 98, 1372 CrossRef CAS.
- C. Adamo and V. Barone, Toward Reliable Density Functional Methods Without Adjustable Parameters: The PBE0 Model, J. Chem. Phys., 1999, 110, 6158 CrossRef CAS.
- S. Miertus, E. Scrocco and J. Tomasi, Electrostatic Interaction of a Solute with a Continuum. A Direct Utilization of AB Intio Molecular Potentials for the Prevision of Solvent Effects, Chem. Phys., 1981, 55, 117–129 CrossRef CAS.
- C. J. Cramer and D. G. Truhlar, Implicit Solvation Models: Equilibria, Structure, Spectra and Dynamics, Chem. Rev., 1999, 99, 2161–2200 CrossRef CAS PubMed.
- J. Tomasi, B. Mennucci and R. Cammi, Quantum Mechanical Continuum Solvation Models, Chem. Rev., 2005, 105, 2999–3094 CrossRef CAS PubMed.
- N. O’Boyle, M. Banck and C. James, et al., Open Babel: An Open Chemical Tool Box, J. Cheminf., 2011, 3, 33 Search PubMed.
- A. B. Munoz-Garcia, I. Benesperi and G. Boschloo, et al., Dye-sensitized solar cells strike back, Chem. Soc. Rev., 2021, 50, 12450–12550 RSC.
- H. Cheema, J. Watson and J. H. Delcamp, Photon management strategies in SSM-DSCs: Realization of a <11% PCE device with a 2.3V output, Sol. Energy, 2020, 208, 747–752 CrossRef CAS.
- H. Cheema and J. H. Delcamp, The Role of Antireflective Coating CYTOP and Immersion Oil and Sensitizer Selection in Fabricating a 2.3 V and 10% Power Conversion Efficiency SSM-DSC Device, Adv. Energy, 2019, 9, 1900162 CrossRef.
- A. Daniel and J. H. Delcamp, Development of Solar Cells, ed. JK Roy, Springer Internation Publishing, 2021 Search PubMed.
- J. Kwon, M. J. Im and C. U. Kim, et al., Two-terminal DSSC/silicon tandem solar cells exceeding 18% efficiency, Energy Environ. Sci., 2016, 9, 3657–3665 RSC.
- T. Kinoshita, K. Nonmura and N. J. Jeon, et al., Spectral splitting photovoltaics using perovskite and wideband dye-sensitized solar cells, Nat. Commun., 2015, 6, 8834 CrossRef CAS PubMed.
- C. H. Chen, C. H. Hsieh and M. Dubosc, et al., Synthesis and Characterization of Bridged Bithiophene-Based Conjugated Polymers for Photovoltaic Applications: Acceptor Strength and Ternary Blends, Macromolecules, 2009, 2, 697–708 Search PubMed.
- N. G. Connelly and W. E. Geiger, Chemical Redox Agents for Organomettalic Chemistry, Chem. Rev., 1996, 2, 877–910 CrossRef PubMed.
- Handbook of Physics and Chemistry, ed. R. Weast, CRC Press, 63rd edn, 1982 Search PubMed.
- G. Wu and S. Dai, Influence of different acceptor groups in julolidine-based organic dye-sensitized solar cells, Dyes Pigm., 2013, 99, 653–660 CrossRef CAS.
- E. A. Gibson, A. L. Smeigh and L. L. Pleux, et al., Cobalt Polypyridyl-Based Electrolytes for p-Type Dye-Sensitized Solar Cells, J. Phys. Chem., 2011, 19, 9772–9779 Search PubMed.
- G. Boschloo and A. Hagfeldt, Characteristic of the Iodide/Triioxide Redox Mediator in Dye-Sensitized Solar Cells, Acc. Chem. Res., 2009, 11, 1819–1826 CrossRef PubMed.
- A. Baumann, C. Curiac and J. H. Delcamp, The Hagfeldt Donor and Use of Next-Generation Bulky Donor Designs in Dye-Sensitized Solar Cells, ChemSusChem, 2020, 13, 2503–2512 CrossRef CAS PubMed.
- H. Cheema, R. Rodrigues and J. H. Delcamp, Sequential series multifunction dye-sensitized solar cells (SSM-DSCs): 4.7 volts from a single illuminated area, Energy Environ. Sci., 2017, 8, 1764 RSC.
Footnotes |
| † Electronic supplementary information (ESI) available: The Github link associated with this project: https://github.com/Awallace3/Dyes Tables S1–S4 are the benchmark dyes' absorption energies for the three methods and LSF method in all 4 environments alongside their experimental values. Fig. S2–S4 are the absorption energy plots for the PCM benchmark computations in DCM, THF, and DMF. Fig. S5 is the histogram that illustrates the various π bridges in each theoretical dye with a LSF excitation energy less than FNE32. Tables S6 and S7 show the full charge transfer properties, orbital energies, absorption wavelength, and derived scores for the three groups of theoretical dyes and shows a more detailed percentage of the contributions for each substructure. Lastly, a attached zip file has all of the 7906 theoretical dyes computationed energies and the molecules dyes SMILES string. The ESI begins on page S15. The section order is Section 1.1 is a general information section, Section 1.2 is a device fabrication section, Section 1.3 is a device measurements section, and Section 1.4 contains additional supplementary discussion about the device. For the ESI figures, Fig. S5 illustrates the structure and redox shuttle for DSC AP25. Fig. S6 is the CV for WM3 in DCM. Fig. S7 plots the current dynamics for WM3 with the I-RS electrolyte and cobalt electrolyte. Fig. S8 is the SMPVT plot, Fig. S9 is the Nyquist plot of the WM3, and Fig. S10 is the Bode plot of the WM3. Furthermore, the experimental section of the ESI contains reagent, molecule, and instrument information. See DOI: https://doi.org/10.1039/d3dd00023k |
| ‡ These authors contributed equally to this work. |
| This journal is © The Royal Society of Chemistry 2023 |

