 Open Access Article
Creative Commons Attribution 3.0 Unported Licence
MacroConf – dataset & workflows to assess cyclic peptide solution structures†
Daniel
Crusius
 a,
Jason R.
Schnell
 a,
Flaviu
Cipcigan
b and
Philip C.
Biggin
 *a
*a
aDepartment of Biochemistry, University of Oxford, South Parks Road, Oxford OX1 3QU, UK. E-mail: philip.biggin@bioch.ox.ac.uk
bIBM Research Europe, The Hartree Centre STFC Laboratory, Sci-Tech Daresbury, Warrington WA4 4AD, UK
First published on 4th July 2023
Abstract
Knowing solution structures of cyclic peptides is essential for predicting pharmacokinetic properties for drug discovery. Here, we report the MacroConf dataset along with computational workflows to evaluate how well experimental cyclic peptide solution structures are reproduced by current in silico methods. The dataset was compiled from the literature and contains 68 cyclic peptides and macrocycles with existing solution NMR data. We provide a reproducible and automated computational workflow to quickly compare different cyclic peptide (CP) conformer generators with one another and to NMR derived nuclear overhauser effect (NOE) distance constraints. When analysing the CP subset of compounds, we found that enhanced sampling molecular dynamics (MD) methods, such as Gaussian accelerated MD, reproduced experimental NOEs well. Conventional MD suffered from a lack of sampling especially for compounds with proline isomerisation and did not always match with the reference data. When considering all compounds studied here, conventional and Gaussian accelerated MD were statistically indistinguishable when considering the % of NOE distance restraints satisfied. Cheminformatics based conformer generators such as OMEGA and RDKit ETKDG often generated diverse and plausible structures that matched the sampling observed in MD-based methods, but do not yield relative populations or thermodynamic insights. Bundles of conformers produced via cheminformatics methods reproduced experimental NOE values to similar levels as the MD based methods, with high-quality structures contained in the cheminformatics outputs. The presented computational workflow can be easily extended to include new compounds or different simulation methods. We envisage that this work will serve as a benchmark to help improve cyclic peptide conformer generators and standardize their assessment.
Introduction
An estimated 80% of human proteins cannot be drugged with current small molecule drugs.2 Therefore, great effort is put into developing new modalities to expand the druggable biological space. New modalities include any molecule not classified as a small molecule drug.3 While these modalities make more protein targets accessible, they often suffer from suboptimal and less well-understood pharmacokinetic properties than traditional small molecule drugs.4Cyclic peptides (CPs) are one such proposed new modality, which are shown to bind protein surfaces and can mimic protein loops to imitate protein–protein interactions (PPIs).5 These molecules are just small enough to be cell permeable in addition to being stable and long-lived enough to reach targets in high concentration.6 Over 40 orally available CPs are on the market and in phase III studies,7 but many CP drug candidates have problematic pharmacokinetic properties, especially cell permeability.8 This is because classic rules to predict ADME properties for small molecules usually do not apply to CPs.4 The cyclic constraint, responsible for conformational preorganization, higher binding affinities, and increased proteolytic resistance makes it challenging to predict the 3D structure of CPs with conventional conformer generators.9 Specialised conformer generators exist nowadays,10–12 but fast prediction of dynamic properties is an unsolved problem.13 The reason for this is that macrocycles exist as ensembles of several low energy conformations in solution, with the bioactive one sometimes only present at levels as low as 4% of the population.14 Predicting which of the possible conformations are biologically relevant is hard, and may also depend on the environment.15,16 Determining the relevant conformers in solution and their 3D structure is crucial for predictions of pharmacokinetic properties.17,18
Cheminformatics conformer generators for cyclic peptides
In the last 15 years or so, specialised conformer generators have been developed to reproduce X-ray crystal structures of CPs, since classic conformer generators do not perform particularly well.19,20 A range of commercial and open-source methods (OMEGA,10 RDKit,12 BRIKARD,21 MacroModel and Prime11,20etc.19,22–25) now exist, and a detailed comparison of their ability to reproduce X-ray crystal structures has been reported.10 Computational methods tend to work well for finding solid state structures or enumerating structures for docking studies.26,27 However, predicting dynamics-based properties (solubility, cell permeability, etc.) remains an open challenge, as demonstrated by the poor performance of solubility predictions of cyclosporine A in the recent SAMPL challenge.28Molecular dynamics conformer generators for cyclic peptides
To produce conformers with associated information about dynamics, thermodynamics, or explicit solvent interactions, one can use molecular dynamics (MD) simulations or similar methods to generate conformers.27 While the cyclisation of peptides is beneficial for increasing binding affinities,29,30 it makes predicting solution structures more difficult. Macrocyclic systems tend to adopt several distinct conformations separated by high energy barriers.31 Depending on the system and type of conformational reorganization, energy barriers can be as high as 16–22 kcal mol−1 for cis–trans isomerization of amide bonds.32 Achieving adequate sampling for such systems in MD simulations is challenging. The initial conditions determine which parts of the potential energy surface can be explored during a simulation. Systems can easily get stuck in a minimum of the potential energy surface (PES) in the given simulation time.33 Enhanced sampling MD methods address this problem and allow increased sampling of the PES despite high energy barriers with comparable computational resources to conventional MD (cMD) simulations.34 It was reported that short CPs switch conformations via concerted movement of two dihedral backbone angles. This observation enables the use of BE-META or related simulation methods to model CPs.35 For a generally applicable conformer generator beyond natural CPs of sizes 6–8, we cannot assume prior knowledge of the system's collective variables and therefore unconstrained enhanced sampling methods without specification of reaction coordinates are preferable.Accelerated MD (aMD), and Gaussian accelerated MD (GaMD) are two closely related, enhanced sampling methods that do not require specification of reaction coordinates.36,37 They both effectively flatten the potential energy surface by adding a boosting potential to reduce energetic barriers.37 Through this, much faster sampling compared to cMD simulations can be achieved.36 Enhanced sampling comes with the caveat of having to reweigh the resulting trajectory to reproduce physically correct quantities. Kamenik et al. demonstrated recently that aMD is suitable to reproduce experimentally measured nuclear overhauser effects (NOEs) and X-ray structures of three CPs/macrocycles.38 An advantage of this method is that after reweighting the original thermodynamic information the original PES is retained.33 Alternative methods to study cyclic peptides in solution include replica-exchange MD (REMD39), complementary-coordinates MD (CoCo-MD40), multicanonical MD (McMD41), among others.27
Comparing the performance of different conformer generators
Many macrocyclic X-ray crystallographic structures are available in public databases suitable for conformer generator benchmarks. Several compiled datasets of macrocycles are available, including the Sindhikara set consisting of 208 solid state conformations of macrocycles.11 The most used metric for comparing conformer generators to experimental structures is the root mean square deviation (RMSD) of atomic positions. Other less commonly used metrics include 3D shape comparison,10 bounded atom-centric measures,42 and measures of torsion angle deviation.43While X-ray crystallographic structures make conformer generator benchmarks straightforward, we need to also consider benchmarking conformer generators on solution structures. This is important if conformer generators form the basis for predictions of pharmacokinetic properties, which are determined by accessible conformers in solution.44 Solution state structures of macrocycles are more challenging to find since many solution structures are not deposited in a central database, even though such databases exist.45
Experimental solution structural data for CPs often comes from NMR studies but the structural information is semi-quantitative and structures are often underdetermined. To obtain solution structures by NMR a range of different NMR observables can be measured. Among the most commonly used experimental variables are 3J coupling constants to determine torsion angles via the Karplus equation46 and NOE intensities47 that arise due to through-space dipolar couplings and depend on internuclear distance. Additional information on intramolecular H bond information can be obtained by variable temperature experiments.5
Multiple conformers exchanging slower than the NMR timescale can be detected by the presence of multiple signals in the affected regions or by peak broadening.5,48 However, the presence of multiple conformers are missed if conformer exchange rates are faster than the NMR timescale (∼1 ms), which results in signal averaging.27 In the case of NOEs, fast conformer exchange will result in a set of intensities (and therefore the calculated internuclear distances) that arise from a time average of the conformers.5,33,39
By itself or combined with torsion angles, NOE distance constraints often form the basis for direct comparison with computational predictions of solution ensembles. By computing these quantities for computational ensembles, it is possible to directly compare how well the computational predictions match experimental evidence. Alternatively, further computational refinement can be done to generate a structural ensemble of CP solution structures that best matches the experimental evidence: the NAMFIS (NMR analysis of molecular flexibility in solution) method deconvolutes the NMR signal into distinct conformer contributions, such that the same metrics used for the solid state comparison can be applied (e.g. RMSD of backbone atoms).14,17,49
Because of variable experimental conditions, reporting formats, and the significant effort involved in using previously published NOE data, there is currently no dataset available for macrocyclic peptide solution structures. Cyclic peptide conformer generators are usually benchmarked by only considering solution structures of a few compounds. In this study, we systematically compared (G)aMD simulations with different cheminformatics-based conformer generators to assess how well they reproduce solution structures. As a basis for this, we assembled a dataset of macrocycle solution structures termed MacroConf. Further, we developed computational workflows to automatically setup, run, and analyse MD simulations and cheminformatics conformer generators. In the following sections, we present the assembly of the MacroConf dataset of CP solution structures and the design of the computational workflows to automatically run and compare MD based conformer generators with the cheminformatics-based tools OMEGA macrocycle and RDKit ETKDG. Then, we directly compare the ability of the cheminformatics conformer generators and MD methods to reproduce solution structures of cyclic peptides.
Methods
Overview
In this study, we use a variety of different cyclic peptide conformer generators and compute NOE distance constraints to compare to experimental reference data. Processing of the experimental reference data and the assembly of the MacroConf dataset are described in the section dataset generation. The conformer generators were run as part of an automated computational framework to increase reproducibility and reusability. The details about creating this computational workflow are in the section workflow generation. We distinguish two classes of conformer generators; details can be found in the sections: MD based conformer generators and cheminformatics conformer generators. Finally, we describe how the NOE distance constraints were computed in the section NOE distance constraints for cyclic peptide structure determination.Dataset generation
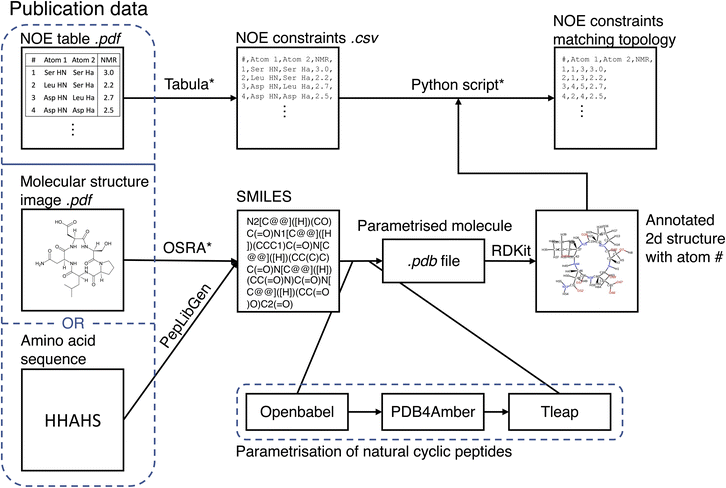
The MacroConf dataset was compiled manually from available literature, which was found via keyword searches of PubMed and Google Scholar and by following references of key publications. We included cyclic peptides and chemically modified derivative molecules (macrocycles that resemble CPs) if experimental NOE values from NOESY, ROESY or comparable experiments were available. Unfortunately, there is no standardised format to report NOE values across the literature. We therefore developed a semi-automatic system to extract SMILES strings and NOE data from the PDF-files of papers and convert them into a table of NOE values with matching topology files. The system to achieve a topology and matching NOE table is shown in Fig. 1.This process results in a computer readable NOE representation that matches the generated molecular topology of the macrocycles.
For natural cyclic peptides, the SMILES string was derived from the amino acid sequence via the python toolkit Peplibgen.50 For macrocyclic compounds, the OSRA software51 was used to extract the molecular structure from images found in corresponding publications. Any errors and inaccuracies of the OSRA software were corrected manually. The resulting SMILES strings were then used to build a molecular topology via a multi-step process: for natural cyclic peptides (only L amino acids), the SMILES strings were converted into a 3D PDB file via OpenBabel52 (which adds appropriate atom types). Then, the pdb files were “cleaned” with pdb4amber and parametrised with tleap. Using tleap we produced a range of different output file formats (amber topology file, pdb file, …). These steps are only valid for natural cyclic peptides and may need slight alterations for macrocycles depending on forcefield used. For L/D-amino acid cyclic peptides, initial structure generation failed with OpenBabel, and thus experimental structures were used as available to generate an MD topology. Protonation states were chosen according to the reference publications.
If not already available as a computer readable table, printed NOE tables in the publications were extracted from PDF files via tabula.53 A custom-made Python script queried the user to match all atom names provided in the paper with the atom numbers of the molecular topology. As part of this matching process, the molecular topology file was visualized as a 2D structure annotated with atom numbers via RDKit.54 This process results in a computer readable NOE representation that matches the molecular topology of the macrocycles. For a full specification of the dataset, see the ESI Text S1, Text S2† and https://github.com/bigginlab/macroconf.
Workflow generation
To generate the associated computational workflows to analyse the MacroConf dataset, Snakemake,55 a workflow management system that aims to produce sustainable data analyses56 was chosen. Snakemake is Python based, works in a range of computational environments, and ensures the MacroConf workflow is fully reproducible, scalable to different compute architectures, and easily extendable. Parts of the Snakemake workflow relied on the following software: Numpy,57 Pandas.58,59Molecular dynamics-based conformer generators
For the CPs studied in this work, we used unconstrained enhanced sampling methods. Kamenik et al. showed that aMD describes cyclic peptide solution structures well.33 Here, we applied two variants of accelerated MD: aMD36 and GaMD,34 which were both already used to describe cyclic peptides in solution.60 For comparison, we also performed unbiased conventional (cMD) simulations.All MD simulations were run in the Amber 18 software61 using the AMBER FF-14SB protein force-field62 for D and L-amino acid CPs. The simulations performed here could easily be extended to include modified, non-natural amino acids by using extended parameters such as Forcefield_NCAA63 or a more general all atom forcefield (GAFF or others).39
When building the cyclic peptide topologies in Amber, a bond between the ring closing amino acids had to be included during the topology building process, for details see ESI Text S3.† For water, the TIP3P model was used.64 For simulations in DMSO, the GAFF forcefield was used to describe the solvent.65 RESP charge parameters for DMSO were taken from literature.66 For comparison, the BCC charge derivation method was also used.67 To simulate chloroform, we used the Amber18 chloroform model.68 All solvent boxes were octahedral, with a distance of at least 12 Å from the molecule to any box edge. An appropriate number of sodium/chloride ions were added if required to neutralize the systems.
After topology parametrisation and solvation, a cascade of different energy minimization and equilibration steps were performed: (1) energy minimisation of the solvent with up to 15![[thin space (1/6-em)]](https://www.rsc.org/images/entities/char_2009.gif) 000 steps of steepest decent and 5000 steps of conjugate gradient if not converged previously; (2) relaxation of the solvent via 20 ps of NVT simulation increasing the temperature from 200 K to 300 K with all other atoms fixed; (3) minimisation of the full system as in (1); (4) heating of the system to 300 K via 500 ps of NVT simulation, restraining all heavy atoms not including the solvent; (5) equilibrating the solvent via 500 ps of NPT simulation, restraining all heavy atoms not including the solvent; (6) equilibration of the full system via 5 ns of NPT simulation without restraints.69 Production runs in (G)aMD or cMD were performed in the NPT ensemble. Before the (G)aMD simulations, an additional equilibration step was performed to determine the boosting parameters. All production simulations were, if not indicated otherwise, run for 2000 ns. For a detailed analysis of the convergence of simulations, see the ESI, Fig. S5–S11 and ESI Text S5.† Further simulation details, parameters and complete input files are provided as part of the computational workflow at https://github.com/bigginlab/macroconf. The analysis of simulations is handled automatically by the created Snakemake workflow. Analysis of MD trajectories is based on the mdtraj library.70 Dimensionality reduction and clustering are done using principal component analysis (PCA), t-SNE, DBSCAN; reweighting of GaMD is performed via a modified version of PyReweighting by Miao et al. Statistical metrics are computed using scipy71 and scikit-learn.72 Visualization of 2d structures is accomplished by using RDKit,54 3d structures and trajectories are visualized via nglview73 and PyMOL.74
000 steps of steepest decent and 5000 steps of conjugate gradient if not converged previously; (2) relaxation of the solvent via 20 ps of NVT simulation increasing the temperature from 200 K to 300 K with all other atoms fixed; (3) minimisation of the full system as in (1); (4) heating of the system to 300 K via 500 ps of NVT simulation, restraining all heavy atoms not including the solvent; (5) equilibrating the solvent via 500 ps of NPT simulation, restraining all heavy atoms not including the solvent; (6) equilibration of the full system via 5 ns of NPT simulation without restraints.69 Production runs in (G)aMD or cMD were performed in the NPT ensemble. Before the (G)aMD simulations, an additional equilibration step was performed to determine the boosting parameters. All production simulations were, if not indicated otherwise, run for 2000 ns. For a detailed analysis of the convergence of simulations, see the ESI, Fig. S5–S11 and ESI Text S5.† Further simulation details, parameters and complete input files are provided as part of the computational workflow at https://github.com/bigginlab/macroconf. The analysis of simulations is handled automatically by the created Snakemake workflow. Analysis of MD trajectories is based on the mdtraj library.70 Dimensionality reduction and clustering are done using principal component analysis (PCA), t-SNE, DBSCAN; reweighting of GaMD is performed via a modified version of PyReweighting by Miao et al. Statistical metrics are computed using scipy71 and scikit-learn.72 Visualization of 2d structures is accomplished by using RDKit,54 3d structures and trajectories are visualized via nglview73 and PyMOL.74
Cheminformatics conformer generators
SMILES strings were used as inputs to the RDKit12 and OMEGA10 conformer generators to remove any kind of previous structural information.10 SMILES strings were produced from the parametrised MD topology to closely match the MD reference structure for later comparison. The resulting conformer generator outputs were renumbered if necessary to match the MD reference and in some cases hydrogen atoms were added or removed to exactly match the MD topology. The parameters for both RDKit ETKDGv3 and OMEGA macrocycle were closely matched to those of Hawkins et al.,10 the exact parameters and input files are provided (https://github.com/bigginlab/macroconf).NOE distance constraints for cyclic peptide structure determination
NOE distance constraints are NMR derived distance constraints commonly used in solution structure determination of biomolecules.75 The NOE signal typically follows a r−6 distance dependence, but dependent on the internal mobility compared with the overall tumbling motion the signal can also exhibit an r−3 dependence.76 There are several different ways of computing and reporting NOE data in the literature, depending on the specific NMR experiment. Some reports include NOE distances, sometimes with upper and/or lower bounds of uncertainty. Other publications report distance bins (short, medium, long).Negative information from NOE experiments cannot reliably be used to infer structures. Certain NOE intensities can be weaker than the corresponding distance would indicate (or even zero) because of spin diffusion.76,77 Furthermore, spectral overlap, incomplete assignments, misassignments, and typos are all possible sources of error in NMR experiments.
Experiments with multiple mixing times allow for a quantitative analysis of distances.78 When compiling the MacroConf dataset, we assigned every data point an NMR experiment quality label of either high or low quality. High quality means the authors reported NMR experiments with multiple mixing times.
In some cases, experimentally observed NOE intensities cannot be assigned to a single H-atom pair. Instead, the NOE values are assigned ambiguously to multiple pairs of H-atoms. This can be for two reasons: first, the NOE signal could not be assigned unambiguously to a single H-atom pair because of chemical shift degeneracy. Second, multiple H-atoms can contribute to a single observed signal. For ambiguous NOE values, we separately computed all possible combinations of H-atoms as ambiguous NOE pairs. Instead of averaging the resulting ambiguous NOEs, we individually compared the ambiguous NOE values to the experimentally observed value. The reason is that we are uncertain about how the ambiguous experimental NOEs were derived for some of the reference NMR data. In cases where we averaged over the whole set of NOE values to report statistical metrics, we considered the best of the ambiguous values (smallest deviation from the experimental value) and discarded the rest. We also considered any stereospecific assignments of H-atoms as ambiguous, even if they were unambiguously assigned experimentally.
To compare MD simulation ensembles to experimentally reported NOEs, we need to average distances of the simulation trajectory in a comparable way to the experimental conditions. To compute a NOE distance from an unbiased MD simulation we locate and track the relevant H-atoms over the full MD trajectory. Given the distance between the H-atoms that correspond to a given NOE value is ri at frame i, the computed NOE distance over the whole MD trajectory dNOE, is then given as
 | (1) |
For (Gaussian) accelerated MD, we cannot use the r−6 averaging procedure because the trajectories are biased and thus unphysical.33 Therefore, we first reweighed the relevant distances for each NOE value via Maclaurin series expansion to the 10th order. We then applied a weighted r−6 average, with the weights derived from the resulting PMF distribution as Boltzmann factors.79
To compare simulated NOE values to experiment, we consider different statistical metrics. We compute the mean absolute error (MAE), mean squared error (MSE), root mean squared deviation and Kendall's tau between the set of computed and experimentally reported NOEs. These metrics are computed between the simulation average and the experimentally reported NOE distance. Further we compute the percentage of fulfilled NOEs of the simulations, termed % of NOE distance restraints satisfied. We consider a NOE violated if the simulated NOE value does not fall within the experimentally reported upper and lower limits, or in the case where no upper limited is reported, if the experimental value is exceeded by 20%. Errors of these metrics are computed via statistical bootstrapping.
To test for statistically significant performance differences between simulation methods, we used the paired Student's t-test and Wilcoxon signed-rank tests to consider differences in mean and mean signed rank, respectively. P-values were corrected by application of the method of Holm,80 to control the family-wise error rate (FWER), for details see ESI Text S8.†
Results
Dataset of cyclic peptides with solution structures
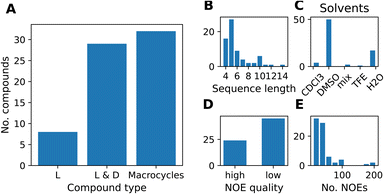
We compiled a dataset of cyclic peptides and macrocycles with available solution structures in the form of NOE distance constraints, which we named “MacroConf”. The MacroConf dataset is shown in Fig. S1† and contains 68 compounds; of which 36 (53%) compounds are cyclic peptides made up exclusively of D- and L-amino acids. The remaining 32 (47%) compounds are macrocycles and contain amino acids with various chemical modifications (see Fig. 2A).All 68 compounds have associated experimental NOE data of various quality. 24 compounds (35%) have what we term high-quality NOE data; NOE data that is based on NMR measurements (NOESY, ROESY) performed with multiple mixing times (Fig. 2D). Distributions of properties such as the sequence length, solvents, and the number of NOEs are shown in Fig. 2. The full dataset, including MD topology files for the cyclic peptides are available at https://github.com/bigginlab/macroconf. Detailed dataset specifications are described in ESI Text S2.†
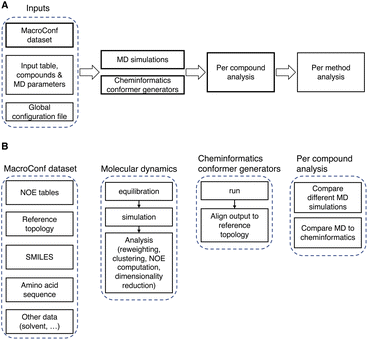 | ||
| Fig. 3 (A) Overview of the computational pipeline. (B) Details about key components of the workflow and dataset. | ||
To use the computational pipeline, we need to specify compounds, simulation methods, and parameters in a tabular input file. Every parameter set is then automatically labelled with a unique hash, which is derived from and identifies a specific set of parameters (see Fig. S2 and ESI Text S3† for more details). Based on these parameter sets, requested compounds are, if possible, automatically parametrised and then simulated in a cascade of different energy minimization-, equilibration-, simulation-, and analysis-steps.
The entire workflow and a more detailed description of the specific simulation and analysis parts are available at https://github.com/bigginlab/macroconf. If specified in a separate configuration file, multiple conformer generators of the same compound with different parameters and simulation methods can be compared with one another. The workflow produces both per-compound analysis results that show detailed simulation results for each compound, as well as analyses that compare different methods.
The analysis steps are done in Jupyter notebooks, such that after running the workflow, all steps can be inspected, if desired, in part also interactively.
![[thin space (1/6-em)]](https://www.rsc.org/images/entities/char_2009.gif) Fig. 4 shows results of a 2000 ns GaMD simulation of compound 22 in aqueous solution. The potential energy landscape based on a principal component analysis of the backbone dihedral angles (Fig. 4A) shows the presence of multiple conformers, with a global minimum at ∼(−0.4, −0.8). We also use different inputs for the PCA (cartesian coordinates, pairwise N–O distances, Cremer–Pople ring puckering parameters22), which are not shown here. Fig. 4A also shows structural clusters of the MD ensemble overlaid. The clusters are derived via DBSCAN clustering of a t-SNE reduced space of the dihedral angles (see Fig. S3, S4 and ESI Text S4†). The average cluster structures reproduce the potential energy minima well and serve as a validation for the reweighting procedure used for production of the PES. The reweighted shape potential energy landscape in Fig. 4B shows that the simulation explores a wide range of different shapes, while the most stable structures have a predominantly disk-like structure. Extreme shapes and the most populated MD cluster structures are shown in Fig. 4C. Fig. 4D shows the comparison of the computed NOE values for the MD ensemble with the experimental NOE values and bounds. Many values agree well with the experiment, but some deviate. However, when considering the experimental upper bounds (grey line), deviations are not much more than 1 Å for a few outliers. Fig. S12 and ESI Text S6† show the reweighted PMF plots that were used to compute the NOEs from the MD simulations.
Fig. 4 shows results of a 2000 ns GaMD simulation of compound 22 in aqueous solution. The potential energy landscape based on a principal component analysis of the backbone dihedral angles (Fig. 4A) shows the presence of multiple conformers, with a global minimum at ∼(−0.4, −0.8). We also use different inputs for the PCA (cartesian coordinates, pairwise N–O distances, Cremer–Pople ring puckering parameters22), which are not shown here. Fig. 4A also shows structural clusters of the MD ensemble overlaid. The clusters are derived via DBSCAN clustering of a t-SNE reduced space of the dihedral angles (see Fig. S3, S4 and ESI Text S4†). The average cluster structures reproduce the potential energy minima well and serve as a validation for the reweighting procedure used for production of the PES. The reweighted shape potential energy landscape in Fig. 4B shows that the simulation explores a wide range of different shapes, while the most stable structures have a predominantly disk-like structure. Extreme shapes and the most populated MD cluster structures are shown in Fig. 4C. Fig. 4D shows the comparison of the computed NOE values for the MD ensemble with the experimental NOE values and bounds. Many values agree well with the experiment, but some deviate. However, when considering the experimental upper bounds (grey line), deviations are not much more than 1 Å for a few outliers. Fig. S12 and ESI Text S6† show the reweighted PMF plots that were used to compute the NOEs from the MD simulations.
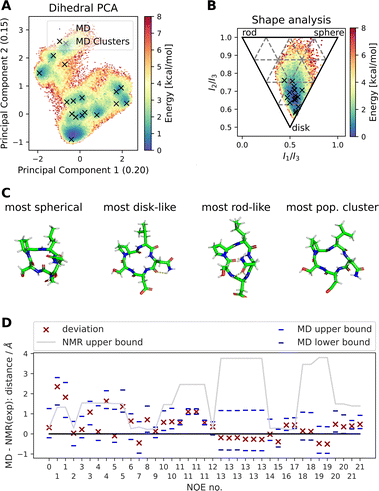 | ||
| Fig. 4 Summary of different analysis steps performed for a GaMD simulation (aqueous solution, 2000 ns simulation) of compound 22 with the sequence cyclo-(-Ser-Pro-Leu-Asn-Asp-), SPLND. (A) Potential energy landscape based on principal component analysis of the backbone dihedral angles of compound 22. Structural clusters (obtained via t-SNE dimensionality reduction of the dihedral angles and subsequent DBSCAN clustering) of the MD ensemble are also shown. (B) Potential energy landscape based on the principal moments of inertia (a proxy for the shape of molecules). The black X's show the same MD clusters as in (A). (C) Extreme structures extracted from the shape descriptor in (B). Shown are the most spherical, disk-like, and rod-like structures observed in the MD simulations. For comparison, the most populated cluster structure is also shown, which is predominantly disk-like. (D) Deviation of the MD simulation computed NOEs to the experimental NOEs (red X). Repeated NOE numbers show ambiguous NOEs. The grey line shows the difference between the resulting maximal distance (max) as reported in the original publication1 and the experimental reference distance. The blue dashes give an estimate of the variance of the mean of the MD simulated NOE distances. The blue dashes do not necessarily show the full fluctuations of the MD simulations. For details, see ESI Text S6.† | ||
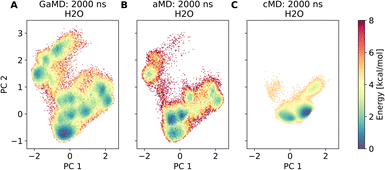
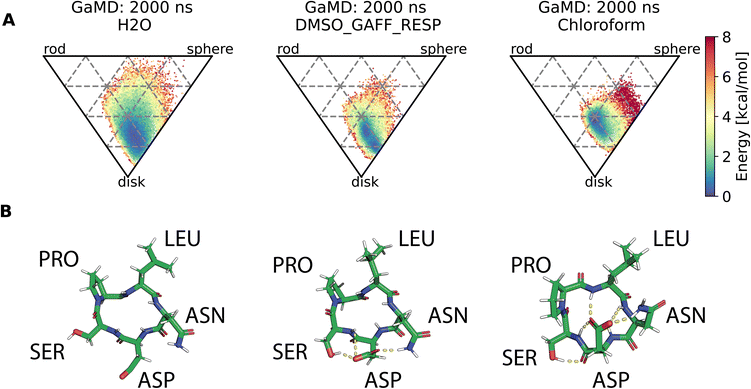
Assessment of conformers requires extensive sampling of the conformational space. A comparison of the potential energy surface (Fig. 5) shows accelerated MD approaches (aMD and GaMD) give similar sampling and that cMD only covers a small fraction of the conformational scape. Furthermore, cMD did not reproduce the global minimum found in the accelerated MD simulations. Simulations can be designed to reproduce different solvent effects, an important aspect that needs to be considered with respect to the experimental conditions for different peptides. The effects of simulating compound 22 in H2O, DMSO and chloroform reveals only subtle changes in terms of the shape of the peptide (Fig. 6A). However, simulations in DMSO and chloroform solvents do not seem to sample as many spherical structures as aqueous solvent. This is because H2O can form extensive H-bonds with the cyclic peptide. The chloroform structure is more compact because intramolecular H-bonds dominate. Fig. 6B shows the intramolecular H-bond contacts in the majority clusters of MD simulations in the three solvents H2O, DMSO and chloroform. The majority cluster of the chloroform simulation shows extensive intramolecular H-bonds, which lead to a more compact structure.
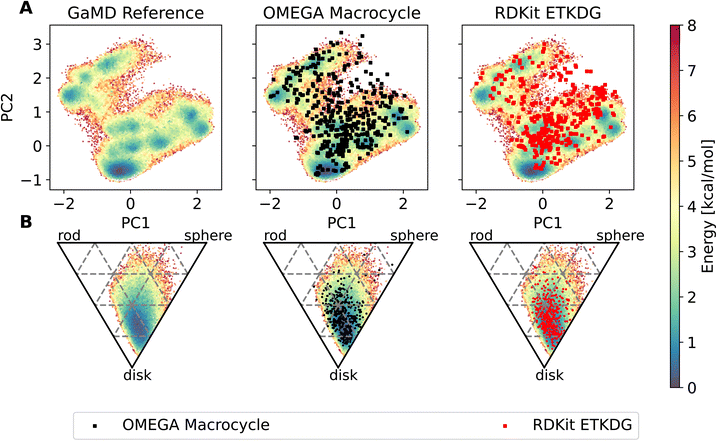
The workflow also enables an easy comparison to be made in terms of the conformers produced by MD compared to those made by dedicated conformer predictors. Fig. 7 shows an overlay of the PES derived via GaMD with the OMEGA and RDKit conformer generators. Most of the conformers reproduce the preferred shape well, the global minimum of the PCA representation is reproduced too. However, some of the structures sampled in the GaMD simulation are not reproduced by either conformer generator.
To compare different methods with one another, we introduced several metrics to measure agreement between computed and experimental NOE values for each compound. Here we show two such metrics, the percentage of NOE values fulfilled by the conformer generator (% of NOE distance restraints satisfied), as well as the root mean squared deviation (RMSD) between computed and experimental NOE values. For an alternative definition of the RMSD that takes the bounds into account, see ESI Text 11 and Fig. S24–S27.†
Comparing GaMD with cMD, we find, perhaps unsurprisingly that performance varies from compound to compound. Generally, experimental NOE values are reproduced well by the MD simulations for most compounds (Fig. 8). The GaMD (cMD) ensembles fulfil 74% (67%) of the reported NOEs, with an average RMSD from the experimental values of 0.6 Å (0.8 Å). Discrepancies between the two metrics can be attributed to reporting differences of the experimental NOE values and differences in how tight bounds are defined. E.g., compound 66 has the highest RMSD value (1.3 Å for GaMD). However, 70% of NOE values are still fulfilled in GaMD simulations. When considering all compounds analysed, cMD and GaMD do not show significantly different performances in the % of NOE distance restraints satisfied metric. However, in terms of RMSD, GaMD performs significantly better (see Fig. S15†). For some compounds GaMD clearly outperforms cMD. Conventional MD fails to reproduce the cis structure of compounds 24 and 49 (see Fig. S13 and S14† for PES). Generally, cMD reproduces the less flexible compounds well (57–68) but struggles with some of the more flexible compounds.
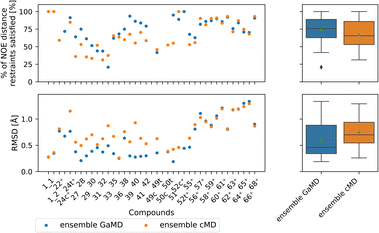 | ||
| Fig. 8 Comparing GaMD with cMD. The green triangle shows the mean, the black bar shows the median, +’s indicate compounds with high-quality NOE data. According to the paired t-test and Wilcoxon signed rank test (not shown here), no method performs significantly better in both the RMSD or % of NOE distance restraints satisfied metrics. For a heatmap of p-values for both statistical tests see Fig. S15.† | ||
Fig. S22 and S23† compare the Maclaurin series expansion used here to reweigh the GaMD NOEs with the alternative Boltzmann reweighting method. GaMD Boltzmann reweighted NOEs do not match the experimental NOEs as well as NOEs reweighted via the Maclaurin reweighting method.
Can cheminformatics conformer generators match MD simulations?
Although accelerated methods show broader coverage of conformational space, cMD also performs well at reproducing experimental NOEs. We thus evaluated how well the OMEGA and RDKit conformer generators perform relative to the MD simulations.In the following, we consider three separate comparisons:
(a) Comparison of the full (Ga)MD ensembles with a single cheminformatics structure that best matches the experimental data. We separately computed NOEs for every produced conformer and chose the conformer with the largest % of NOE distance restraints satisfied value.
(b) We compare the single most populated cluster of the MD simulations with the best cheminformatics-based structures (largest % of NOE distance restraints satisfied value, as in (a).
(c) We compare the full MD ensembles with various conformer bundles, composed from the cheminformatics derived structures.
Fig. 9–11 show the results for a–c, respectively. Full tables of the reported mean values are provided in ESI Tables S1 and S2.† For a brief discussion of the NOE coverage for varying peptide sequence lengths, see ESI Text S12.† For details on how well the solvation properties solvent accessible surface area (SASA) and polar surface area (PSA) of MD and cheminformatics agree, see ESI Text S13.†
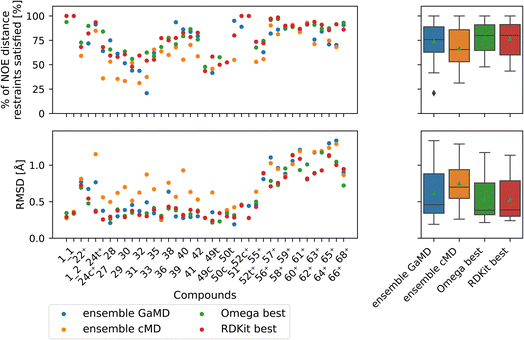 | ||
| Fig. 9 Comparison of full GaMD/cMD trajectories with the best single OMEGA/RDKit conformers. The green triangle shows the mean, the black bar shows the median. The +’s indicate compounds with high-quality NOE data. The best structures from OMEGA and RDKit ETKDG perform significantly better than the cMD at fulfilling NOEs in both metrics. OMEGA macrocycle and RDKit ETKDG do not show significantly different performance relative to one another or to GaMD. For outputs of all significance tests see Fig. S16.† | ||
Both OMEGA and RDKit show statistically significant different % of NOE distance restraints satisfied values (higher) compared to cMD (see Fig. 9, and S16† for p values of statistical tests). GaMD ensembles are statistically indistinguishable from the best OMEGA/RDKit structures. Equivalent observation can be made in the RMSD metric, where the cheminformatics conformer generators have lower values e.g., lower deviations from the experimentally reported NOE values, compared to cMD in a statistically significant manner. GaMD has higher RMSD values than OMEGA/RDKit, but these differences are again not statistically significant. Between OMEGA and RDKit, there is no statistically significant difference in either metric visible. While it is perhaps not “fair” to compare a full MD ensemble with a single best cheminformatics structure, it is nonetheless interesting to uncover the theoretical best performance of cheminformatics methods, relative to much more computationally expensive MD simulations.
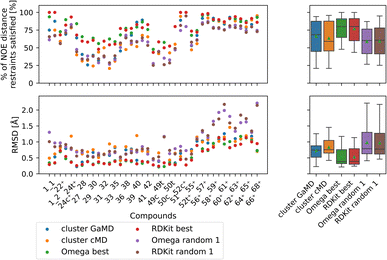 | ||
| Fig. 10 Comparing the most populated clusters derived via MD simulations to the best and randomly drawn cheminformatics structures. The green triangle shows the mean, the black bar shows the median. The +’s indicate compounds with high-quality NOE data. The best OMEGA/RDKit structures perform significantly better than the most populated GaMD/cMD clusters. Picking a random OMEGA/RDKit structure, averaged over 10 draws is significantly worse than the best OMEGA/RDKit structures or the most populated GaMD structure. The outputs of all significance tests are in Fig. S17.† | ||
Lowest energy conformers:
For a bundle of size n, we picked the n lowest MMFF energy conformers.
LICUV (least individual conformer upper violations):
For a bundle of size n, we picked the n conformers with the highest % of NOE distance restraints satisfied values.
NAMFIS (NMR analysis of molecular flexibility in solution):
We input all available conformers into a NAMFIS analysis and picked the n conformers with the largest weights.
Random:
We picked a random set of n conformers from all available conformers. We repeated this 10 times, and any computed properties are the average over these 10 bundles, each of size n.
LICUV and NAMFIS were used to establish a best-case scenario, as they rely on knowledge of the experimental NOE values. We chose a bundle size of n = 10, but also investigated other bundle sizes (see Fig. S20 and S21†). Results for OMEGA are shown in Fig. 11A (p-values in Fig. S18†), results for RDKit are shown in Fig. 11B (p-values in Fig. S19†).
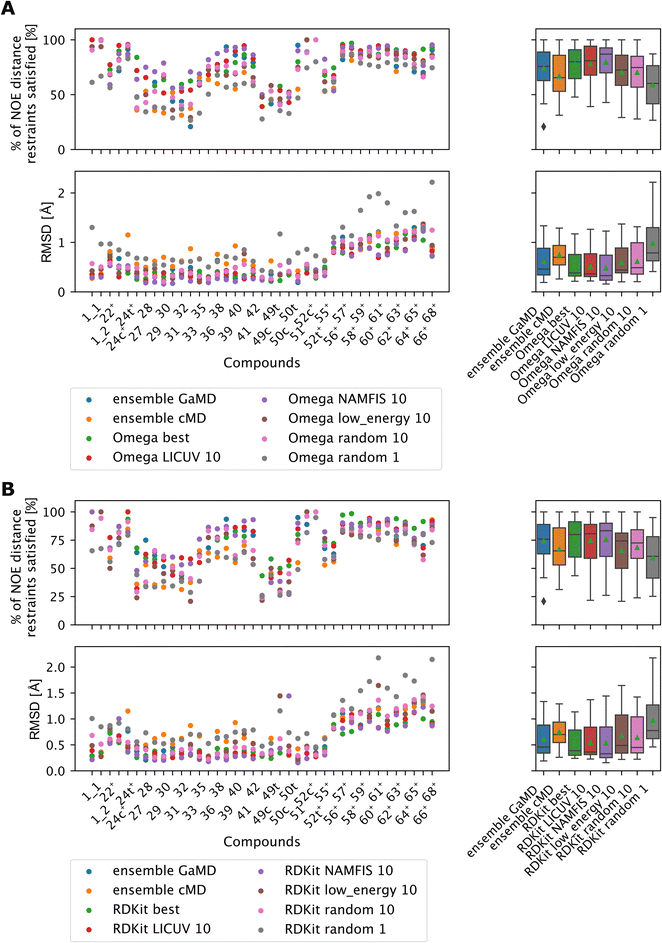 | ||
| Fig. 11 The green triangle shows the mean, the black bar shows the median. +’s indicate compounds with high-quality NOE data. (A) Comparing bundles of OMEGA macrocycle with the full MD ensembles. Random or low energy bundles of size 10 perform significantly better relative to GaMD ensembles or to picking a single random structure. Bundling randomly or via low MMFF energy are statistically indistinguishable from one another. LICUV and the single best structure do not show differing performance. NAMFIS reduces RMSDs of NOEs relative to the single best structure, but this does not lead to a significant increase in %NOE fulfilled values. See Fig. S18† for all p-values of statistical tests. (B) Comparing bundles of cheminformatics conformer generators (RDKit ETKDG) with the full MD ensembles. Random or low energy bundles of size 10 do not perform significantly different relative to GaMD/cMD ensembles in most statistical tests. See Fig. S19† for all p-values of statistical tests. Bundling randomly or via low MMFF energy are statistically indistinguishable from one another. The single best and LICUV bundles perform significantly better than randomly chosen or low MMFF energy bundles. | ||
All cheminformatics bundling methods that require knowledge of the NOEs (best, NAMFIS, LICUV) perform similar to each other and significantly better than the reference cMD simulations for both OMEGA and RDKit. OMEGA based NAMFIS ensembles show significantly better performance than the GaMD reference in both metrics, while LICUV is only significantly better in the RMSD metric. RDKit NAMFIS ensembles only show significant differences in the RMSD metric via the Wilcoxon signed rank test, and are otherwise statistically indistinguishable from the GaMD ensembles. LICUV and NAMFIS both improve performance relative to random bundle selection for OMEGA in all metrics, for RDKit the RMSD performance difference of NAMFIS and random is not significant in the paired t-test. Taking the single best structure is statistically indistinguishable to LICUV for OMEGA in both the paired t-test and Wilcoxon signed rank test for both metrics considered.
We find equivalent results for RDKit. LICUV seems not to improve the performance over taking only the single best structure. NAMFIS reduces the RMSD for OMEGA relative to the single best structure but does not show significant differences.
The bundling methods that do not involve knowledge of the NOEs for selecting conformers (random and lowest MMFF energies) do not perform significantly different to the cMD or GaMD simulations for both OMEGA and RDKit.
Selecting the lowest energy (MMFF) conformers is not significantly different from randomly choosing conformer bundles for both OMEGA and RDKit when comparing RMSDs or % of NOE distance restraints satisfied values of the NOEs.
Discussion
Knowledge of cyclic peptide solution structures is crucial for predicting their pharmacokinetic properties, such as passive membrane permeability.18 A variety of methods exist to produce CP (solution) structures, but method comparison and methodical evaluation is often lacking, in part due to the absence of easy-to-use CP solution structure datasets. Here, we provide a dataset of CP solution structures and computational workflows to automate method comparison.The data cleaning process during assembly of the MacroConf dataset was a laborious semi-manual procedure. We made every effort to automate as much of this process using existing tools, such as OSRA, but manual interventions were still required. We see two developments that will simplify this process in the future:
(1) More efficient and automated extraction of chemical information from previously published sources via tools such as ChemDataExtractor82 or CIRCA (https://circa.res.ibm.com/).
(2) Addition of experimental results to relevant databases will ensure that experimental data is as easily accessible as possible. Further, through provision of topology files and SMILES strings of studied compounds, studies can make follow on work much simpler and reduce possible errors.
Our workflow supports both MD simulations and cheminformatics conformer generators and automates execution and analysis of MD simulations. The workflow further allows for detailed comparisons of simulation outputs to one-another, to experimental NMR data, and to other conformer generators.
The MacroConf dataset is limited by the available experimental data we found in the literature, which can be seen in the heterogeneous composition and varying NMR measurements, setups, and parameters. Experiments were performed in different solvents and were not necessarily of equal quality, which is reflected particularly in the different reporting of the NOE values. The dataset does not cover the whole chemical space of short to medium sized cyclic peptides, with some compounds similar to others. Thus, we must keep in mind the limit of available quantity and quality of experimental data. In the present study, we made sure to employ relative comparisons between different methods. Absolute comparisons between different compounds or subsets of the dataset can be problematic due to the varying information content of different NOEs, which leads to different restraining power.
Further, some studies provide additional data such as chemical shifts or coupling constants, which could be used as a supplement to the NOEs to further constrain the conformational preferences of certain compounds. For example, 3J(HNHα) coupling constants and 1Hα chemical shifts can be used to constrain backbone dihedral angles. Sidechain coupling constants and methyl chemical shifts also can provide restraints for sidechain χ1 and χ2 dihedral angles, but these measurements typically require peptides enriched with 13C isotopes.
Various MD based methods to elucidate solution structures of cyclic peptides are available,27 but frequently, methods are only evaluated on relatively small datasets. It is underexplored how well computationally much cheaper cheminformatics conformer generators produce solution structures of CPs. Often designed for high-throughput workflows, cheminformatics conformer generators are usually benchmarked to reproduce crystal structures of CPs.10 However, cheminformatics conformer generators have merit when studying solution structures of CPs. For example, it has been shown that OMEGA produces plausible solution structures for a set of bRo5 drugs.83 More recently, Wang et al.44 adapted the popular open source RDKit ETKDG conformer generator to incorporate NOE-derived distances directly in the conformer generation process. They also showed how the cheminformatics output structures can be refined via restrained MD simulations.
As part of this study, we made use of the NAMFIS method to filter out the cheminformatics conformers that best match the NOE data. However, other methods exist that enable re-weighting of conformations of the full ensemble to select the sub-ensemble that is most compatible with the NMR data.84 The maximum-parsimony approach selects a minimum ensemble that can explain the experimental data, while the maximum-entropy method only minimally perturbs the original weights.85,86 However, methods that produce plausible solution structures of CPs without relying on experimental parameters are more attractive from an in silico design perspective.
Here, we evaluated four commonly used methods to model cyclic peptide conformations: GaMD, cMD, OMEGA macrocycle and RDKit ETKDG. Instead of using the full MacroConf dataset, we used a subset of the MacroConf dataset, containing exclusively cyclic peptides with natural L- and D-amino acids. This made the forcefield choice for the MD based methods easier and avoided manual parametrisation of charges. To consider the chemically modified macrocycles of the MacroConf dataset, we will need to use additional forcefield parametrisations, such as Forcefield_NCAA,63 for only minor chemical modifications, or rely on a more flexible all-atom force field such as GAFF, parsley, sage or others.
The two flavours of accelerated MD, GaMD and aMD, performed comparably at sampling conformations of the CPs studied when considering dPCA PES of several compounds. Both methods were superior at sampling compared to cMD, which does not converge to the same energy landscapes within equivalent simulation times. We required long simulation times (1000 ns or more) to achieve convergence for (G)aMD, which makes these methods much more expensive (runtime ∼7 days for a 2000 ns simulation on a Nvidia GeForce RTX2080 GPU) than the cheminformatics conformer generators (runtime: from several seconds to 10's of minutes on an Intel Core i9-9920X CPU). However, MD simulations allow us to retrieve a time resolved trajectory, which includes thermodynamic information and explicit solute–solvent interactions that are unavailable for cheminformatics conformer generators.
All MD methods, including cMD, reproduced experimental NOE values well and performed overall similar in terms of the number of fulfilled NOEs, as captured by the % of NOE distance restraints satisfied metric. The GaMD ensembles showed lower RMSD values, which can be interpreted as better agreement with the experimentally reported NOE distances. The observed similarity of GaMD and cMD in the % of NOEs fulfilled could be for two reasons. First, while the sampling looked dissimilar in the dihedral PCA representation, the observed structures in the cMD or non-converged GaMD/aMD simulations might be close enough to the experimental structures, such that no significantly different performance was observed. Alternatively, the NOE metric may not be sensitive enough to pick up subtle quality differences of the different methods implemented. Compounds 24 and 49 illustrate why enhanced sampling methods, such as GaMD, are required: both compounds are present in solution in an equilibrium of cis/trans isomers caused by their proline residues. In the cMD simulations, only the trans isomers were sampled, the cis structures were not observed (see ESI Text S7 and Fig. S13, S14†). GaMD was able to sample both isomers and produce good agreement with the experimental NOE values. Despite GaMD and cMD not being statistically significantly different for the whole dataset, outlier cases like compounds 24 and 49 illustrate why enhanced sampling methods are useful, when no prior knowledge of a cyclic peptide system is available.
The comparison of cheminformatics and MD methods is also a comparison of different force fields and solvent models, since both OMEGA and RDKit have optional final force field optimisation steps with MMFF94. While the cheminformatics methods lack explicit solvent interactions and polar nonbonded interactions this does not seem to impact their performance at producing valid solution structures that agree closely with experimental NOEs, as shown here. We observed that picking a bundle of random structures from cheminformatics methods performs comparably to using MD ensembles. This might partly be due to the r−6 averaging when combining structures, i.e., as soon as one of the structures fulfils a given NOE then the bundle probably fulfils the NOEs as whole. Further improvements to cheminformatics structures are possible by running short MD simulations based on the conformer generator outputs.44 In our analysis, we focused on the fraction of NOEs that were fulfilled (% of NOE distance restraints satisfied). An interesting point of view in the context of cheminformatics conformer generators is to consider NOE violations. This is essentially the inverse of the % of NOE distance restraints satisfied metric. As such, the results presented here can also be interpreted in terms of violations. In the future, it will be interesting to see whether we can devise innovative selection methods for choosing relevant cheminformatics conformers from the ensembles produced that do not rely on incorporating experimental knowledge. We tried using the MMFF energies to select cheminformatics structures, but this selection method was statistically indistinguishable from selecting conformers randomly. This confirms previous indications that MMFF energies are not a useful metric for conformer selection.83
Conclusions
We presented the MacroConf dataset of CP solution structures, together with an analysis of how well different CP conformer generators reproduce CP solution structures. We provide reusable, modular, and open-source code that is easily extendable to other methods (cheminformatics & MD), as well as to more compounds or other datasets. We showed as part of our analysis that both GaMD/cMD and the cheminformatics methods OMEGA Macrocycle/RDKit ETKDG produce CP-structures in good agreement with experimental NOE values. Single randomly selected cheminformatics structures often do not match the performance observed in MD simulations. However, bundling of multiple cheminformatics structures increases performance to levels comparable to GaMD. We encourage readers to submit any CP solution structures with associated NOE data that are not part of the MacroConf dataset at https://github.com/bigginlab/macroconf. We hope this work will aid validation and further improvement of conformer generators to improve solution structure predictions of CPs.Data availability
All datasets and workflows are hosted at: https://github.com/D-Cru/macroconf and forked at: https://github.com/bigginlab/macroconf.Author contributions
PCB, FC and JRS formulated the project. DC performed all simulations, built the dataset and designed the analysis. All authors analysed the data. DC wrote the first draft and all authors contributed to revising and editing the manuscript.Conflicts of interest
There are no conflicts to declare.Acknowledgements
We thank Dr Irfan Alibay for advice related to molecular dynamics simulations. We thank Dr Christina Redfield for feedback and discussions related to the use of NMR data. We thank Dr Garrett Morris for feedback and discussions on dimensionality reduction methods and cheminformatics conformer generators. DC is supported by the University of Oxford Medical Science Division and IBM/EPSRC.References
- E. W. Guthohrlein, M. Malesevic, Z. Majer and N. Sewald, Biopolymers, 2007, 88, 829–839 CrossRef CAS PubMed.
- M. Scudellari, Nature, 2019, 567, 298–300 CrossRef CAS PubMed.
- E. Valeur, S. M. Gueret, H. Adihou, R. Gopalakrishnan, M. Lemurell, H. Waldmann, T. N. Grossmann and A. T. Plowright, Angew. Chem., Int. Ed. Engl., 2017, 56, 10294–10323 CrossRef CAS PubMed.
- G. Caron, J. Kihlberg, G. Goetz, E. Ratkova, V. Poongavanam and G. Ermondi, ACS Med. Chem. Lett., 2021, 12, 13–23 CrossRef CAS PubMed.
- S. D. Appavoo, S. Huh, D. B. Diaz and A. K. Yudin, Chem. Rev., 2019, 119, 9724–9752 CrossRef CAS PubMed.
- A. A. Vinogradov, Y. Yin and H. Suga, J. Am. Chem. Soc., 2019, 141, 4167–4181 CrossRef CAS PubMed.
- A. Zorzi, K. Deyle and C. Heinis, Curr. Opin. Chem. Biol., 2017, 38, 24–29 CrossRef CAS PubMed.
- C. Morrison, Nat. Rev. Drug Discov., 2018, 17, 531–533 CrossRef CAS PubMed.
- J. E. Bock, J. Gavenonis and J. A. Kritzer, ACS Chem. Biol., 2013, 8, 488–499 CrossRef CAS PubMed.
- P. C. D. Hawkins and S. Wlodek, J. Chem. Inf. Model., 2020, 60, 3518–3533 CrossRef CAS PubMed.
- D. Sindhikara, S. A. Spronk, T. Day, K. Borrelli, D. L. Cheney and S. L. Posy, J. Chem. Inf. Model., 2017, 57, 1881–1894 CrossRef CAS PubMed.
- S. Wang, J. Witek, G. A. Landrum and S. Riniker, J. Chem. Inf. Model., 2020, 60, 2044–2058 CrossRef CAS PubMed.
- V. Poongavanam, Y. Atilaw, S. Ye, L. H. E. Wieske, M. Erdelyi, G. Ermondi, G. Caron and J. Kihlberg, J. Pharm. Sci., 2021, 110, 301–313 CrossRef CAS PubMed.
- P. Thepchatri, T. Eliseo, D. O. Cicero, D. Myles and J. P. Snyder, J. Am. Chem. Soc., 2007, 129, 3127–3134 CrossRef CAS PubMed.
- J. Witek, B. G. Keller, M. Blatter, A. Meissner, T. Wagner and S. Riniker, J. Chem. Inf. Model., 2016, 56, 1547–1562 CrossRef CAS PubMed.
- J. Witek, M. Muhlbauer, B. G. Keller, M. Blatter, A. Meissner, T. Wagner and S. Riniker, ChemPhysChem, 2017, 18, 3309–3314 CrossRef CAS PubMed.
- F. Begnini, V. Poongavanam, Y. Atilaw, M. Erdelyi, S. Schiesser and J. Kihlberg, ACS Med. Chem. Lett., 2021, 12(6), 983–990 CrossRef CAS PubMed.
- A. S. Kamenik, S. M. Linker and S. Riniker, in Approaching the Next Inflection in Peptide Therapeutics: Attaining Cell Permeability and Oral Bioavailability, 2022, DOI:10.1021/bk-2022-1417.ch005, pp. 137–154.
- P. Bonnet, D. K. Agrafiotis, F. Zhu and E. Martin, J. Chem. Inf. Model., 2009, 49, 2242–2259 CrossRef CAS PubMed.
- K. S. Watts, P. Dalal, A. J. Tebben, D. L. Cheney and J. C. Shelley, J. Chem. Inf. Model., 2014, 54, 2680–2696 CrossRef CAS PubMed.
- E. A. Coutsias, K. W. Lexa, M. J. Wester, S. N. Pollock and M. P. Jacobson, J. Chem. Theory Comput., 2016, 12, 4674–4687 CrossRef CAS PubMed.
- L. Chan, G. R. Hutchison and G. M. Morris, J. Chem. Inf. Model., 2021, 61, 743–755 CrossRef CAS PubMed.
- P. Labute, J. Chem. Inf. Model., 2010, 50, 792–800 CrossRef CAS PubMed.
- A. E. Cleves and A. N. Jain, J. Comput. Aided Mol. Des., 2017, 31, 419–439 CrossRef CAS PubMed.
- N. O. Friedrich, F. Flachsenberg, A. Meyder, K. Sommer, J. Kirchmair and M. Rarey, J. Chem. Inf. Model., 2019, 59, 731–742 CrossRef CAS PubMed.
- P. C. D. Hawkins, J. Chem. Inf. Model., 2017, 57, 1747–1756 CrossRef CAS PubMed.
- J. Damjanovic, J. Miao, H. Huang and Y. S. Lin, Chem. Rev., 2021, 121, 2292–2324 CrossRef CAS PubMed.
- A. Llinas, I. Oprisiu and A. Avdeef, J. Chem. Inf. Model., 2020, 60, 4791–4803 CrossRef CAS PubMed.
- D. S. Nielsen, R. J. Lohman, H. N. Hoang, T. A. Hill, A. Jones, A. J. Lucke and D. P. Fairlie, ChemBioChem, 2015, 16, 2289–2293 CrossRef CAS PubMed.
- E. Marsault and M. L. Peterson, J. Med. Chem., 2011, 54, 1961–2004 CrossRef CAS PubMed.
- H. Kessler, Angew. Chem., Int. Ed. Engl., 1982, 21, 512–523 CrossRef.
- B. K. W. Chung, C. J. White, C. C. G. Scully and A. K. Yudin, Chem. Sci., 2016, 7, 6662–6668 RSC.
- A. S. Kamenik, U. Lessel, J. E. Fuchs, T. Fox and K. R. Liedl, J. Chem. Inf. Model., 2018, 58, 982–992 CrossRef CAS PubMed.
- Y. Miao, V. A. Feher and J. A. McCammon, J. Chem. Theory Comput., 2015, 11, 3584–3595 CrossRef CAS PubMed.
- S. M. McHugh, J. R. Rogers, H. Yu and Y. S. Lin, J. Chem. Theory Comput., 2016, 12, 2480–2488 CrossRef CAS PubMed.
- D. Hamelberg, J. Mongan and J. A. McCammon, J. Chem. Phys., 2004, 120, 11919–11929 CrossRef CAS PubMed.
- Y. Miao and J. A. McCammon, Annu. Rep. Comput. Chem., 2017, 13, 231–278 Search PubMed.
- Y. Miao, W. Sinko, L. Pierce, D. Bucher, R. C. Walker and J. A. McCammon, J. Chem. Theory Comput., 2014, 10, 2677–2689 CrossRef CAS PubMed.
- A. E. Wakefield, W. M. Wuest and V. A. Voelz, J. Chem. Inf. Model., 2015, 55, 806–813 CrossRef CAS PubMed.
- A. Shkurti, I. D. Styliari, V. Balasubramanian, I. Bethune, C. Pedebos, S. Jha and C. A. Laughton, J. Chem. Theory Comput., 2019, 15, 2587–2596 CrossRef CAS PubMed.
- S. Ono, M. R. Naylor, C. E. Townsend, C. Okumura, O. Okada and R. S. Lokey, J. Chem. Inf. Model., 2019, 59, 2952–2963 CrossRef CAS PubMed.
- J. C. Baber, D. C. Thompson, J. B. Cross and C. Humblet, J. Chem. Inf. Model., 2009, 49, 1889–1900 CrossRef CAS PubMed.
- T. Schulz-Gasch, C. Scharfer, W. Guba and M. Rarey, J. Chem. Inf. Model., 2012, 52, 1499–1512 CrossRef CAS PubMed.
- S. Wang, K. Krummenacher, G. A. Landrum, B. D. Sellers, P. Di Lello, S. J. Robinson, B. Martin, J. K. Holden, J. Y. K. Tom, A. C. Murthy, N. Popovych and S. Riniker, J. Chem. Inf. Model., 2022, 62(3), 472–485 CrossRef CAS PubMed.
- E. L. Ulrich, H. Akutsu, J. F. Doreleijers, Y. Harano, Y. E. Ioannidis, J. Lin, M. Livny, S. Mading, D. Maziuk, Z. Miller, E. Nakatani, C. F. Schulte, D. E. Tolmie, R. Kent Wenger, H. Yao and J. L. Markley, Nucleic Acids Res., 2008, 36, D402–D408 CrossRef CAS PubMed.
- S. Karplus and M. Karplus, Proc. Natl. Acad. Sci. U. S. A., 1972, 69, 3204–3206 CrossRef CAS PubMed.
- A. W. Overhauser, Phys. Rev., 1953, 92, 411–415 CrossRef CAS.
- L. Jackman, Dynamic Nuclear Magnetic Resonance Spectroscopy, Elsevier Science, 2012 Search PubMed.
- D. O. Cicero, G. Barbato and R. Bazzo, J. Am. Chem. Soc., 1995, 117, 1027–1033 CrossRef CAS.
- F. J. Duffy, M. Verniere, M. Devocelle, E. Bernard, D. C. Shields and A. J. Chubb, J. Chem. Inf. Model., 2011, 51, 829–836 CrossRef CAS PubMed.
- I. V. Filippov and M. C. Nicklaus, J. Chem. Inf. Model., 2009, 49, 740–743 CrossRef CAS PubMed.
- N. M. O'Boyle, M. Banck, C. A. James, C. Morley, T. Vandermeersch and G. R. Hutchison, J. Cheminform., 2011, 3, 33 CrossRef PubMed.
- M. Aristarán, M. Tigas, J. B. Merrill, J. Das, D. Frackman and T. Swicegood, Tabula 1.2.1, Tabula is a tool for liberating data tables locked inside pdf files, 2018, https://tabula.technology Search PubMed.
- G. Landrum, P. Tosco, B. Kelley, Ric, D. Cosgrove, sriniker, gedeck, R. Vianello, NadineSchneider, E. Kawashima, Dan N, G. Jones, A. Dalke, B. Cole, M. Swain, S. Turk, AlexanderSavelyev, A. Vaucher, M. Wójcikowski, I. Take, D. Probst, K. Ujihara, V. F. Scalfani, guillaume godin, J. Lehtivarjo, A. Pahl, R. Walker, F. Berenger, jasondbiggs and strets123, RDKit 2023_03_2 (Q1 2023), RDKit: Open-source cheminformatics, 2023, DOI:10.5281/zenodo.591637.
- J. Koster and S. Rahmann, Bioinformatics, 2012, 28, 2520–2522 CrossRef PubMed.
- F. Mölder, K. P. Jablonski, B. Letcher, M. B. Hall, C. H. Tomkins-Tinch, V. Sochat, J. Forster, S. Lee, S. O. Twardziok, A. Kanitz, A. Wilm, M. Holtgrewe, S. Rahmann, S. Nahnsen and J. Köster, F1000 Research, 2021, 10, 33 Search PubMed.
- C. R. Harris, K. J. Millman, S. J. van der Walt, R. Gommers, P. Virtanen, D. Cournapeau, E. Wieser, J. Taylor, S. Berg, N. J. Smith, R. Kern, M. Picus, S. Hoyer, M. H. van Kerkwijk, M. Brett, A. Haldane, J. F. Del Rio, M. Wiebe, P. Peterson, P. Gerard-Marchant, K. Sheppard, T. Reddy, W. Weckesser, H. Abbasi, C. Gohlke and T. E. Oliphant, Nature, 2020, 585, 357–362 CrossRef CAS PubMed.
- The pandas development team, pandas-dev/pandas: Pandas, Zenodo, 2020, DOI:10.5281/zenodo.3509134.
- W. Mckinney, Data Structures for Statistical Computing in Python, Proceedings of the 9th Python in Science Conference, 2010, pp. 56–61, DOI:10.25080/Majora-92bf1922-00a.
- F. Cipcigan, P. Smith, J. Crain, A. Hogner, L. De Maria, A. Llinas and E. Ratkova, J. Chem. Inf. Model., 2021, 61, 263–269 CrossRef CAS PubMed.
- D. A. Case, I. Y. Ben-Shalom, S. R. Brozell, D. S. Cerutti, T. E. Cheatham III, V. W. D. Cruzeiro, T. A. Darden, R. E. Duke, D. Ghoreishi, M. K. Gilson, H. Gohlke, A. W. Goetz, D. Greene, R. Harris, N. Homeyer, Y. Huang, S. Izadi, A. Kovalenko, T. Kurtzman, T. S. Lee, S. LeGrand, P. Li, C. Lin, J. Liu, T. Luchko, R. Luo, D. J. Mermelstein, K. M. Merz, Y. Miao, G. Monard, C. Nguyen, H. Nguyen, I. Omelyan, A. Onufriev, F. Pan, R. Qi, D. R. Roe, A. Roitberg, C. Sagui, S. Schott-Verdugo, J. Shen, C. L. Simmerling, J. Smith, R. Salomon- Ferrer, J. Swails, R. C. Walker, J. Wang, H. Wei, R. M. Wolf, X. Wu, L. Xiao, D. M. York and P. A. Kollman, AMBER 2018, University of California, San Francisco, CA, 2018 Search PubMed.
- J. A. Maier, C. Martinez, K. Kasavajhala, L. Wickstrom, K. E. Hauser and C. Simmerling, J. Chem. Theory Comput., 2015, 11, 3696–3713 CrossRef CAS PubMed.
- G. A. Khoury, J. Smadbeck, P. Tamamis, A. C. Vandris, C. A. Kieslich and C. A. Floudas, ACS Synth. Biol., 2014, 3, 855–869 CrossRef PubMed.
- W. L. Jorgensen, J. Chandrasekhar, J. D. Madura, R. W. Impey and M. L. Klein, J. Chem. Phys., 1983, 79, 926–935 CrossRef CAS.
- J. Wang, R. M. Wolf, J. W. Caldwell, P. A. Kollman and D. A. Case, J. Comput. Chem., 2004, 25, 1157–1174 CrossRef CAS PubMed.
- E. Gaines, K. Maisuria and D. Di Tommaso, CrystEngComm, 2016, 18, 2937–2948 RSC.
- A. Jakalian, B. L. Bush, D. B. Jack and C. I. Bayly, J. Comput. Chem., 2000, 21, 132–146 CrossRef CAS.
- P. Cieplak, J. Caldwell and P. Kollman, J. Comput. Chem., 2001, 22, 1048–1057 CrossRef CAS.
- R. Walker, 6.3 Using Accelerated Molecular Dynamics (aMD) to Enhance Sampling, https://ambermd.org/tutorials/advanced/tutorial22/section1.php, accessed July 2021 Search PubMed.
- R. T. McGibbon, K. A. Beauchamp, M. P. Harrigan, C. Klein, J. M. Swails, C. X. Hernandez, C. R. Schwantes, L. P. Wang, T. J. Lane and V. S. Pande, Biophys. J., 2015, 109, 1528–1532 CrossRef CAS PubMed.
- P. Virtanen, R. Gommers, T. E. Oliphant, M. Haberland, T. Reddy, D. Cournapeau, E. Burovski, P. Peterson, W. Weckesser, J. Bright, S. J. van der Walt, M. Brett, J. Wilson, K. J. Millman, N. Mayorov, A. R. J. Nelson, E. Jones, R. Kern, E. Larson, C. J. Carey, I. Polat, Y. Feng, E. W. Moore, J. VanderPlas, D. Laxalde, J. Perktold, R. Cimrman, I. Henriksen, E. A. Quintero, C. R. Harris, A. M. Archibald, A. H. Ribeiro, F. Pedregosa, P. van Mulbregt and C. SciPy, Nat. Methods, 2020, 17, 261–272 CrossRef CAS PubMed.
- F. V. Pedregosa, G. Varoquaux, A. Gramfort, V. Michel, B. Thirion, O. Grisel, M. Blondel, P. Prettenhofer, R. Weiss, V. Dubourg, J. Vanderplas, A. Passos, D. B. Cournapeau, M. Brucher, M. Perrot and E. Duchesnay, J. Mach. Learn. Res., 2011, 12, 2825–2830 Search PubMed.
- H. Nguyen, D. A. Case and A. S. Rose, Bioinformatics, 2018, 34, 1241–1242 CrossRef CAS PubMed.
- PyMOL, The PyMOL Molecular Graphics System, Version 2.0, Schrödinger, LLC, 2015 Search PubMed.
- J. Noggle, The Nuclear Overhauser Effect, Elsevier Science, 2012 Search PubMed.
- B. Zagrovic and W. F. van Gunsteren, Proteins, 2006, 63, 210–218 CrossRef CAS PubMed.
- J. Tropp, J. Chem. Phys., 1980, 72, 6035–6043 CrossRef CAS.
- C. R. Jones, C. P. Butts and J. N. Harvey, Beilstein J. Org. Chem., 2011, 7, 145–150 CrossRef CAS PubMed.
- G. Balogh, T. Gyongyosi, I. Timari, M. Herczeg, A. Borbas, K. Feher and K. E. Kover, J. Chem. Inf. Model., 2019, 59, 4855–4867 CrossRef CAS PubMed.
- S. Holm, Scand. J. Stat., 1979, 65–70 Search PubMed.
- J. Wang, P. R. Arantes, A. Bhattarai, R. V. Hsu, S. Pawnikar, Y. M. Huang, G. Palermo and Y. Miao, Wiley Interdiscip. Rev.: Comput. Mol. Sci., 2021, 11 Search PubMed.
- M. C. Swain and J. M. Cole, J. Chem. Inf. Model., 2016, 56, 1894–1904 CrossRef CAS PubMed.
- V. Poongavanam, E. Danelius, S. Peintner, L. Alcaraz, G. Caron, M. D. Cummings, S. Wlodek, M. Erdelyi, P. C. D. Hawkins, G. Ermondi and J. Kihlberg, ACS Omega, 2018, 3, 11742–11757 CrossRef CAS PubMed.
- M. Bonomi, G. T. Heller, C. Camilloni and M. Vendruscolo, Curr. Opin. Struct. Biol., 2017, 42, 106–116 CrossRef CAS PubMed.
- M. Groth, J. Malicka, C. Czaplewski, S. Oldziej, L. Lankiewicz, W. Wiczk and A. Liwo, J. Biomol. NMR, 1999, 15, 315–330 CrossRef CAS PubMed.
- G. V. Nikiforovich, B. Vesterman, J. Betins and L. Podins, J. Biomol. Struct. Dyn., 1987, 4, 1119–1135 CrossRef CAS PubMed.
Footnote |
| † Electronic supplementary information (ESI) available. See DOI: https://doi.org/10.1039/d3dd00053b |
| This journal is © The Royal Society of Chemistry 2023 |

