Hydrogen economy driven by offshore wind in regional comprehensive economic partnership members†
Wennan
Zhuang‡
a,
Guangsheng
Pan‡
 a,
Wei
Gu
*a,
Suyang
Zhou
a,
Qinran
Hu
a,
Wei
Gu
*a,
Suyang
Zhou
a,
Qinran
Hu
 a,
Zhongfan
Gu
a,
Zhi
Wu
a,
Shuai
Lu
a and
Haifeng
Qiu
b
a,
Zhongfan
Gu
a,
Zhi
Wu
a,
Shuai
Lu
a and
Haifeng
Qiu
b
aSchool of Electrical Engineering, Southeast University, Nanjing 210096, China. E-mail: wgu@seu.edu.cn
bSchool of Electrical and Electronic Engineering, Nanyang Technological University, Singapore 639798, Singapore
First published on 16th March 2023
Abstract
Hydrogen is expected to be an essential part of the global energy trade. Herein, we explore the offshore wind-based hydrogen (OWH) in the Regional Comprehensive Economic Partnership (RCEP) members. The results show that the OWH production potential in the RCEP members can reach approximately 1200 megatons, which will be reduced to a tenth when facing the 2050 cost-competitive onshore renewable hydrogen from RCEP members. A co-development optimisation model of all the RCEP members shows that low-cost OWH in Australia, New Zealand, and China can be exported to the Association of Southeast Asian Nations (ASEAN), the Republic of Korea, and Japan on a large scale. In 2050, compared with the non-trade scenario, the average levelized cost of used hydrogen (LCOHU) in RCEP members will be reduced by 0.29 $ per kg, bringing an economic benefit of $33.3 billion. Two key parameters, i.e., onshore renewable hydrogen cost and forecasted hydrogen demands, are used to verify the stability of the import and export roles of RCEP members. Consequently, it is concluded that OWH can contribute to offshore wind exploitation and the hydrogen economy among RCEP members.
Broader contextOffshore wind-based hydrogen (OWH) is expected to become global trading energy similar to oil in the future. The signing of the Regional Comprehensive Economic Partnership (RCEP) provides an opportunity for related members to develop offshore wind power jointly. Therefore, this work explores the potential for promoting the hydrogen economy of RCEP members based on the OWH potential, demands, and international trading under the RCEP tax-free policy. Specifically, based on the co-development of OWH in RCEP members, the following questions are answered: (a) To what extent can the OWH potential in RCEP meet the hydrogen demand? (b) Compared with onshore green hydrogen, how much OWH in RCEP is cost competitive? (c) How can the RCEP members trade OWH, and what are their roles? Importers or exporters? (d) Compared with trading with non-RCEP economies, can RCEP members benefit from the OWH economy in RCEP, and what influences the economy most? |
1 Introduction
Hydrogen is predicted to account for 18% of the final energy demand in 2050.1 Green hydrogen, which is defined as hydrogen produced from renewable electricity via electrolysis,2,3 has the advantages of low carbon emissions,4 easy production,5 and diverse applications6 compared with the currently dominant coal/gas-based hydrogen. Moreover, as a medium for large-scale energy storage to support power system operation,7,8 green hydrogen is expected to achieve large-scale use in 2040–20509 and play an essential role in decarbonisation.10 To date, numerous studies in the literature have investigated the economic and environmental performance throughout the life cycle of hydrogen.11–14 The results show that the cost and low-carbon competitiveness of green hydrogen or electrolytic hydrogen are affected by many factors, such as the grid electricity price and carbon intensity, renewable power generation level, and terminal application. Accordingly, these factors limit its current application scale. Therefore, the production of competitive and large-scale green hydrogen will be the focus of the next 30 years if it is expected to help achieve carbon neutrality.Here, we focus on the hydrogen economy driven by offshore wind in the Regional Comprehensive Economic Partnership (RCEP) member countries and attempt to provide a route to satisfy the hydrogen requirement in 2050. Why offshore wind is promising, why offshore wind-based hydrogen (OWH) is viable, and why it can be used in RCEP member countries are three focal points investigated in this work.
Offshore wind, generally with a high capacity factor (CF) and proximity to load centres compared to onshore wind, has been listed in the national energy plan of many countries.15 In particular, Europe, as the world's largest offshore wind investor, has 72% of the world's current offshore wind capacity in the North Sea and the adjacent Atlantic region.16 An analysis of offshore wind in the five Nordic countries showed that offshore wind power can be commercially competitive in mature markets without subsidies, with average bidding of approximately 50 € per MWh in 2019.17 China has become the world's second-largest investor in offshore wind plants and built 3.1 GW of offshore wind turbines in 2020, surpassing Europe for the first time in terms of annual offshore wind installations. According to the International Renewable Energy Agency (IRENA) report,18 more than 2000 GW of offshore wind plants needs to be installed by 2050 in a Paris-compliant 1.5 °C scenario, while only 35 GW of offshore wind plants was installed in 2020 worldwide, far below the 2050 target. Therefore, it is foreseeable that more offshore wind plants will be built around the world in the future.
Effectively developing and utilising offshore wind power is a crucial issue in the future. Offshore wind capacity, transmission constraints, and system non-synchronous penetration (SNSP) of power systems determine how much offshore wind power is curtailed.19 The mismatch between electricity load demand and offshore wind potential also prevents offshore wind power from playing a more significant energy role. Taking China as an example, Sherman et al. showed that the aggregate potential wind resource is more than five times that of the current coastal demand for power.15 In terms of green hydrogen application from renewables such as wind power, Terlouw et al. introduced three methods of hydrogen production via water electrolysis, including grid-connected, hybrid, and autonomous scenarios, for techno-economic and environmental assessment in large-scale applications on geographical islands.20 Currently, considerable research and applications focus on the international trading of hydrogen or its synthetic fuel. The usual trade routes include China to Japan, Australia to Japan, Saudi Arabia to Japan and Germany, etc.21–23 Specifically, OWH is widely viewed as an energy carrier for offshore wind exploitation and international trade.24,25
On 15 November 2020, the ten countries of the Association of Southeast Asian Nations (ASEAN), China, Japan, the Republic of Korea, Australia, and New Zealand concluded the RCEP, marking the official launch of the free trade zone with the largest population and economic size in the world. According to the Schedule of Tariff Commitments in the RCEP Agreement, most trade-in goods will be duty-free immediately or within ten years after the agreement enters into force. On 23 September 2022, the RCEP Think Tank Network was officially established to provide academic support for the full release of RCEP dividends, which explicitly calls for mutual investment and cooperation among RCEP member countries in offshore wind power development.26 A recent study showed that the RCEP Agreement can increase the trade in goods and expand the economic output among RCEP members.27 Among the RCEP members, Japan and the Republic of Korea developed their hydrogen economy earlier and possess leading technologies, while Australia is committed to becoming a major hydrogen exporter in the future.28,29 Additionally, the differences and complementarities among RCEP members in terms of offshore wind exploitation conditions, hydrogen production costs and potential, and hydrogen technology levels have injected new vitality into the hydrogen economy of the RCEP members.
Therefore, this work explores the potential for promoting the hydrogen economy of RCEP members based on offshore wind exploitation under the RCEP tax-free policy. The area where the offshore wind turbine can be installed in the RCEP members is filtered based on a series of installation conditions. The CF of the offshore wind plants is calculated by means of the www.renewables.ninja platform, a simulation tool of the hourly power output from wind and solar power plants, using wind speed from NASA's MERRA-2 (Modern-Era Retrospective analysis for Research and Applications, version 2). Then, the OWH and its levelized cost of hydrogen (LCOH) are calculated and compared to onshore renewable hydrogen based on the spatial distribution of 0.5° latitude by 0.625° longitude. A co-development model is developed to analyse the OWH cost, trading, and carbon reduction performance among RCEP members. The results show that OWH will be another option for offshore wind exploitation besides grid connection, and the co-development of OWH within RCEP members could contribute to offshore wind exploitation and the hydrogen economy in RCEP members.
2 Methodology
2.1 OWH trading model within RCEP members
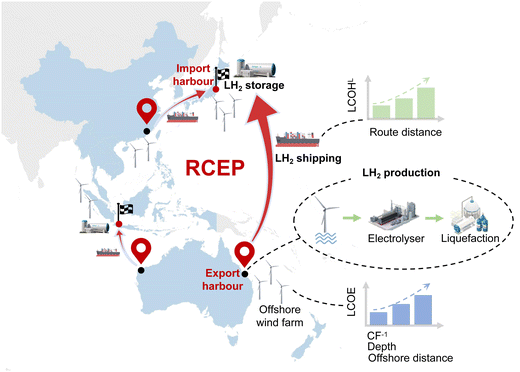
A schematic diagram of the OWH trading model in the RCEP members is described in Fig. 1. The export of OWH from Australia to Japan, which is currently in trial operation, is taken as an example.28,30 With abundant offshore wind resources and low hydrogen demand (see Section 3 for details), it is promising for Australia to participate in offshore wind development and OWH export. The offshore wind power is electrolysed to produce hydrogen at the nearest harbour and partly delivered and distributed locally through compressed pipelines and high-pressure tanks. Besides, after being liquefied and stored, OWH is exported to Japan on a hydrogen carrier, stored on-site, and consumed directly. Specifically, whether Australia exports OWH via this route and the related scale are affected by multiple factors. Firstly, the levelized cost of electricity (LCOE) of the offshore wind turbine is affected by the offshore distance, depth, and wind resources in the sea, which determines the LCOH of the exported OWH from the export harbour. Therefore, sea areas with shallow depths will be preferentially developed and further expanded to the deep sea.31 In the OWH transmission process, the distance of the route determines the differences in liquefied hydrogen storage capacity, transmission fuel consumption, etc., which can be further added to the levelized cost of landed hydrogen (LCOHL). In addition, the LCOH from onshore renewables at the export and import harbour and the LCOHL of other routes can also significantly affect the overall OWH transaction of the route. The definitions of LCOE, LCOH, and LCOHL are presented in the ESI.†2.2 Offshore wind filter
Following the study of Song et al.,22 the sea area suitable for the construction of offshore wind turbines in RCEP members was screened according to the following principles. Firstly, only locations in the Exclusive Economic Zone (EEZ) of the RCEP members were considered, obtained from Marine Regions.32 Secondly, an offshore depth of less than or equal to 60 m was adopted as another criterion, and the offshore depth data were obtained from the General Bathymetric Chart of the Oceans One Minute Grid.33 The reason for considering the above-mentioned principle is that the fixed-bottom offshore wind turbine is mature and has lower investment costs than the floating offshore wind turbine.34 Thirdly, we removed the areas from each grid cell (0.5° latitude by 0.625° longitude) for environments designated as protected areas, as indicated by the Marine Protected Areas in Protected Planet.35 Finally, 20% of the cell area was removed to guarantee the regular operation of international routes. The hourly CF data of offshore wind plants used were computed from www.renewables.ninja,36,37 with the assimilated wind speeds derived from NASA's MERRA-2.38 The MHI Vestas Offshore Wind's V164-8.0 MW turbine, a typical system used currently for offshore applications with a turbine tower height equal to 100 m, was selected.22 The spacing appropriate to minimise turbine–turbine interference for a single offshore wind turbine was suggested to be 7 × 7 rotor diameters (1.04 km2) by Musial et al.39 The ratio of the size of a single grid cell area after screening to the spacing of a single offshore wind turbine is equal to the number of offshore wind turbines suitable for installation.2.3 Harbour and route selection
The existing liquefied natural gas export and import harbours with safe conditions for navigation and berthing were obtained from the 2021 GIIGNL Annual Report,40 forming the basis of liquid hydrogen trade. Then, combined with the distribution of offshore wind plants in RCEP members, harbours suitable for hydrogen trade were identified. For instance, the Donghae and Gunsan harbours were chosen for the east and west marine areas, respectively, in the Republic of Korea to satisfy the national hydrogen trade demand. A total of 41 harbours were selected, and Table S1 (ESI†) presents their specific names, longitudes, and latitudes. The route distance between two harbours was calculated based on www.shipxy.com41 (see Table S3, ESI†) and applied in the subsequent optimisation model to calculate the hydrogen storage capacity, annual trade volume, required ship number, shipping fuel, and shipping loss. The above-mentioned parameters determined the landed cost to the import harbour in combination with the LCOH of the export harbour, and the Supplementary Text shows the specific calculation process (ESI†).2.4 Hydrogen demand prediction
From the perspective of global carbon reduction, the Hydrogen Council1 predicted that hydrogen can realise energy substitution of 20–25% in the transportation sector, 10% in the heat and power jointly required by global households and industry, 30% in methanol production, and 10% in steel production. As the forerunner of hydrogen exploitation, the Institute of Energy Economics in Japan conducted further estimation of the hydrogen substitution potential of different fossil fuels in different industrial sub-sectors in 2050.42 The above-mentioned research provides a reference for our hydrogen prediction. The substitution ratios of hydrogen in all sectors are specified in Fig. S2 (ESI†). The Asia Pacific Energy Research Centre43,44 analysed the prospect of hydrogen in the Asia Pacific region, and the predicted energy composition of different sectors in different countries in 2050 provided the demand data. Based on this information, we forecast the 2050 hydrogen demand of each member in the RCEP, as presented in Table S4 (ESI†). The prediction model is shown in the Supplementary Text of the ESI.† Given that the Lao People's Democratic Republic has no marine area, its hydrogen demand was merged with that of its bordering country, Viet Nam, which possesses rich offshore hydrogen resources. Furthermore, according to the 2020 GDP of each administrative division in each country, the national hydrogen demand was allocated to each harbour proportionally to the GDPs of certain administrative divisions. As for China, only demand of eastern coastal provinces is considered in this model. The hydrogen demand of each harbour is shown in Table S1 (ESI†). Considering the uncertainty of future forecasted hydrogen demand and its supply ratio by renewables of 20%, 50%, and 80% in 2030, 2040, and 2050, respectively,45 we conducted the sensitivity analysis on the base case of 2050.2.5 Electricity demand and tariff collection
The hourly electricity demand of countries around the world from 2030 to 2050 was obtained from Toktarova et al. using multiple linear regression in terms of spectral analysis.46 The electricity demand of the Lao People's Democratic Republic is neglected, given that as a landlocked country, it has no offshore wind resources available for local grid connection. The conversion ratios for electricity load used to consume offshore wind power were obtained from the ratios of predicted offshore wind power to the total power generation based on the International Energy Agency (IEA)47 to calculate the electricity demand satisfied by offshore wind plants. Furthermore, according to the 2020 GDP of each administrative division in each country, the national electricity demand was allocated to each harbour proportionally to the GDPs of certain administrative divisions. As for China, offshore wind power is mainly consumed by the eastern coastal provinces, where the total offshore electricity demand is allocated to each province according to the sum of the 2020 GDP in coastal provinces. The feed-in tariff for on-grid offshore wind power is calculated to be half of the grid electricity price.20 Considering the increase in power grid reliability investment, the grid electricity price of RCEP members is set to be increased by 5%, 15%, and 25% in 2030, 2040, and 2050, respectively,48 compared with the current electricity tariff, which is obtained from www.cable.co.uk.49 The detailed data for the feed-in tariff, electricity demand satisfied by offshore wind plants and the conversion ratios for electricity load used to consume offshore wind power in 41 harbours are presented in Table S2 (ESI†).2.6 Optimisation model
(1) Objective function.From the perspective of the overall optimisation of RCEP members, the objective function consists of the investment and operation cost, as well as the revenue from grid connection to reflect the grid-connected ability of offshore wind power economically, which is expressed as follows:
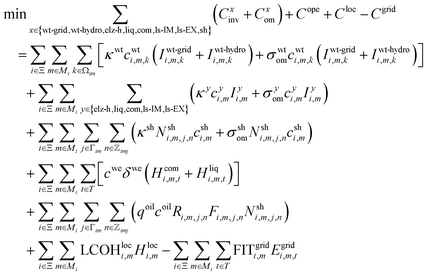 | (1) |
The relationship between offshore wind turbine investment and distance from the shore (S) and water depth (d)15 is described as follows:
| cwtk = cwt0·(0.0084dk + 0.8368)·(0.0057Sk + 0.7714) | (2) |
(2) Constraints
(1) Equipment operation constraint
a. Installed capacity constraint of offshore wind turbine
 | (3) |
b. Input power constraint of the water electrolyser-hydrogen
 | (4) |
c. Input hydrogen constraint of liquefaction and compression equipment
 | (5) |
d. Operational capacity constraint of hydrogen ship
 | (6) |
(2) Hourly power balances
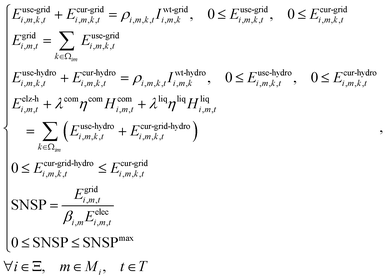 | (7) |
(3) Hydrogen storage equipment constraints of import and export harbours, including hydrogen storage constraint, charging and discharging balance constraint, and imported and exported OWH balance. The specific charging and discharging mechanism is presented in Fig. S1 (ESI†).
a. Liquefied hydrogen storage constraint of import and export harbours
 | (8) |
b. Charging and discharging balance constraint
For imported liquefied hydrogen storage:
 | (9) |
For exported liquefied hydrogen storage:
 | (10) |
c. Imported and exported OWH balances
 | (11) |
 | (12) |
(4) Hydrogen balances of harbours
 | (13) |
(5) Hydrogen balances of electrolyser-hydrogen in harbours
 | (14) |
(6) Loss-considered transportation balance of trading routes
 | (15) |
(7) Onshore renewable hydrogen production constraint
 | (16) |
Additionally, the interest rate is assumed to be 7%. The hydrogen trade chain model is presented in Fig. S1 (ESI†). The techno-economic data of different equipment in the hydrogen trade chain are collected in Tables S5–S7 (ESI†). The cost calculation process of LCOE, LCOH, LCOHL, and LCOHU is described in the Supplementary Text (ESI†).
3 Results
3.1 Abundant OWH resources with a hundred-fold cost gap occur in RCEP members
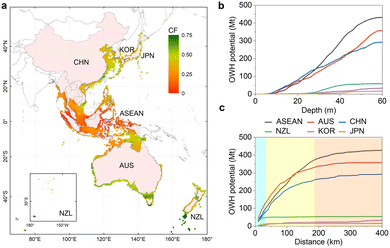
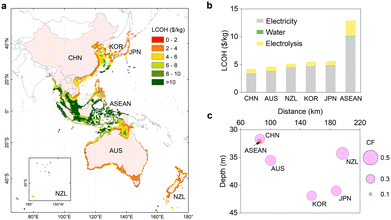
Fig. 2 shows the spatial distribution of the hourly mean values of the CF and OWH production potentials at different offshore distances and depths for the RCEP members. From a global perspective, the CFs of offshore wind in the RCEP region have significant regional differences, where the CFs are the lowest near the equator and increase with north-south extension. The highest CF is in southern New Zealand, and the lowest is in Indonesia. Combined with the offshore wind filter and CFs, Fig. 2b and c show the changes in OWH potential with depths and offshore distances, respectively. Supposing the above-mentioned installable areas are equipped with offshore wind turbines (MHI Vestas Offshore Wind's V164-8.0 MW turbine), the annual OWH production potential of all RCEP members can reach approximately 1200 megatons (Mt), which is 13 times the current global hydrogen demand of 90 Mt.50 ASEAN, Australia, and China have the top three annual OWH production potentials, reaching 431.6, 357.3, and 292.1 Mt, respectively, accounting for more than 90% of the total for all RCEP members. Among the ASEAN countries, Indonesia, Viet Nam, and Thailand have the top three annual OWH production potentials, reaching 223.0, 95.9, and 32.1 Mt, respectively, as shown in Fig. S3 of the ESI.† We further focus on the annual OWH potential of the coastal sea (0–20 nautical miles), considering the ease of exploitation along the coast with a relatively lower hydrogen production cost. Similarly, Australia has the highest annual OWH production potential from coastal offshore wind, with a value of about 150 Mt, followed by ASEAN (about 120 Mt), China (about 90 Mt), and New Zealand (about 50 Mt). The annual OWH production potential of coastal offshore wind in the above-mentioned members exceeds 400 Mt, which is close to the 2050 global renewable hydrogen supply predicted by the Hydrogen Council in collaboration with McKinsey & Company.45The LCOE of offshore wind plants is affected by offshore distance, depth, and mean CF, leading to different LCOHs. Fig. 3a shows the spatial distribution of LCOH under the installable areas of RCEP members in 2050. After considering the offshore distance and depth, the difference in the LCOH of OWH among RCEP members is further widened. The highest LCOH is in Indonesia, at 169.06 $ per kg, while Australia has the least expensive LCOH of 1.61 $ per kg, reflecting a one hundredfold cost gap. As shown in Fig. 3a, Australia, China, New Zealand, Japan, and the Republic of Korea have some areas with LCOHs less than 4 $ per kg, and even a few areas with LCOHs less than 2 $ per kg. While the countries of ASEAN have a total OWH potential of 431.6 Mt, their mean LCOH of OWH is more than 10 $ per kg, and thus the space for OWH exploitation is minimal. In ASEAN, the best areas for development are Viet Nam, the Philippines, and the Indonesian island of Indonesia. The spatial distribution of the LCOH from offshore wind within RCEP members in 2030 and 2040 is presented in Fig. S4 of the ESI.†
Fig. 3b and c show the composition and determinants of the mean LCOH in China, Japan, the Republic of Korea, Australia, New Zealand, and ASEAN, respectively. The cost of electricity accounts for more than 80% of the LCOH among the RCEP members, followed by the electrolyser investment. Because of the best offshore wind turbine installable conditions in terms of distance and depth, China has the lowest mean LCOH, reaching 4.19 $ per kg, followed by Australia, with a mean LCOH of 4.65 $ per kg due to its comprehensive performance in CF, distance, and depth. Although New Zealand has the highest CF among the RCEP members, the average offshore distance ranks first with a value of more than 180 km, making its mean LCOH break the level of 5 $ per kg. The similar CF, offshore distance, and depth bring the Republic of Korea and Japan a mean LCOH of 5.52 and 5.65 $ per kg, respectively, where both have a particular gap compared to the onshore renewable hydrogen in their 2050 target.29 Due to the lowest offshore wind CF, the mean LCOH of ASEAN reaches about 13 $ per kg, which is 3 times that of China. The OWH potential among the RCEP members that can offer a price range of 0–10 $ per kg is detailed in Fig. S5 of the ESI.† The above-mentioned results show that although the RCEP members have great OWH production potential, their different offshore distances, depths, and CFs lead to vast differences in the LCOH of the OWH among RCEP members.
3.2 OWH faces enormous pressure from land
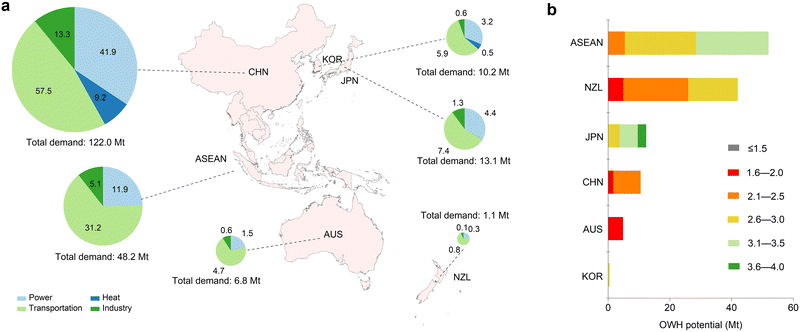
In this section, we consider the OWH performance from the bottom up, taking into account terminal hydrogen applications. A hydrogen demand forecast model is established to calculate the hydrogen demand of RCEP members in 2050. This model includes more than ten sub-sectors, such as power generation, building heat, industrial heat, diversified transportation, and industrial applications, as predicted in “2.4 Hydrogen demand prediction”. As shown in Fig. 4a, the forecasted hydrogen demand of China reaches 122.0 Mt, accounting for more than 60% of all members’ total hydrogen demand of 201.4 Mt. The forecasted hydrogen demands of ASEAN, Japan, the Republic of Korea, Australia, and New Zealand are 48.2, 13.1, 10.2, 6.8, and 1.1 Mt, respectively. Specific to related sectors, transportation consumes the most significant volume of hydrogen, with a total demand of 107.5 Mt, accounting for more than 50% of all RCEP members’ demands, except China. As the second-largest consumption sector, the total forecasted hydrogen demand for power generation is 63.2 Mt, supporting the operation of the future power system as dispatchable power. The forecasted hydrogen demands for industry and heating are 21 and 9.7 Mt, respectively.From the perspective of each RCEP member, we further analyse the cost-competitive offshore hydrogen production compared with onshore renewable hydrogen. Fig. 4b shows the cost-competitive OWH potentials of RCEP members in 2050. According to the IEA forecast, the LCOHs from onshore renewables in the long term in Australia, China, the Republic of Korea, New Zealand, ASEAN, and Japan are approximately 2, 2.5, 3, 3, 3.5, and 4 $ per kg, respectively.29 Taking this cost level as a reference, the OWH production potential of RCEP members drops to 122.1 Mt, satisfying a share of 85% for the forecasted hydrogen demand of China's coastal provinces and other RCEP members. According to Fig. 4b, New Zealand and ASEAN can be self-sufficient using their own OWH, and Australia and Japan can also use their OWH to satisfy most of the demand. For example, Japan can produce 3.6, 5.9, and 2.7 Mt of hydrogen in the cost range of 2.5–3.0 $ per kg, 3.1–3.5 $ per kg, and 3.6–4.0 $ per kg, respectively. This may seem at odds with the fact that Japan nowadays imports hydrogen from countries such as Australia, but the real reason is that Japan can import hydrogen from other countries at a lower price than its onshore hydrogen, which eases the pace of developing its expensive onshore and offshore hydrogen production. In addition, Japan's hydrogen target of 2 $ per kg in 205022 also makes its OWH production face a considerable challenge. The situation in ASEAN is similar to that of Japan. With an LCOH of 3.5 $ per kg from onshore renewables, the cost-competitive OWH can reach 51.9 Mt; however, only 5.4 Mt of OWH costs less than 2.5 $ per kg and cannot satisfy the forecasted hydrogen demand. In contrast, New Zealand can provide the most OWH volume at an LCOH below 2 $ per kg, reaching 4.9 Mt, which can effectively meet its local hydrogen demand, while exporting to other RCEP members. An LCOH of 2.5 $ per kg from onshore renewables in China makes its OWH 10.5 Mt, which is far below its total OWH production potential and only 16% of the eastern coastal provinces with a forecasted demand of 65 Mt. Under the same calculation, an LCOH of 3 $ per kg from onshore renewables in the Republic of Korea makes its cost-competitive OWH production potential only 0.5 Mt, which cannot meet its hydrogen demand.
3.3 Co-development of OWH facilitates the RCEP hydrogen economy
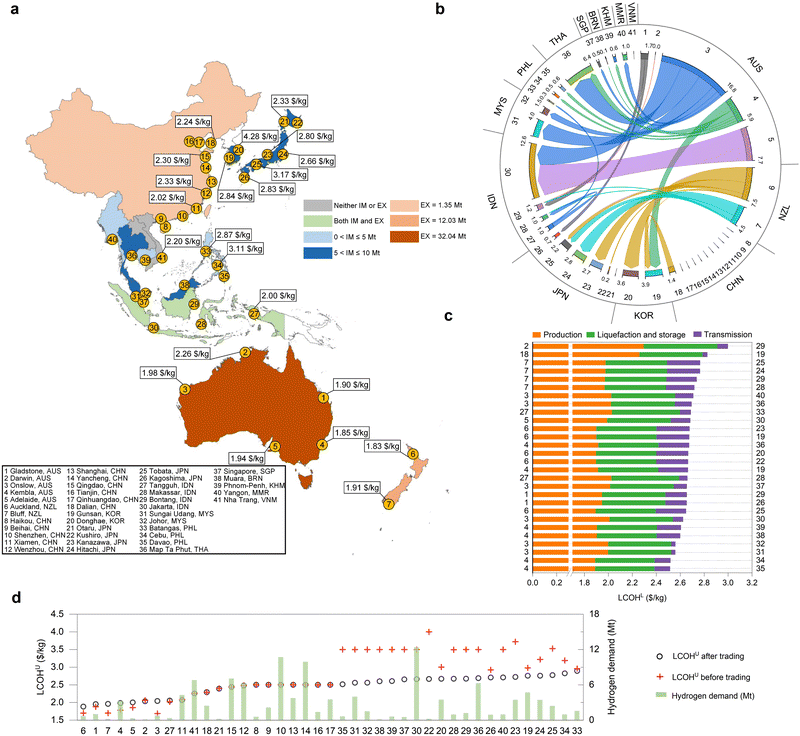
We further develop an optimisation model to explore the feasibility of the co-development of OWH in RCEP members in 2050, as shown in Table 1 and Fig. 5. Based on the cost competitiveness of onshore renewable hydrogen, co-development of OWH among RCEP members can lead to more than 1600 GW of offshore wind installation, accounting for 6% of the installable area. To effectively produce hydrogen from the above-mentioned offshore wind resources, a capacity of 495.84 GW of electrolysers is required to achieve an annual hydrogen production potential of 73.43 Mt, accounting for more than 50% of the forecasted hydrogen demand of 144.1 Mt (excluding the non-eastern coastal areas of China from the total hydrogen demand). The annual exported volume of OWH by the co-development model among RCEP members reaches 46.43 Mt, accounting for 63% of the annual hydrogen produced from offshore wind, realising the complementarity of hydrogen supply and demand among RCEP members. Australia, New Zealand, and China are pure exporters. Specifically, the annual exported volume of OWH in Australia reaches 32.04 Mt, which will be exported to Japan, the Republic of Korea, Indonesia, Thailand, and other ASEAN countries (see Fig. 5b). The largest export harbour is Onslow in Australia, with an annual exported volume of 16.79 Mt. New Zealand ranks second, with an annual exported volume of 12.03 Mt to Japan, the Republic of Korea, and Indonesia. China has only one harbour in Dalian to export OWH, with an annual exported volume of 1.35 Mt. The Republic of Korea, Japan, and ASEAN are pure importing members (with 2 routes for trade among different harbours in ASEAN), with annual imported OWH quantities of 7.28, 8.37, and 29.70 Mt, respectively. The Republic of Korea imports mainly from Australia, New Zealand, and China, while Japan and ASEAN mainly import OWH from New Zealand and Australia, respectively. Fig. 5c shows the LCOHL components of the total 28 routes considering shipping loss. Firstly, the shipping-loss considered LCOH at different export harbours varies significantly, ranging from 1.89 $ per kg (Kembla in Australia) to 2.30 $ per kg (Darwin in Australia). Then, approximately 0.5 $ per kg of liquefaction and storage cost is added to the LCOH of the export harbour. Finally, the different shipping distances lead to different fuel consumption and evaporation losses, resulting in the different shipping costs of OWH. The highest shipping cost is added to the route of Auckland in New Zealand to Kanazawa in Japan, reaching 0.28 $ per kg, with a route length of about 10![[thin space (1/6-em)]](https://www.rsc.org/images/entities/char_2009.gif) 000 km. Simultaneously, the lowest shipping cost is added to the route of Onslow in Australia to Sungai Udang in Malaysia with a route length of 320.95 km, reaching only 0.03 $ per kg. For comparison, the shipping cost from Saudi Arabia to Japan is 0.6 $ per kg,21 further considering that the tariff will be more than twice the maximum shipping cost of OWH in RCEP members, highlighting the advantages of intra-trading within RCEP members. Fig. 5d further shows the levelized cost of used hydrogen (LCOHU) of each harbour before and after the trade, which is defined as a harbour's mean hydrogen supply cost; see ESI† for details. After trading, the minimum LCOHU value is 1.88 $ per kg in Auckland, New Zealand, and the maximum value is 2.89 $ per kg in Batangas, the Philippines. OWH trade can reduce the LCOHU in 24 out of 41 harbours, especially in the ASEAN countries. Given that the LCOH of the OWH in the ASEAN countries is higher than that of onshore renewable hydrogen with a value of 3.5 $ per kg, the hydrogen demand is met mainly by onshore renewable hydrogen before OWH trading. After considering cheap imports from Australia and New Zealand, all the harbours’ LCOHU in ASEAN can reach below 3.0 $ per kg. In addition, the average LCOHU in the RCEP members after co-development is 2.51 $ per kg. In comparison, the average LCOHU without OWH trading is 2.80 $ per kg with an increase of 0.29 $ per kg, leading to an extra expense of $33.3 billion.
000 km. Simultaneously, the lowest shipping cost is added to the route of Onslow in Australia to Sungai Udang in Malaysia with a route length of 320.95 km, reaching only 0.03 $ per kg. For comparison, the shipping cost from Saudi Arabia to Japan is 0.6 $ per kg,21 further considering that the tariff will be more than twice the maximum shipping cost of OWH in RCEP members, highlighting the advantages of intra-trading within RCEP members. Fig. 5d further shows the levelized cost of used hydrogen (LCOHU) of each harbour before and after the trade, which is defined as a harbour's mean hydrogen supply cost; see ESI† for details. After trading, the minimum LCOHU value is 1.88 $ per kg in Auckland, New Zealand, and the maximum value is 2.89 $ per kg in Batangas, the Philippines. OWH trade can reduce the LCOHU in 24 out of 41 harbours, especially in the ASEAN countries. Given that the LCOH of the OWH in the ASEAN countries is higher than that of onshore renewable hydrogen with a value of 3.5 $ per kg, the hydrogen demand is met mainly by onshore renewable hydrogen before OWH trading. After considering cheap imports from Australia and New Zealand, all the harbours’ LCOHU in ASEAN can reach below 3.0 $ per kg. In addition, the average LCOHU in the RCEP members after co-development is 2.51 $ per kg. In comparison, the average LCOHU without OWH trading is 2.80 $ per kg with an increase of 0.29 $ per kg, leading to an extra expense of $33.3 billion.
| RCEP member | Offshore capacity (GW) | Developed proportion (%) | OWH share of offshore wind generation (%) | Electrolyser capacity (GW) | OWH production (Mt) |
|---|---|---|---|---|---|
| CHN | 608.52 | 13.26 | 32.38 | 88.52 | 12.18 |
| AUS | 482.18 | 8.97 | 97.27 | 222.57 | 35.17 |
| ASEAN | 197.70 | 1.49 | 78.02 | 79.31 | 9.90 |
| NZL | 168.30 | 21.18 | 99.12 | 76.30 | 13.14 |
| JPN | 91.10 | 32.50 | 39.01 | 21.23 | 2.17 |
| KOR | 62.85 | 11.49 | 26.19 | 7.91 | 0.87 |
| Total | 1610.65 | 6.48 | 68.81 | 495.84 | 73.43 |
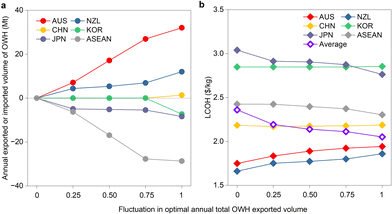
We use the centralised optimisation model to obtain the optimal result of the co-development of offshore wind plants and hydrogen production in RCEP. However, considering the potential conflicts of interests of various RCEP members, some barriers exist in the implementation of the OWH international trade. Here, we quantitatively analyse the import and export competitiveness of each member under the RCEP coordination framework by constraining the upper limit of potential OWH trading among the RCEP members, which is represented by the annual total exported volume. Fig. 6 shows the performance of each member's imported and exported volume and LCOH with 0, 0.25, 0.5, 0.75, and 1 times the optimal value of the annual total OWH exported volume in RCEP. From the perspective of export, Australia is undoubtedly the member with the strongest export ability of RCEP, which is not only reflected in its largest total export scale but also in the fact that it maintains the maximum exported volume in different trade constraints with a trade priority, followed by New Zealand. China only exports a little OWH in the basic case, and thus in terms of export performance, it is far behind the former two. From the perspective of import, the roles of ASEAN and Japan are similar to those of Australia and New Zealand. They both have an urgent need to import low-cost hydrogen, while the Republic of Korea only imports OWH in the basic case. Although the hydrogen demand of the Republic of Korea is close to that of Japan, its import priority is not as high as Japan. From the perspective of hydrogen production cost, the LCOHs of New Zealand and Australia increase with an increase in the annual total OWH export, which is attributed to the gradual extension of the offshore wind plant exploitation to the deep sea. ASEAN and Japan benefit the most from the access to importing more and more low-cost OWH with a reduction in their own developed marine areas and LCOHs subsequently in the centralised optimisation. The average LCOH in RCEP decreases with an increase in the annual total exported volume, reflecting the superiority of OWH trading among RCEP members.
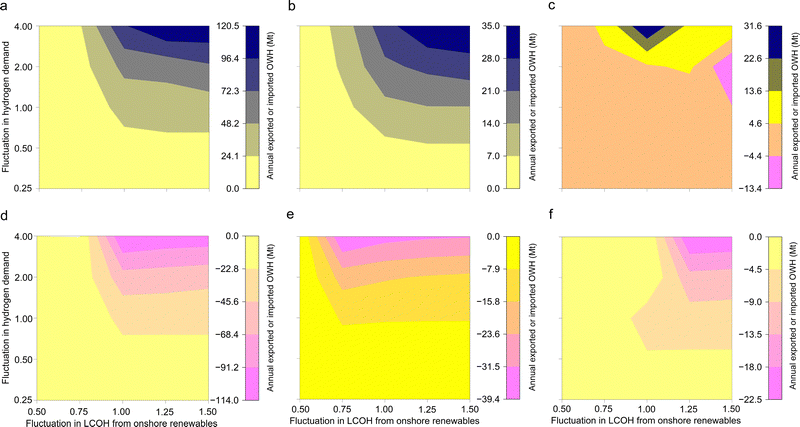
Considering that the LCOH from onshore renewables and forecasted hydrogen demands are two key factors affecting OWH exploitation, the impacts of ±50% fluctuations in the LCOH from onshore renewables in RCEP members and 0.25 to 4 times the hydrogen demand are further analysed, as shown in Fig. 7. Under the given parameter variation range, RCEP members can be divided into three categories, i.e., two pure exporting members of Australia and New Zealand, three pure importing members of ASEAN, Japan, and the Republic of Korea, and one member of China whose import and export roles can change. Specifically, with an increase in the cost of onshore renewable hydrogen production and hydrogen demand, the annual exports of OWH from Australia and New Zealand gradually increase. At 1.5 times the LCOH from onshore renewables and 4 times the hydrogen demand, the annual OWH exports of these two members reach the peak of 120 and 35 Mt, respectively, mainly due to their lower OWH cost and hydrogen demand compared to the other members. The increase in the LCOH from onshore renewables and hydrogen demand has a similar impact on the annual hydrogen imports of two pure importing members, ASEAN and the Republic of Korea. At 1.5 times the LCOH from onshore renewables and 4 times the hydrogen demand, the annual OWH imported volume of ASEAN and the Republic of Korea reaches 114 and 22 Mt, respectively. Moreover, compared with the hydrogen demand, the fluctuation in the LCOH from onshore renewables significantly impacts the imported volume. Unlike the above-mentioned two pure importing members, Japan achieves the highest OWH imported volume of 39 Mt at 0.75 times the LCOH from onshore renewables and 4 times the hydrogen demand. Finally, China has become the member most affected by the changes in the above-mentioned two parameters. Its annual OWH imported volume peaks at 13 Mt under 2 times hydrogen demand and 1.5 times the LCOH from onshore renewables. However, at 4 times the hydrogen demand and primary LCOH from onshore renewables, China's annual OWH exports reach 32 Mt, which is nearly 3 times the peak imported volume. China's import and export complexity is mainly due to its relatively close onshore and offshore renewable hydrogen production costs. Due to the enormous hydrogen demand and OWH supply capacity, its hydrogen balance is very vulnerable to other regions in the RCEP.
Considering that the feed-in tariff for on-grid power directly determines the on-grid capacity and the subsequent OWH development, the impact of the fluctuation of ±50% in the feed-in tariff on the on-grid and OWH share of offshore wind generation, the total amount of installed offshore capacity, and LCOHU are discussed, as shown in Fig. 8. From 0.5 to 1.5 times of the basic feed-in tariff, the total installed offshore capacity rises from 1268.63 GW to 1911.70 GW. Among them, the on-grid share of offshore wind generation gradually increases, accounting for nearly 40% under the 1.5 times basic tariff. In addition, fluctuations in feed-in tariff lead to an increase of 0.07 $ per kg in the average LCOHU. Therefore, from the perspective of co-development optimisation of the RCEP, the factor of the feed-in tariff has little impact on OWH development in RCEP. The fluctuation in the feed-in tariff leads to a large increase in developed offshore wind capacity, but due to the rich cost-competitive offshore wind resources in RCEP, the impact on the subsequent hydrogen production is relatively small, with an addition of less than 0.1 $ per kg in LCOHU.
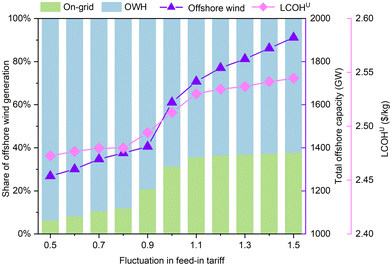 | ||
| Fig. 8 Impacts of fluctuations in feed-in tariff on the offshore wind and OWH exploitation of RCEP members. | ||
3.4 Pathway to hydrogen economy in RCEP members
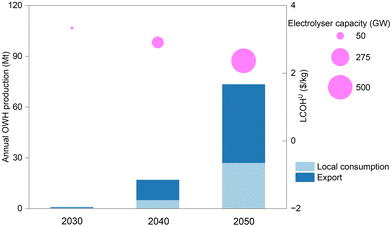
Fig. 9 shows the development of OWH in different scenarios from 2030 to 2050. In each scenario, OWH's entire supply chain parameters, including production, transmission, storage, and utilisation, have been sorted based on existing materials (see ESI† for details). As seen in Fig. 9, the annual OWH exploitation in 2030 is minimal, with a value of 0.95 Mt, of which 0.51 Mt is exported. Due to the expensive investment cost of wind turbines and electrolysers, combined with the high LCOH from onshore renewables, LCOHU is as high as 3.51 $ per kg. In 2040, OWH will be developed on a particular scale of 17.01 Mt with an electrolyser configuration capacity of 117 GW, of which the exported volume will account for more than 70%, and the LCOHU in this scenario will drop to 3.07 $ per kg. In 2050, OWH will be developed on a large scale, the annual OWH production will increase by over 4 times compared with 2040, the exported volume among RCEP members will reach 46.43 Mt, and the total LCOHU will drop to 2.51 $ per kg. In general, the development of related technologies and the terminal hydrogen demand determine that the development of OWH will be a gradual process.3.5 Sensitivity analysis of key economic parameters
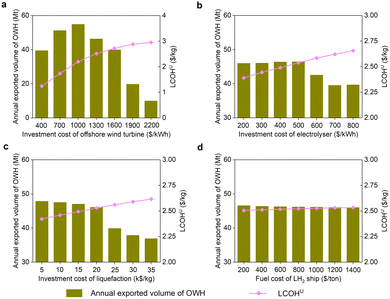
Considering the high uncertainty and significant influence of offshore wind power investment cost, electrolyser investment cost, liquefaction investment cost, and fuel cost, the impact of the above-mentioned parameters on RCEP OWH trading and LCOHU is further analysed in Fig. 10. It can be found that the offshore wind turbine investment cost has the most significant impact on the OWH production cost and its trading among RCEP members. As the offshore wind turbine investment cost changes from 400 $ per kWh to 2200 $ per kWh, the LCOHU of RCEP is nearly trebled from 1.24 $ per kg to 2.95 $ per kg. However, the annual OWH trading first increases, and then decreases with an increase in the offshore wind turbine investment cost, reaching a peak of 54.95 Mt at 1000 $ per kWh. This is attributed to the fact that the low and high offshore wind turbine investment cost increases the share of local-used OWH and onshore renewable hydrogen supply, respectively, thereby reducing the dividend space of RCEP members’ trade. The influence trend of electrolyser investment cost on LCOHU and trading of OWH is the same as that of wind turbine investment cost, but its influence is much weaker than the latter. The increase in liquefaction and fuel costs will be superimposed on the LCOHL in the import harbour, resulting in an increase in LCOHU and a decrease in the annual OWH trading of RCEP members. Besides, liquefaction investment costs have a more significant impact than fuel costs with a gentle change.The economic comparison of liquid hydrogen, ammonia, and methylcyclohexane (MCH) transmission in scenario 2050 is further presented in Fig. 11. The relevant technical and economic parameters are shown in Tables S5–S7 of the ESI.† It can be seen that ammonia, as the transmission medium, is the most economical among the three. Under an LCOHL of 2.70 $ per kg, the annual OWH exported volume of RCEP is 46.81 Mt. As a comparison, the annual OWH exported volume of RCEP when using liquid hydrogen and MCH is 46.43 and 37.87 Mt, with an LCOHL of 2.88 and 2.97 $ per kg, respectively. In addition, the LCOHL composition of the above-mentioned three transmission mediums is different. The production cost of liquid hydrogen is the lowest. However, the total cost after adding the liquefaction cost is significantly higher than that of ammonia, and its transmission cost is significantly higher than the latter two. Considering the potential technological development of liquid hydrogen, we set the liquid hydrogen cost under an optimistic scenario with a 50% reduction in the liquefaction and transmission investment costs. It can be found that the LCOHL in this scenario is lower than that in the ammonia transmission scenario, and the annual exported volume of OWH reaches 47.7 Mt. Regardless of which transmission medium dominates in the future, it can effectively promote the OWH economy. Consequently, using offshore wind to produce hydrogen is another good option. This study explores a new offshore wind application mode apart from grid-connected generation.
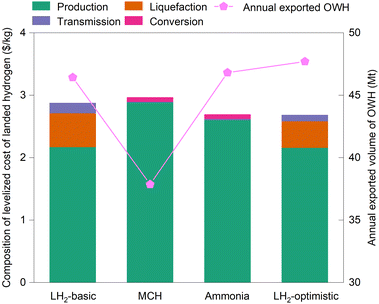 | ||
| Fig. 11 Comparison of average LCOHL and annual exported volume of OWH via liquid hydrogen, methylcyclohexane (MCH), and ammonia shipping in 2050. | ||
4 Conclusions
Hydrogen is expected to be an essential part of the global energy trading. Here, we explore the feasibility of the hydrogen economy driven by offshore wind for RCEP members. The results reveal significant differences and complementarities in offshore wind resources and hydrogen demand potential among RCEP members. Australia and New Zealand, with low hydrogen demand and high cost-competitive OWH production potential, will export OWH to ASEAN, the Republic of Korea, and Japan on a large scale. ASEAN benefits most from the co-development of the hydrogen economy driven by offshore wind among RCEP members. Under the influence of the high LCOH of OWH production caused by the low wind resources, ASEAN imports abundant OWH from Australia, effectively reducing the LCOHU and promoting the hydrogen economy in ASEAN. China's exported volume of OWH is low due to its abundant onshore hydrogen production from renewable sources, resulting in relatively low OWH exploitation for OWH trading. Additionally, China is the most sensitive to the fluctuations in LCOH from onshore renewables and hydrogen demand with a role transitioning between an importing and exporting member because of its great demand and rich OWH sources. Further analysis from 2030 to 2050 in the OWH economy pathway and sensitivity validation were discussed to analyse the progressive development considering the high levels of uncertainty in key parameters. The overall analysis verified the broad application prospects and huge potentials of OWH trading to boost the hydrogen economy and deepen the cooperation in offshore wind exploitation of RCEP.OWH is classified as green hydrogen, which contributes to decarbonisation. From a production perspective, currently, hydrogen is mainly obtained from coal or natural gas as “grey hydrogen”.51 Under the global annual demand of 90 Mt hydrogen, carbon emissions will reach 900 Mt, accounting for 2.5% of the global emissions in energy and industry.50 By contrast, under the co-development optimisation in RCEP members, the cost-competitive green hydrogen production from offshore wind can reach 73 Mt, helping to remove 730 Mt carbon emissions under the current technology. If this type of green hydrogen can supersede oil, coal, and natural gas in the terminal application field, carbon reduction will become more promising.
Despite these findings, several limitations should be acknowledged. Firstly, with an increase in the distance from the shore and water depth, the investment cost of offshore wind turbines increases sharply, making most countries of the RCEP unable to produce low-cost OWH. However, in the future, with the advancement of submarine power transmission technology and floating offshore wind turbine technology, the potential of hydrogen production, including the resources in marine areas with water depths above 60 m,31 will be enhanced, and the cost of hydrogen production will be further reduced.52 Secondly, more precise data, combined with a clearer vision of future hydrogen energy popularisation and substitution ratio, are expected to lead to more accurate predictions of hydrogen demand, which may also impact the research results. Finally, although we considered the different characteristics of different RCEP members such as feed-in tariff, electricity demand, and hydrogen demand in the RCEP co-development optimisation model, it is difficult to catch potentially conflicting objectives of members/stakeholders. For example, Australia is committed to playing the role of a major exporter of hydrogen trading in the future.53 Japan, limited by its scant renewable resources and high energy prices, attaches great importance to research and development for the utilisation of hydrogen technology.54 The appeal of the above-mentioned two countries is consistent with the goal of the optimisation model. However, in ASEAN, hydrogen has not yet been effectively regarded as a major component of the future low-carbon energy system, except Singapore has issued the National Hydrogen Strategy at present.55,56 As a result, the development of hydrogen in ASEAN is uncertain. Our research showed that offshore wind resources in ASEAN are scarce, resulting in little cost-competitive OWH. Thus, it is necessary to import 28.3 Mt OWH with an average LCOHL of 2.64 $ per kg from Australia based on ASEAN's hydrogen demand of 38.5 Mt from renewables in 2050 and the expensive LCOH from onshore renewables of 3.5 $ per kg. Therefore, the above-mentioned characteristics of ASEAN increase the uncertainty of the co-development of OWH in RCEP. Besides, in Section 3.3, the fluctuations in hydrogen demand and LCOH from onshore renewables reflect the differences in the enthusiasm of RCEP members to participate in OWH development as much as possible. Furthermore, in terms of the barriers from the conflicting interests of different RCEP members, we limit the annual total exported volume to analyse the trading competitiveness among different OWH developers in the gradual opening of OWH international trading.
Author contributions
Conceptualisation: G. P. and W. Z., data curation: W. Z. and G. P., methodology: W. Z., G. P., and W. G., investigation: W. Z., G. P., and Z. G., visualisation: W. Z. and G. P., supervision: W. G., S. Z., Q. H., Z. W., S. L., and H. Q., writing – original draft: all the authors, writing – revised draft: all the authors. W. Z. and G. P. contributed equally.Conflicts of interest
There are no conflicts to declare.Acknowledgements
We acknowledge the support from the National Key Research and Development Program of China (2020YFE0200400), the National Natural Science Foundation of China (U1866208), the Postdoctoral Innovation Talents Support Program (BX20220066), and the Jiangsu Funding Program for Excellent Postdoctoral Talent (2022ZB81). We thank the Big Data Computing Centre of Southeast University for providing the facility support on the numerical calculations in this paper.Notes and references
- Hydrogen Council, Hydrogen scaling up, https://hydrogencouncil.com/wp-content/uploads/2017/11/Hydrogen-Scaling-up_Hydrogen-Council_2017.compressed.pdf, (accessed 5 July 2022).
- C. Bauer, T. Heck, S. Schneider, H. Sanjaykumar, T. Terlouw, K. Treyer and X. Zhang. Electricity storage and hydrogen: Technologies, costs and environmental burdens, PSI, Paul Scherrer Institut technical report, 2021 Search PubMed.
- G. Palmer, A. Roberts, A. Hoadley, R. Dargaville and D. Honnery, Life-cycle greenhouse gas emissions and net energy assessment of large-scale hydrogen production via electrolysis and solar PV, Energy Environ. Sci., 2021, 14, 5113–5131 RSC.
- L. Van Hoecke, L. Laffineur, R. Campe, P. Perreault, S. W. Verbruggen and S. Lenaerts, Challenges in the use of hydrogen for maritime applications, Energy Environ. Sci., 2021, 14, 815–843 RSC.
- B. Parkinson, P. Balcombe, J. F. Speirs, A. D. Hawkes and K. Hellgardt, Levelized cost of CO2 mitigation from hydrogen production routes, Energy Environ. Sci., 2019, 12, 19–40 RSC.
- S. Z. Al Ghafri, S. Munro, U. Cardella, T. Funke, W. Notardonato, J. P. M. Trusler, J. Leachman, R. Span, S. Kamiya, G. Pearce, A. Swanger, E. D. Rodriguez, P. Bajada, F. Jiao, K. Peng, A. Siahvashi, M. L. Johns and E. F. May, Hydrogen liquefaction: a review of the fundamental physics, engineering practice and future opportunities, Energy Environ. Sci., 2022, 15, 2690–2731 RSC.
- T. M. Gür, Review of electrical energy storage technologies, materials and systems: challenges and prospects for large-scale grid storage, Energy Environ. Sci., 2018, 11, 2696–2767 RSC.
- N. A. Sepulveda, J. D. Jenkins, A. Edington, D. S. Mallapragada and R. K. Lester, The design space for long-duration energy storage in decarbonized power systems, Nat. Energy, 2021, 6, 506–516 CrossRef.
- E. M. Yedinak, The curious case of geologic hydrogen: Assessing its potential as a near-term clean energy source, Joule, 2022, 6, 503–508 CrossRef.
- M. van der Spek, C. Banet, C. Bauer, P. Gabrielli, W. Goldthorpe, M. Mazzotti, S. T. Munkejord, N. A. Røkke, N. Shah, N. Sunny, D. Sutter, J. M. Trusler and M. Gazzani, Perspective on the hydrogen economy as a pathway to reach net-zero CO2 emissions in Europe, Energy Environ. Sci., 2022, 15, 1034–1077 RSC.
- G. Pan, W. Gu, Q. Hu, J. Wang, F. Teng and G. Strbac, Cost and low-carbon competitiveness of electrolytic hydrogen in China, Energy Environ. Sci., 2021, 14, 4868–4881 RSC.
- O. J. Guerra, J. Eichman, J. Kurtz and B. Hodge, Cost competitiveness of electrolytic hydrogen, Joule, 2019, 3, 2425–2443 CrossRef.
- G. Glenk and S. Reichelstein, Economics of converting renewable power to hydrogen, Nat. Energy, 2019, 4, 216–222 CrossRef CAS.
- N. Mac Dowell, N. Sunny, N. Brandon, H. Herzog, A. Y. Ku, W. Maas, A. Ramirez, D. M. Reiner, G. N. Sant and N. Shah, The hydrogen economy: a pragmatic path forward, Joule, 2021, 5, 2524–2529 CrossRef CAS.
- P. Sherman, X. Chen and M. McElroy, Offshore wind: An opportunity for cost-competitive decarbonization of China's energy economy, Sci. Adv., 2020, 6, x9571 CrossRef PubMed.
- International Renewable Energy Agency (IRENA), Renewable energy statistics 2021, https://irena.org/-/media/Files/IRENA/Agency/Publication/2021/Aug/IRENA_Renewable_Energy_Statistics_2021.pdf, (accessed 5 July 2022).
- M. Jansen, I. Staffell, L. Kitzing, S. Quoilin, E. Wiggelinkhuizen, B. Bulder, I. Riepin and F. Müsgens, Offshore wind competitiveness in mature markets without subsidy, Nat. Energy, 2020, 5, 614–622 CrossRef.
- International Renewable Energy Agency (IRENA), World energy transitions outlook: 1.5 °C pathway, https://www.irena.org/-/media/Files/IRENA/Agency/Publication/2021/Jun/IRENA_World_Energy_Transitions_Outlook_2021.pdf, (accessed 5 July 2022).
- E. V. Mc Garrigle, J. P. Deane and P. G. Leahy, How much wind energy will be curtailed on the 2020 Irish power system?, Renew. Energy, 2013, 55, 544–553 CrossRef.
- T. Terlouw, C. Bauer, R. McKenna and M. Mazzotti, Large-scale hydrogen production via water electrolysis: a techno-economic and environmental assessment, Energy Environ. Sci., 2022, 15, 3583–3602 RSC.
- Hydrogen Council, Path to hydrogen competitiveness: A cost perspective, https://hydrogencouncil.com/wp-content/uploads/2020/01/Path-to-Hydrogen-Competitiveness_Full-Study-1.pdf, (accessed 5 July 2022).
- S. Song, H. Lin, P. Sherman, X. Yang, C. P. Nielsen, X. Chen and M. B. McElroy, Production of hydrogen from offshore wind in China and cost-competitive supply to Japan, Nat. Commun., 2021, 12, 6953 CrossRef CAS PubMed.
- D. Milani, A. Kiani and R. McNaughton, Renewable-powered hydrogen economy from Australia's perspective, Int. J. Hydrogen Energy, 2020, 45, 24125–24145 CrossRef CAS.
- Global Wind Energy Council, Global offshore wind report 2021, https://www.indiaenvironmentportal.org.in/files/file/Global%20Offshore%20Wind%20Report%202021.pdf, (accessed 5 July 2022).
- S. McDonagh, S. Ahmed, C. Desmond and J. D. Murphy, Hydrogen from offshore wind: Investor perspective on the profitability of a hybrid system including for curtailment, Appl. Energy, 2020, 265, 114732 CrossRef.
- SSTV, RCEP Think Tank Network Provides Intellectual Support for Sharing Dividends, https://www.hicn.cn/system/2022/09/25/032840345.shtml, (accessed 11 November 2022).
- K. Tian, Y. Zhang, Y. Li, X. Ming, S. Jiang, H. Duan, C. Yang and S. Wang, Regional trade agreement burdens global carbon emissions mitigation, Nat. Commun., 2022, 13, 408 CrossRef CAS PubMed.
- ACIL Allen Consulting for ARENA, Opportunities for Australia from hydrogen exports, https://arena.gov.au/assets/2018/08/opportunities-for-australia-from-hydrogen-exports.pdf, (accessed 5 July 2022) Search PubMed.
- International Energy Agency (IEA), The future of hydrogen, https://www.iea.org/reports/the-future-of-hydrogen, (accessed 5 July 2022).
- Wikipedia, Suiso Frontier, https://en.wikipedia.org/wiki/Suiso_Frontier, (accessed 14 November 2022).
- P. Veers, K. Dykes, E. Lantz, S. Barth, C. L. Bottasso, O. Carlson, A. Clifton, J. Green, P. Green, H. Holttinen, D. Laird, V. Lehtomäki, J. K. Lundquist, J. Manwell, M. Marquis, C. Meneveau, P. Moriarty, X. Munduate, M. Muskulus, J. Naughton, L. Pao, J. Paquette, J. Peinke, A. Robertson, R. J. Sanz, A. M. Sempreviva, J. C. Smith, A. Tuohy and R. Wiser, Grand challenges in the science of wind energy, Science, 2019, 366, u2027 CrossRef PubMed.
- Flanders Marine Institute, MarineRegions.org, https://www.marineregions.org/, (accessed 5 July 2022).
- J. J. Becker, D. T. Sandwell, W. H. F. Smith, J. Braud, B. Binder, J. Depner, D. Fabre, J. Factor, S. Ingalls, S. Kim, R. Ladner, K. Marks, S. Nelson, A. Pharaoh, R. Trimmer, J. Von Rosenberg, G. Wallace and P. Weatherall, Global bathymetry and elevation data at 30 arc seconds resolution: SRTM30_PLUS, Mar. Geod., 2009, 32, 355–371 CrossRef.
- T. Stehly and P. Duffy, 2020 cost of wind energy review, https://www.nrel.gov/docs/fy22osti/81209.pdf, (accessed 5 July 2022).
- The UN Environment Programme World Conservation Monitoring Centre (UNEP-WCMC), User manual for the world database on protected areas and world database on other effective area-based conservation measures: 1.6, https://wcmc.io/WDPA_Manual, (accessed 5 July 2022).
- B. Sweerts, S. Pfenninger, S. Yang, D. Folini, B. van der Zwaan and M. Wild, Estimation of losses in solar energy production from air pollution in China since 1960 using surface radiation data, Nat. Energy, 2019, 4, 657–663 CrossRef.
- I. Staffell and S. Pfenninger, Using bias-corrected reanalysis to simulate current and future wind power output, Energy, 2016, 114, 1224–1239 CrossRef.
- R. Gelaro, W. McCarty, M. J. Suárez, R. Todling, A. Molod, L. Takacs, C. A. Randles, A. Darmenov, M. G. Bosilovich, R. Reichle, K. Wargan, L. Coy, R. Cullather, C. Draper, S. Akella, V. Buchard, A. Conaty, A. M. Da Silva, W. Gu, G. Kim, R. Koster, R. Lucchesi, D. Merkova, J. E. Nielsen, G. Partyka, S. Pawson, W. Putman, M. Rienecker, S. D. Schubert, M. Sienkiewicz and B. Zhao, The modern-era retrospective analysis for research and applications, version 2 (MERRA-2), J. Climate, 2017, 30, 5419–5454 CrossRef PubMed.
- W. Musial, D. Heimiller, P. Beiter, G. Scott and C. Draxl, 2016 offshore wind energy resource assessment for the United States, https://www.energy.gov/sites/default/files/2019/02/f59/66599.pdf, (accessed 5 July 2022).
- International Group of Liquefied Natural Gas Importers (GIIGNL), The LNG industry: GIIGNL annual report, https://giignl.org/wp-content/uploads/2021/11/GIIGNL_Annual_Report_November2021.pdf, (accessed 5 July 2022).
- ELANE, Shipxy, https://www.shipxy.com/, (accessed 5 July 2022).
- Asia Pacific Energy Research Centre (APERC), Perspectives on hydrogen in the APEC region, https://aperc.or.jp/file/2018/9/12/Perspectives+on+Hydrogen+in+the+APEC+Region.pdf, (accessed 5 July 2022).
- Asia Pacific Energy Research Centre (APERC), APEC energy demand and supply outlook 7th edition volume I, https://aperc.or.jp/file/2019/5/30/APEC_Energy_Outlook_7th_Edition_Vol_I.pdf, (accessed 5 July 2022).
- Asia Pacific Energy Research Centre (APERC), APEC energy demand and supply outlook 7th edition volume II, https://aperc.or.jp/file/2019/5/30/APEC_Energy_Outlook_7th_Edition_Vol_II.pdf, (accessed 5 July 2022).
- Hydrogen Council, Hydrogen for net zero, https://hydrogencouncil.com/en/hydrogen-for-net-zero/, (accessed 11 November 2022).
- A. Toktarova, L. Gruber, M. Hlusiak, D. Bogdanov and C. Breyer, Long term load projection in high resolution for all countries globally, Int. J. Electrical Power Energy Systems, 2019, 111, 160–181 CrossRef.
- International Energy Agency (IEA), Offshore wind outlook 2019, https://www.iea.org/reports/offshore-wind-outlook-2019, (accessed 2 February 2023).
- Wood Mackenzie, Asia Pacific power & renewables 2021 outlook to 2050, https://www.woodmac.com/industry/power-and-renewables/asia-pacific-power-renewables-service/, (accessed 14 February 2023).
- Cable.co.uk, The price of electricity per KWh in 230 countries, https://www.cable.co.uk/energy/worldwide-pricing/, (accessed 14 February 2023).
- International Energy Agency (IEA), Global hydrogen review 2021, https://iea.blob.core.windows.net/assets/5bd46d7b-906a-4429-abda-e9c507a62341/GlobalHydrogenReview2021.pdf, (accessed 5 July 2022).
- S. van Renssen, The hydrogen solution?, Nat. Clim. Change, 2020, 10, 799–801 CrossRef.
- Wind Europe, Getting fit for 55 and set for 2050: Electrifying Europe with wind energy, https://etipwind.eu/files/reports/Flagship/fit-for-55/ETIPWind-Flagship-report-Fit-for-55-set-for-2050.pdf, (accessed 5 July 2022).
- Council of Australian Governments (COAG) Energy Council, Australia's National Hydrogen Strategy, https://www.dcceew.gov.au/energy/publications/australias-national-hydrogen-strategy, (accessed 8 February 2023).
- Japan's Cabinet Secretariat, Japan's Hydrogen Basic Strategy, https://www.cas.go.jp/jp/seisaku/saisei_energy/pdf/hydrogen_basic_strategy.pdf, (accessed 9 February 2023).
- ASEAN Centre for Energy, Hydrogen in ASEAN: Economic prospects, development, and applications, https://aseanenergy.org/hydrogen-in-asean-economic-prospects-development-and-applications/, (accessed 9 February 2023).
- Singapore's Ministry of Trade And Industry, Singapore's National Hydrogen Strategy, https://www.mti.gov.sg/Industries/Hydrogen, (accessed 8 February 2023).
Footnotes |
| † Electronic supplementary information (ESI) available. See DOI: https://doi.org/10.1039/d2ee02332f |
| ‡ These authors contributed equally to this work. |
| This journal is © The Royal Society of Chemistry 2023 |

