Deep eutectic solvothermal NiS2/CdS synthesis for the visible-light-driven valorization of the biomass intermediate 5-hydroxymethylfurfural (HMF) integrated with H2 production†
Shuzi
Liu
a,
Baolong
Zhang
a,
Zhaohui
Yang
a,
Zhimin
Xue
 *b and
Tiancheng
Mu
 *a
*a
aKey Laboratory of Advanced Light Conversion Materials and Biophotonics, Department of Chemistry, Renmin University of China, Beijing 100872, China. E-mail: tcmu@ruc.edu.cn
bBeijing Key Laboratory of Lignocellulosic Chemistry, College of Materials Science and Technology, Beijing Forestry University, Beijing 100083, China. E-mail: zmxue@bjfu.edu.cn
First published on 2nd January 2023
Abstract
Visible-light-driven transformation of biomass to high-valued chemicals is attractive for achieving a low-carbon environment. The solar-catalyzed oxidation of 5-hydroxymethylfurfural (HMF) to 2,5-diformylfuran (DFF) has great industrial potential because DFF is a pivotal precursor in industries. Here, we present a one-step deep eutectic solvothermal technique for the production of NiS2/CdS nanospheres. Because NiS2 can act as a cocatalyst enhancing the transfer and separation of photogenerated carriers, the prepared NiS2/CdS exhibits efficient visible-light-driven dehydrogenation of HMF to H2 and DFF. DFF and H2 can be produced at rates of up to 519.64 and 476.60 μmol g−1 h−1, respectively, which are about 10.03 and 9.81 times higher than those of bare CdS under visible light irradiation. Moreover, the photocatalytic process was carried out at ambient temperature and pressure in water without using a sacrificial agent. Both h+ and e− are involved in the process of photocatalytic reaction, and the valence band position of the NiS2/CdS photocatalyst is essential for the high DFF selectivity (95.2%). This work paves a sustainable way to realize the photocatalytic valorization of biomass.
Introduction
5-Hydroxymethylfurfural (HMF) is one of the most promising chemical platforms derived from cellulosic biomass.1–3 It has been widely used as a versatile precursor for the creation of high-value fine chemicals.4–7 Among the many derivatives of HMF,8–10 2,5-diformylfuran (DFF) used as a monomer plays an important role in medicine intermediates, organic conductors, and functional polymers.11,12 HMF could be oxidized by a thermocatalytic process at high temperature and high pressure.13,14 However, the thermocatalytic reaction is energy-intensive and often leads to safety and environmental issues.15In recent years, the selective oxidation of HMF to DFF through photocatalytic technology has drawn much attention.12,16–18 Yurdakal et al. first reported the application of anatase TiO2 for the catalytic oxidation of HMF in water under an ultraviolet light source.19 The majority of the organic products were DFF with a selectivity of just 10% to 25%. Wu et al.20 reported the preparation of DFF by the catalytic oxidation of HMF with Nb2O5 under visible light using trifluorobenzene as the solvent, and the yield of DFF was 20%. Giannakoudakis et al.9 used MnO2 nanorods as a catalyst and acetonitrile as a reaction medium and achieved UV-promoted oxidation of HMF to DFF. HMF was nearly completely converted to DFF without the addition of oxidants and bases. In addition to the aforementioned metal oxides, metal sulfides can also be used as photocatalysts.21,22 Among a variety of metal sulfides, cadmium sulfide (CdS) has garnered significant interest due to its appropriate band gap (2.4 eV) for light harvesting and appropriate conduction band edge for various catalytic reactions.23,24 However, the photocatalytic activity of pure CdS is insufficient due to the significant recombination of carriers and intense photocorrosion.25,26 Cocatalysts can help move electrons and holes to the surface active sites and stop charge carriers from getting back together. They could improve the speed of the reaction and the efficiency of the photocatalytic system.27,28 Wang et al. reported NixSy for the electrochemical oxidation of water and found that the adsorption energy of water on NixSy was close to that of water on IrO2, an excellent catalyst for water oxidation, even in semiconductor photocatalysis.29 To this end, it is highly possible that NixSy also plays an important role in the photocatalytic process. However, the photocatalytic oxidation of HMF to DFF by CdS using NiS2 as a cocatalyst is yet to be explored.
Nanostructure synthesis by deep eutectic solvothermal procedure has the advantage of being easy to proceed and the structure and composition can be tuned by adjusting the components of solvent, one-step preparation of the sulfide avoiding the additional oxidation process, and reactants are evenly distributed at the molecular level, thus the obtained nanostructures are homogenous. Therefore, more and more works on deep eutectic solvothermal have been carried out.30,31
In this work, CdS nanospheres deposited with NiS2 were prepared by a one-step solvothermal method. Highly selective conversion of HMF to DFF was achieved by optimizing the synthesis conditions. In situ electron paramagnetic resonance (EPR) trapping experiments revealed that ˙C6H4O3 is the major intermediate radical in the oxidation of HMF. The whole photocatalytic process occurred in water at ambient conditions without using sacrificial agents or organic solvents.
Experimental sections
Chemicals
Polyethylene glycol 200 (PEG 200, AR), thiourea (CH4N2S, 99.0%), ethyl alcohol (C2H5OH, AR), HMF (C6H6O3, 99.0%), DFF (C6H4O3, 99.0%), furfural alcohol (C5H6O2, 99.0%) and furfural (C5H4O2, 99.0%) were purchased from Sinopharm Chemical Reagent Co., Ltd. Cadmium acetate dihydrate (Cd(Ac)2·2H2O, AR) and nickel nitrate hexahydrate (Ni(NO3)2·6H2O, AR) were bought from J&K Ltd.Preparation of photocatalysts
Synthesis procedure for nanostructures: PEG-based deep eutectic solvent (DES) as a solvent and sulfur source was obtained based on the previous work.32 Here, the synthesis procedure of CdS is taken as an example. At first, DES was prepared in a 2![[thin space (1/6-em)]](https://www.rsc.org/images/entities/char_2009.gif) :
:![[thin space (1/6-em)]](https://www.rsc.org/images/entities/char_2009.gif) 1 molar ratio of PEG 200 and thiourea at 80 °C. Then, Cd(Ac)2·2H2O (0.01 mol) was dissolved in 40 ml of DES and stirred at 60 °C until a homogeneous solution was formed. Next, the mixture was placed into a 50 ml Teflon-lined stainless steel autoclave and kept in an oven at 120 °C for 12 h before cooling in air. The sample was obtained by centrifugal washing with deionized (DI) water and ethanol six times. Lastly, the yellow precipitate was dried in a vacuum at 60 °C for 12 h. NiS2/CdS composite was prepared using the same procedure as shown in Fig. 1. The detailed procedures for the synthesis of NiS2/CdS, NiS2, and NiS2 + CdS are given in the ESI section.†
1 molar ratio of PEG 200 and thiourea at 80 °C. Then, Cd(Ac)2·2H2O (0.01 mol) was dissolved in 40 ml of DES and stirred at 60 °C until a homogeneous solution was formed. Next, the mixture was placed into a 50 ml Teflon-lined stainless steel autoclave and kept in an oven at 120 °C for 12 h before cooling in air. The sample was obtained by centrifugal washing with deionized (DI) water and ethanol six times. Lastly, the yellow precipitate was dried in a vacuum at 60 °C for 12 h. NiS2/CdS composite was prepared using the same procedure as shown in Fig. 1. The detailed procedures for the synthesis of NiS2/CdS, NiS2, and NiS2 + CdS are given in the ESI section.†
Characterization of photocatalysts
For the characterization of the obtained samples, the following techniques were used. X-ray powder diffraction (XRD) performed on a D/max-2550/PC diffractometer (Rigaku), a scanning electron microscope (SEM), energy dispersive X-ray spectroscopy (EDS), and elemental mapping images on a Hitachi SU 8010 field emission SEM combined with EDS, X-ray photoelectron spectroscopy (XPS) on an ESCALAB MK X-ray photoelectron spectrometer, morphological and microstructural features using high-resolution transmission electron microscopy (HRTEM JEOL-2010), diffuse reflectance spectroscopy using a UV-vis spectrophotometer (Hitachi U-4100), specific surface areas using the nitrogen adsorption–desorption instrument (JW-BK122 W, China), steady-state photoluminescence (PL) spectra and PL decay on an Edinburgh FLS 980 transient steady-state spectrometer, and the carbon-centered radicals by electron paramagnetic resonance (EPR, Bruker EMXnano, Bruker, Germany). Detailed procedures for the above measurements are provided in the ESI section.†Catalytic activity and mechanism
Experiments on photocatalytic hydrogen evolution were carried out at room temperature in hermetically sealed Pyrex glass. The produced photocatalyst powder was suspended in 50 mL of HMF aqueous solution in a typical reaction (10 mM). Before irradiation with visible light, the suspension was thoroughly degassed with N2 for 30 min to completely remove dissolved oxygen. The visible light source was a 300 W Xe lamp (LabSolar II, Perfect Light Co., Ltd) equipped with a blocking filter (λ ≥ 420 nm). Gaseous H2 was regularly detected by a gas chromatograph (GC-2014C, Shimadzu, Japan), assembled with a TCD detector and ultrapure nitrogen as a carrier gas. The reaction solution was analyzed by HPLC, installed with a 4.6 mm × 250 mm Shim-pack GWS 5 μm C18 column, and the wavelength of the UV detector was set at 265 nm. In each measurement, 20 μL of the solution was taken out, diluted to 2 mL with an eluent, and then filtered through a 0.22 μm PTFE membrane filter. Two eluting solvents were methanol (A) and 5 mM ammonium formate aqueous solution (B), respectively. The ratio of A to B was 3![[thin space (1/6-em)]](https://www.rsc.org/images/entities/char_2009.gif) :
:![[thin space (1/6-em)]](https://www.rsc.org/images/entities/char_2009.gif) 7 with a flow rate of 0.6 mL min−1 and each separation lasted for 10 min. The quantification was performed from a standard curve of known compound concentrations (Fig. S1†). The DFF yield and DFF selectivity were calculated using the following equations, respectively.
7 with a flow rate of 0.6 mL min−1 and each separation lasted for 10 min. The quantification was performed from a standard curve of known compound concentrations (Fig. S1†). The DFF yield and DFF selectivity were calculated using the following equations, respectively. | (1) |
 | (2) |
The electrochemical experiments analysis was performed using an electrochemical workstation (Shanghai ChenHua Instrument Company). Electron paramagnetic resonance measurement (EPR) spectrometer (Bruker ELEXSYS E500). Density functional theory (DFT) calculations were carried out using the Vienna ab initio simulation (VASP5.4.4) code.33 Detailed information on the above investigation is given in the ESI section.†
Results and discussion
Catalyst characterization
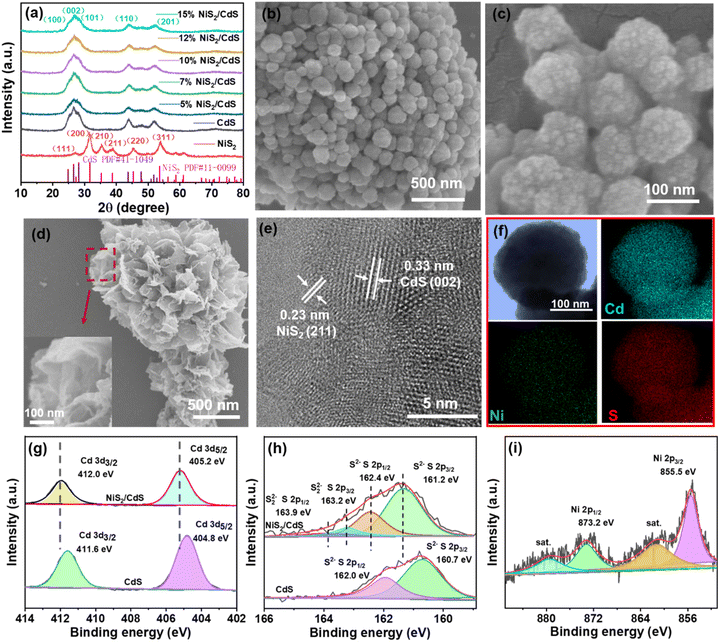
As shown in Fig. 2a, XRD patterns were used to determine the crystallization and phase purity of pure CdS NPs and NiS2/CdS composites with different amounts of NiS2. The major sharp peaks centered at 24.8°, 26.5°, 28.2°, 43.7°, 47.8°, 51.8° and 66.8°, correspond to the classical hexagonal CdS phase (JCPDS no. 41-1049) and show high crystallinity.34 The successful synthesis of NiS2/CdS is shown by the presence of the labeled emblematic peaks of nickel sulfide (NiS2, JCPDS, no. 11-0099) in the XRD patterns after NiS2 was added.32,35The morphologies and internal microstructure of the catalysts were characterized by SEM and HRTEM. The well-scattered CdS spheres have a rough surface and an average diameter of around 100 nm, as seen in Fig. 2c. Pure CdS and 10% NiS2/CdS had similar morphologies, with no discernible differences (as shown in Fig. S2†). While pure NiS2 contained peony-like particles, its subunit sheets consisted of many ultra-thin films (Fig. 2d). Further careful observation of the HRTEM image (Fig. 2e) showed that the decoration of NiS2 was successful, indicating that the interface between NiS2 and CdS was tightly connected. The interplanar spacing of 0.33 nm corresponds to the (002) planes of CdS,36 and the compact NiS2 film with an interplanar spacing of 0.23 nm can be assigned to the (211) facet of NiS2.37 Elemental mapping patterns (Fig. 2f) clearly confirmed that Cd, Ni and S elements are uniformly distributed on the nanosphere arrays. The EDS spectrum of the 10% NiS2/CdS sample is shown in Fig. S3,† further revealing that the sample had clear signals of Cd, Ni, and S elements.
X-ray photoelectron spectroscopy (XPS) study was used to learn more about the surface compositions and electronic states of NiS2/CdS. The XPS measurement spectra shown in Fig. S4† indicate the presence of Cd, Ni, and S in the corresponding samples, respectively. The characteristic high-resolution XPS spectra of Cd 3d (Fig. 2g) of pure CdS and 10% NiS2/CdS before the reaction exhibits two binding energy peaks at 411.6 eV, 404.8 eV, and 412.0 eV, 405.2 eV, respectively. In the S 2p spectrum of 10% NiS2/CdS, the large peak starting from 159 to 165 eV can be deconvoluted into four peaks (Fig. 2h). Those with energies of 163.9 and 163.2 eV, originating from S 2p1/2 and S 2p3/2, are attributed to S22− in NiS2 nanosheets, the others at 162.4 and 161.2 eV are the S 2p1/2 and S 2p3/2 of S2− for CdS nanospheres, respectively.38 Significantly, the binding energies of Cd 3d characteristic peaks in NiS2/CdS composite shifted slightly to higher values compared to pure CdS, implying that the density of electrons in Cd decreases after adding NiS2 on CdS spheres and the existence of strong interfacial interactions between CdS nanospheres and NiS2 nanosheets. In the core-level XPS spectrum of Ni 2p (Fig. 2i), the peak at about 855.5 eV is assigned to Ni 2p3/2, and the peak at 873.2 eV is assigned to Ni 2p1/2. Compared with the bare NiS2 nanoparticles (the binding energy peaks of Ni 2p3/2 and Ni 2p1/2 are 855.8 eV and 873.5 eV, respectively), the binding energy of Ni was negatively shifted by 0.3 eV (Fig. S5†), indicating, a strong electronic interaction between NiS2 and CdS. Two broad satellite peaks are also seen, suggesting the existence of both Ni2+ and Ni3+.39
The specific surface area and pore size distribution of the prepared samples were investigated using the N2 adsorption–desorption isotherm shown in Fig. S6a,† which exhibited a typical type IV adsorption–desorption isotherm according to IUPAC with the H3 hysteresis loop at the P/P0 range of 0.5–1.0.40 Fig. S6b† shows the pore size distribution curve estimated by the Barrett–Joyner–Halender (BJH) method. These mesopores could be due to the outcome of excessive NiS2 nanoparticles accumulated on the surface of CdS SPs. Moreover, NiS2/CdS nanocomposites have a larger specific BET surface area than that bare CdS SPs.
Evaluation of photocatalytic performance
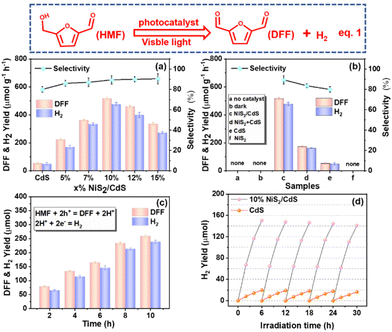
The photocatalytic activities of individual CdS and NiS2/CdS for the oxidation of HMF to DFF and H2 (eqn (1)) were measured in water under visible light irradiation. To optimize the catalyst amount, experiments adding different amounts (10 mg, 25 mg, 50 mg, 100 mg, and 150 mg) of 10% NiS2/CdS catalyst were conducted in 50 mL of HMF (10 mM) aqueous solution. As shown in Fig. S7a,† it is obvious that the lower the amount of sample added, the greater the catalytic rate per unit mass. However, when a smaller amount of materials was added, the total product per unit volume of the solution also became less for a certain period of time (Fig. S7b†), which is not conducive to industrialized production (large quantities of products cannot be obtained in a short period of time). Based on the comprehensive consideration of the amount of the catalyst used and the output per unit time per unit volume of the solution, either 25 mg or 50 mg of the catalyst in 50 mL of HMF (10 mM) in water is a good choice. Herein, we added 50 mg samples in 50 mL of HMF (10 mM) aqueous solution as the unified standard to continue the next series of research.As illustrated in Fig. 3a, the yield rates of high value-added fine chemical DFF and H2 over bare CdS are around 51.8 and 48.6 μmol g−1 h−1, respectively. The selectivity of DFF is about 82.0% due to the generation of trace byproducts such as 2,5-furandimethanol (DHMF) and 5-hydroxymethyl-2-furancarboxylic acid (HMFCA) (Fig. S8†).41 Notably, the addition of NiS2 considerably increases the production rates of DFF and H2, showing that NiS2 is an efficient way to enhance photocatalytic systems. Moreover, the production rates of DFF and H2 evolution are also dependent on the amount of NiS2 in NiS2/CdS. The optimized amount of NiS2 in NiS2/CdS was 10%. DFF and H2 can be produced at rates of up to 519.64 and 476.60 μmol g−1 h−1, respectively, which are around 10.03 and 9.81 times higher than that on bare CdS. Additionally, DFF's selectivity over 10% NiS2/CdS could increase up to 90.2%. When the NiS2 loading reached 12%, the generation rate decreased significantly. This is because NiS2 and CdS could expose most interfaces on the surface of 10% NiS2/CdS, therefore, there were most corresponding photocatalytic active sites. Intriguingly, as the proportion of NiS2 increases, so does the selectivity of DFF with a maximum value of 95.2%. From Fig. 3b, it is evident that 10% NiS2 + CdS has significantly less photocatalytic activity than 10% NiS2/CdS, but stronger photocatalytic activity than CdS. This indicates that NiS2 is indeed an effective cocatalyst at enhancing the photocatalytic activity of CdS, and it is quite necessary to optimize the interfaces between the photocatalyst and the cocatalyst. The control studies, on the other hand, showed that DFF and H2 were undetectable in the absence of photocatalysts or visible light irradiation. These findings demonstrate that: (1) the production of DFF and H2 is actually activated by visible-light-driven photocatalysis; (2) NiS2 as a cocatalyst could efficiently enhance the photocatalytic activity of CdS for the conversion of DFF and H2; (3) the synergistic effect between NiS2 and CdS is an ideal prerequisite for enhancing the photoredox activity. The reaction time was extended from 2 hours to 10 hours to examine the catalyst performance over time (Fig. 3c). No peaks for other possible products were detected, indicating the high purity of the photocatalytic biomass products (Fig. S9†). It can be seen that the photocatalytic activity of 10% NiS2/CdS on the generation of DFF and H2 increases gradually with the increase of the reaction time. The reactive stability of 10% NiS2/CdS as a representative sample has been evaluated by examining the H2 yield using the same system for photocatalytic conversion, repeatedly, five times. As shown in Fig. 3d, the decay for long-time visible-light-driven hydrogen evolution of pure CdS is larger than that of 10% NiS2/CdS as a result of the known photocorrosion of metal sulfides. The binding energy changes of Cd in CdS and 10% NiS2/CdS before and after the photostability test can be seen in Fig. S10.† The results show that the cocatalyst NiS2 can inhibit the photocorrosion of CdS. The photostability of NiS2/CdS composites is related to the effective separation of the photoexcited electrons and holes in CdS by NiS2. The crystallinity (Fig. S11†) and morphology (Fig. S12†) of the material remained unchanged after irradiation, indicating that the photoreaction had no effect on the morphology and crystal morphology of the material. The crystallinity and morphology of NiS2/CdS nanospheres do not change after the photoreaction, which indicates that the photoreaction did not affect the morphology and crystal form of the material. We compared the photocatalytic oxidation of HMF with those of the previously reported photocatalysts under both similar and different conditions (Table S1†). We can see that the photocatalyst in our work clearly exhibits a high photocatalytic rate and high selectivity.
Furfuryl alcohol (biomass derivative) as an analog of HMF can be converted to valuable platform chemicals through high-temperature catalysis in the solution.42 To check the broad scope, we selected furfural alcohol for photocatalytic conversion on 10% NiS2/CdS nanocrystals. Furfural alcohol (one of the biomass derivatives) has been converted to valuable platform chemicals biomass derivatives through high-temperature catalysis in the solution. The catalyst performance over time is shown in Fig. S13† (the corresponding standard curves are shown in Fig. S14†). Furfural and H2 can be produced at rates of up to 611.40 and 561.86 μmol g−1 h−1, respectively. The selectivity of furfural was about 98.7%.
Photocatalytic mechanism
The optical characteristics of pure CdS and its mixtures were also investigated by the UV-vis diffuse reflectance spectra. As shown in Fig. S15a,† the spectrum shifted upwards with increasing NiS2 content. Similar to pure CdS nanosheets, NiS2/CdS showed typical semiconducting absorption at around 520 nm. NiS2 loaded on CdS nanospheres demonstrated a considerable increase in light absorption from 500 to 750 nm due to its strong light absorption ability. In addition, the loading of NiS2 does not affect the light absorption edges, indicating that it does not influence the lattice of CdS. Fig. S15b† shows the band gaps of CdS, 10% NiS2/CdS, and 15% NiS2/CdS. Band gap energy (Eg) values for other samples can be found in Table S2.† The band gap energy values of CdS, 5% NiS2/CdS, 7% NiS2/CdS, 10% NiS2/CdS, 12% NiS2/CdS, and 15% NiS2/CdS were 2.43 eV, 2.42 eV, 2.41 eV, 2.39 eV, 2.38 eV, and 2.37 eV, respectively. With the increasing content of NiS2, the band gap energy values of the samples decrease, which indicates that the decoration of the CdS lattice with NiS2 slightly decreases its band gap. The band gap energy values of the products are evaluated using the Kubelka–Munk function, and the corresponding formula is as follows:| (ahυ)2 = c(hυ − Eg) | (3) |
Capacitance measurements by the Mott–Schottky equation are used to quantify electron carrier density.43
 | (4) |
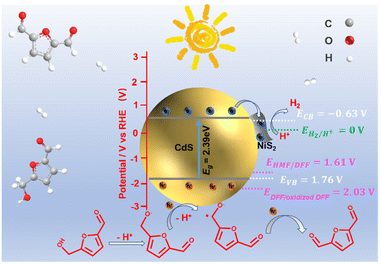 | ||
| Scheme 1 Schematic illustration of the determined CB and VB edges of NiS2/CdS and oxidizing potential. | ||
The charge transfer mechanism at the NiS2/CdS interface was investigated using the density functional theory (DFT). The theoretical work functions (Φ) of CdS (Fig. 4a) and NiS2 (Fig. 4b) were calculated to be 6.46 and 8.76 eV, respectively, indicating that the electrons are prone to gather on NiS2. The deformation charge density (Fig. 4c) shows that electrons tend to transfer from CdS to NiS2 at the NiS2/CdS interface. Therefore, the S atoms in NiS2 primarily facilitated the gain of electrons. Specifically, the Bader charge shows that the electron transport from CdS to NiS2 is 5.35e (Fig. 4d). The electron transfer route is consistent with the binding energy shifts of S 2p and the obtained work function above.
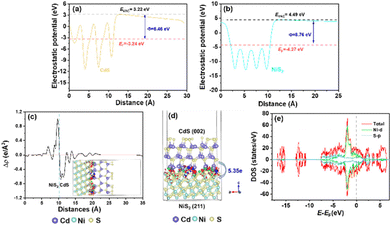 | ||
| Fig. 4 Theoretical work functions of CdS (a) and NiS2 (b). (c) Electron density difference (e Å−3) and (d) Bader electron transfer at the NiS2/CdS interfaces. (e) The density of states of NiS2. | ||
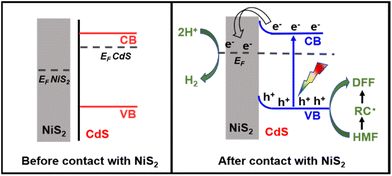
According to the aforementioned findings, a possible catalytic mechanism for the photocatalytic conversion of HMF into DFF along with H2 evolution on NiS2/CdS nanospheres is proposed (Scheme 2). NiS2 has metallic properties and high electrical conductivity. The density of states also confirmed the metallic nature of NiS2 (Fig. 4e). An interfacial barrier area, also known as a barrier layer, forms at the contact interfaces of NiS2 and CdS when they are in close proximity. Due to the lower Fermi level (EF NiS2) compared to that of CdS (EF CdS) and surface metallic characteristics, the photogenerated electrons from CdS can quickly move to NiS2, and the recombination of photogenerated electron–hole pairs is prevented. Additionally, NiS2 can easily mix with surface-adsorbed H2O to generate Ni–H bonds in addition to serving as active sites for the hydrogen evolution reaction. The electrons on H2O-bonded NiS2 will generate H2 with adsorbed H+, which further enhances the photocatalytic performance and the NiS2/CdS nanohybrid system stability. The photoexcited electrons travel to the CB of the primary catalyst CdS under visible light, while an equivalent number of photoexcited holes are left on the VB of CdS. The cocatalyst NiS2 receives the electrons quickly delivered from the CB of CdS. In order to convert HMF into DFF, photoexcited holes on CdS first activate the alkoxide anion that was deprotonated from HMF, resulting in the formation of appropriate carbon radicals and the release of an H+ ion. The generated carbon radicals then continue to react with the holes to create DFF molecules. One HMF molecule can produce two H+ ions in total, which can combine with two electrons on NiS2. Therefore, the two isolated reactions can be successfully carried out without the use of any sacrificial agents, and aqueous solution green recycling can be developed.
Photoluminescence (PL) spectra and photoelectric properties
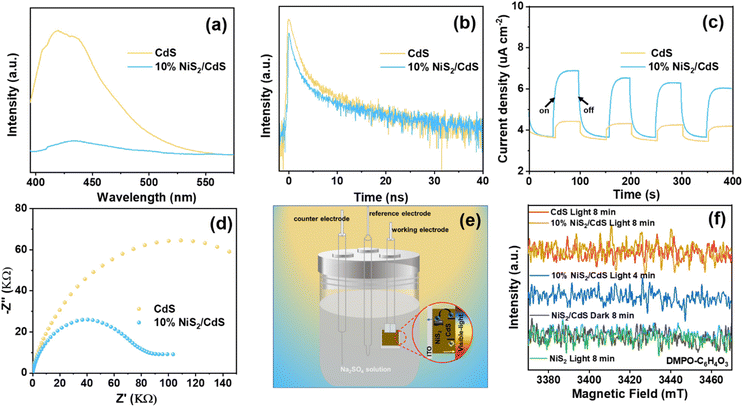
To further investigate the effect of the deposited NiS2 in separating the internal carriers on the photocatalytic coproduction of H2 and DFF, the PL spectra of pure CdS and 10% NiS2/CdS were measured. The PL emission intensity was clearly quenched when the NiS2 was modified on CdS (Fig. 5a). The time-resolved PL (TRPL) decay spectra were also recorded to explore the carrier transfer dynamics, as shown in Fig. 5b. The decay curves of the produced samples match the following double exponential equation quite well: | (5) |
| τave = (A1τ12 + A2τ22)/(A1τ1 + A2τ2) | (6) |
The double-exponential fitting results are summarized in Table S3.† A significant PL quenching and lifespan enhancement suggested that carrier transfer and separation in NiS2/CdS were significantly more efficient.46 Photoelectrochemical tests were also carried out to further examine the separation and transfer ability of the charges. The transient photocurrent responses of the two samples exposed to visible light (420 nm) with regular on/off cycles are depicted in Fig. 5c. It is evident that the 10% NiS2/CdS sample displayed much greater photocurrent density than that of CdS, implying a more efficient carrier separation in 10% NiS2/CdS.47 Moreover, the electrochemical impedance spectroscopy (EIS) Nyquist plot of 10% NiS2/CdS exhibited a smaller arc radius than pure CdS (Fig. 5d), which suggested that there was a lower interface charge transfer resistance in 10% NiS2/CdS.
Fig. S17† shows the LSV polarization curves of pristine CdS, NiS2, and 10% NiS2/CdS at a scan rate of 5 mV s−1. It is clear to see that the electrocatalytic activity is NiS2 > 10% NiS2/CdS > CdS. This indicates that NiS2 can effectively accelerate the electrocatalytic hydrogen evolution kinetics of nanocomposites, thereby, greatly improving the HER (hydrogen evolution reaction) performance of nanocomposites.48 The corresponding schematic of the photochemical cell and electron flow is shown in Fig. 5e. Nevertheless, all of the above results prove that the NiS2/CdS nanosphere structure could accelerate the photogenerated carrier separation, thus improving the photocatalytic performance.
Electron paramagnetic resonance study
In situ EPR studies were performed to detect reactive intermediates during the catalytic reactions and understand the photocatalytic dehydrogenation process of HMF in prepared composites. As illustrated in Fig. 5f, no EPR signals could be seen on the blank tests (performed in the dark or under visible light irradiation with bare NiS2). But after irradiation, signals corresponding to the peaks of carbon-centered radicals were clearly seen across both pure CdS and 10% NiS2/CdS. The intensity of the signals increased with the radiation time, indicating the formation of carbon-centered radicals over 10% NiS2/CdS during the photocatalytic reaction.49 Moreover, the intensity of 10% NiS2/CdS is clearly stronger than that of CdS, showing that more carbon-centered radicals are produced over 10% NiS2/CdS. The results are consistent with the above photocatalytic activity.Conclusions
In this study, NiS2/CdS was synthesized via a one-step deep eutectic solvothermal procedure. The obtained NiS2/CdS composites, especially 10% NiS2/CdS nanospheres, can be used as a highly effective, bifunctional photocatalyst for the selective conversion of biomass-derived alcohols to high-value-added fine chemical DFF and clean energy (H2) without adding the sacrificial agent. DFF and H2 can be produced at rates of up to 519.64 and 476.60 μmol g−1 h−1, which are about 10.03 and 9.81 times larger, respectively, than that on bare CdS under visible light irradiation. The DFF selectivity of x% NiS2/CdS can reach up to 95.2%. Photocurrent, EIS, LSV, PL, and TRPL experiments and DFT calculations clearly showed that NiS2 can effectively facilitate the separation and migration of photo-excited charges when used as a co-catalyst. A rational photocatalytic process was proposed on the basis of UV–vis, Mott–Schottky, and EPR. Importantly, this work offers a promising method for creating innovative, non-precious metal, and efficient visible-light-driven composite photocatalysts. The photocatalytic dehydrogenation strategy could be used in other organic transformation processes.Conflicts of interest
There are no conflicts to declare.Acknowledgements
This work has been funded by the National Natural Science Fund of China (No. 22073112, 22238011).Notes and references
- S. Xu, P. Zhou, Z. Zhang, C. Yang, B. Zhang, K. Deng, S. Bottle and H. Zhu, J. Am. Chem. Soc., 2017, 139, 14775–14782 CrossRef CAS PubMed.
- T. Chhabra, P. Dwivedi and V. Krishnan, Green Chem., 2022, 24, 898–910 RSC.
- T. Chhabra, A. Bahuguna, S. S. Dhankhar, C. M. Nagaraja and V. Krishnan, Green Chem., 2019, 21, 6012–6026 RSC.
- C. Xu, E. Paone, D. Rodriguez-Padron, R. Luque and F. Mauriello, Chem. Soc. Rev., 2020, 49, 4273–4306 RSC.
- Y. C. Yang and T. C. Mu, Green Chem., 2021, 23, 4228–4254 RSC.
- T. Wang, L. Tao, X. Zhu, C. Chen, W. Chen, S. Du, Y. Zhou, B. Zhou, D. Wang, C. Xie, P. Long, W. Li, Y. Wang, R. Chen, Y. Zou, X.-Z. Fu, Y. Li, X. Duan and S. Wang, Nat. Catal., 2022, 5, 66–73 CrossRef CAS.
- K. Gu, D. Wang, C. Xie, T. Wang, G. Huang, Y. Liu, Y. Zou, L. Tao and S. Wang, Angew. Chem., Int. Ed., 2021, 60, 20253–20258 CrossRef CAS PubMed.
- C. Li, J. Li, L. Qin, P. Yang and D. G. Vlachos, ACS Catal., 2021, 11, 11336–11359 CrossRef CAS.
- D. A. Giannakoudakis, V. Nair, A. Khan, E. A. Deliyanni, J. C. Colmenares and K. S. Triantafyllidis, Appl. Catal., B, 2019, 256, 117803 CrossRef CAS.
- A. Khan, M. Goepel, A. Kubas, D. Lomot, W. Lisowski, D. Lisovytskiy, A. Nowicka, J. C. Colmenares and R. Glaser, ChemSusChem, 2021, 14, 1351–1362 CrossRef CAS PubMed.
- Z. H. Zhang and K. J. Deng, ACS Catal., 2015, 5, 6529–6544 CrossRef CAS.
- M. Zhang, Z. Li, X. Xin, J. Zhang, Y. Feng and H. Lv, ACS Catal., 2020, 10, 14793–14800 CrossRef CAS.
- X. Huang, O. Akdim, M. Douthwaite, K. Wang, L. Zhao, R. J. Lewis, S. Pattisson, I. T. Daniel, P. J. Miedziak, G. Shaw, D. J. Morgan, S. M. Althahban, T. E. Davies, Q. He, F. Wang, J. Fu, D. Bethell, S. McIntosh, C. J. Kiely and G. J. Hutchings, Nature, 2022, 603, 271–275 CrossRef CAS PubMed.
- E. Hayashi, Y. Yamaguchi, K. Kamata, N. Tsunoda, Y. Kumagai, F. Oba and M. Hara, J. Am. Chem. Soc., 2019, 141, 890–900 CrossRef CAS PubMed.
- L. Hu, A. Y. He, X. Y. Liu, J. Xia, J. X. Xu, S. Y. Zhou and J. M. Xu, ACS Sustainable Chem. Eng., 2018, 6, 15915–15935 CrossRef CAS.
- X. Wu, N. Luo, S. Xie, H. Zhang, Q. Zhang, F. Wang and Y. Wang, Chem. Soc. Rev., 2020, 49, 6198–6223 RSC.
- T. Chhabra, S. Dhingra, C. M. Nagaraja and V. Krishnan, Carbon, 2021, 183, 984–998 CrossRef CAS.
- S. Dhingra, T. Chhabra, V. Krishnan and C. M. Nagaraja, ACS Appl. Energy Mater., 2020, 3, 7138–7148 CrossRef CAS.
- S. Yurdakal, B. S. Tek, O. Alagoz, V. Augugliaro, V. Loddo, G. Palmisano and L. Palmisano, ACS Sustainable Chem. Eng., 2013, 1, 456–461 CrossRef CAS.
- H. Zhang, Q. Wu, C. Guo, Y. Wu and T. Wu, ACS Sustainable Chem. Eng., 2017, 5, 3517–3523 CrossRef CAS.
- M. D. Regulacio and M. Y. Han, Acc. Chem. Res., 2016, 49, 511–519 CrossRef CAS PubMed.
- P. Zhang, S. B. Wang, B. Y. Guan and X. W. Lou, Energy Environ. Sci., 2019, 12, 164–168 RSC.
- X. Wu, S. Xie, H. Zhang, Q. Zhang, B. F. Sels and Y. Wang, Adv. Mater., 2021, 33, 2007129 CrossRef CAS PubMed.
- S. Dhingra, M. Sharma, V. Krishnan and C. M. Nagaraja, J. Colloid Interface Sci., 2022, 608, 1040–1050 CrossRef CAS PubMed.
- Y. Zhong, G. Zhao, F. Ma, Y. Wu and X. Hao, Appl. Catal., B, 2016, 199, 466–472 CrossRef CAS.
- X.-j. Wang, X.-l. Li, C. Liu, F.-t. Li, Y.-p. Li, J. Zhao, R.-h. Liu and G.-d. Li, Int. J. Hydrogen Energy, 2018, 43, 219–228 CrossRef CAS.
- B. He, C. Bie, X. Fei, B. Cheng, J. Yu, W. Ho, A. A. Al-Ghamdi and S. Wageh, Appl. Catal., B, 2021, 288, 119994 CrossRef CAS.
- Z. Dou, Z. Zhang, H. Zhou and M. Wang, Angew. Chem., Int. Ed., 2021, 60, 16399–16403 CrossRef CAS PubMed.
- Y. Wang, Z. Fang, Q. Dong, Y. Chu, X. Shi, M. Song and Z. Hao, Appl. Surf. Sci., 2019, 491, 590–594 CrossRef CAS.
- D. Yu, Z. Xue and T. Mu, Cell Rep. Phys. Sci., 2022, 100809 CrossRef CAS.
- D. Yu, Z. Xue and T. Mu, Chem. Soc. Rev., 2021, 50, 9345–9345 RSC.
- X. Zhao, X. Lan, D. Yu, H. Fu, Z. Liu and T. Mu, Chem. Commun., 2018, 54, 13010–13013 RSC.
- G. Kresse and J. Furthmuller, Phys. Rev. B: Condens. Matter Mater. Phys., 1996, 54, 11169–11186 CrossRef CAS PubMed.
- J. Yuan, J. Wen, Y. Zhong, X. Li, Y. Fang, S. Zhang and W. Liu, J. Mater. Chem. A, 2015, 3, 18244–18255 RSC.
- J. Yue, J. Xu, J. Niu and M. Chen, Int. J. Hydrogen Energy, 2019, 44, 19603–19613 CrossRef CAS.
- J. Zou, W. Zhou, L. Huang, B. Guo, C. Yang, Y. Hou, J. Zhang and L. Wu, J. Catal., 2021, 400, 347–354 CrossRef CAS.
- B. Zhang, H. Fu and T. Mu, Green Chem., 2022, 24, 877–884 RSC.
- J. Zou, W. Zhou, L. Huang, B. Guo, C. Yang, Y. Hou, J. Zhang and L. Wu, J. Catal., 2021, 400, 347–354 CrossRef CAS.
- J. Liang, Y. Wang, Q. Liu, Y. Luo, T. Li, H. Zhao, S. Lu, F. Zhang, A. M. Asiri, F. Liu, D. Ma and X. Sun, J. Mater. Chem. A, 2021, 9, 6117–6122 RSC.
- K. S. W. Sing, Pure Appl. Chem., 1985, 57, 603–619 CrossRef CAS.
- S. Dhingra, M. Sharma, V. Krishnan and C. M. Nagaraja, J. Colloid Interface Sci., 2022, 615, 346–356 CrossRef CAS PubMed.
- T. Chhabra, J. Rohilla and V. Krishnan, Mol. Catal., 2022, 519, 112135 CrossRef CAS.
- L. Shi, W. Zhou, Z. Li, S. Koul, A. Kushima and Y. Yang, ACS Nano, 2018, 12, 6335–6342 CrossRef CAS PubMed.
- S. Meng, H. Wu, Y. Cui, X. Zheng, H. Wang, S. Chen, Y. Wang and X. Fu, Appl. Catal., B, 2020, 266, 118617 CrossRef CAS.
- X. W. Shi, S. Kim, M. Fujitsuka and T. Majima, Appl. Catal., B, 2019, 254, 594–600 CrossRef CAS.
- X. L. Bao, H. L. Li, Z. Y. Wang, F. X. Tong, M. Liu, Z. K. Zheng, P. Wang, H. F. Cheng, Y. Y. Liu, Y. Dai, Y. C. Fan, Z. Y. Li and B. B. Huang, Appl. Catal., B, 2021, 286, 119885 CrossRef CAS.
- M. Liu, L. R. Zheng, X. L. Bao, Z. Y. Wang, P. Wang, Y. Y. Liu, H. F. Cheng, Y. Dai, B. B. Huang and Z. K. Zheng, Chem. Eng. J., 2021, 405, 126654 CrossRef CAS.
- C. Li, H. Wang, S. B. Naghadeh, J. Z. Zhang and P. Fang, Appl. Catal., B, 2018, 227, 229–239 CrossRef CAS.
- X. Bao, M. Liu, Z. Wang, D. Dai, P. Wang, H. Cheng, Y. Liu, Z. Zheng, Y. Dai and B. Huang, ACS Catal., 2022, 12, 1919–1929 CrossRef CAS.
Footnote |
| † Electronic supplementary information (ESI) available. See DOI: https://doi.org/10.1039/d2gc04535d |
| This journal is © The Royal Society of Chemistry 2023 |


