Portable general microfluidic device with complex electric field regulation functions for electrokinetic experiments†
Wenshang
Guo
a,
Ye
Tao
a,
Kaihao
Mao
a,
Weiyu
Liu
b,
Rui
Xue
a,
Zhenyou
Ge
a and
Yukun
Ren
 *a
*a
aState Key Laboratory of Robotics and System, Harbin Institute of Technology, West Da-zhi Street 92, Harbin, Heilongjiang 150001, People's Republic of China. E-mail: rykhit@hit.edu.cn
bSchool of Electronics and Control Engineering, Chang'an University, Middle-Section of Nan'er Huan Road, Xi'an 710000, China
First published on 2nd December 2022
Abstract
Electrokinetic sample manipulation is a key step for many kinds of microfluidic chips to achieve various functions, such as particle focusing and separation, fluid pumping and material synthesis. But these microfluidic experiments usually rely on large-scale signal generators for power supply, microscopes for imaging and other instruments for analysis, which hampers the portable process of microfluidic technology. Inspired by this situation, we herein designed a portable general microfluidic device (PGMD) with complex electric field regulation functions, which can accurately regulate static or continuous fluid samples. Through the graphical user interface (GUI) and modular design, the PGMD can generate multiple different electrical signals, and the micro-flow of fluid can be pumped through the built-in micropump, which can meet the requirements of most microfluidic experiments. Photos or videos of the microfluidic chip captured by the built-in microscope are received and displayed by a smartphone. We carried out a variety of microfluidic experiments such as induced-charge electroosmosis (ICEO), particle beam exit switching, thermal buoyancy flow and dielectrophoresis (DEP) on the PGMD. In addition, the PGMD can perform rapid microalgae concentration estimation in an outdoor environment, which can be used to guide microalgae cultivation, further demonstrating the development potential of this device in the field of microbial applications. Numerous results show that the PGMD has a high degree of integration and strong reliability, which expands the application of microfluidic electrokinetic experiments and provides technical support for the integration and portability of microfluidic experimental devices.
Introduction
Microfluidic experiments have attracted more and more attention due to their high sensitivity and high throughput. However, most microfluidic experiments need to rely on complex power supply equipment, and the results are often viewed through microscopes and computers, which greatly limits the application of microfluidic technology. In recent years, point-of-care testing (POCT) devices have become increasingly common in the global analytical market. Particularly in external environments where complex devices cannot be deployed or where resources are limited, POCT devices have shown great potential for development.1–3 It has become a trend to integrate all steps of field diagnostics into POCT devices.4,5 Due to its high portability and wide range of applications, POCT technology has been used to detect various biomarkers, including proteins in body fluids,6,7 nucleic acids,8–10 and tumor cells,11,12 and for food safety detection.13 However, although POCT technology has great application prospects, there are still many obstacles such as low integration, poor versatility, and difficulty in realizing fluid transmission,14–16 which hinder the translation of this new technology from the laboratory to routine clinical practice. To realize the integration of the POCT system and improve the portability of the device, many researchers connect the microfluidic device to a smartphone,17,18 and use the camera and processor on the mobile phone for image detection,19 genetic analysis,20 and electrochemical testing.21 Besides, fluid delivery in microfluidic experiments usually relies on complex delivery structures, such as on-chip valves22 or external micro syringe pumps. Despite the small size of various valves or pumps, complex external equipment and piping systems limit their portable applications.23 Therefore, it is of great significance to integrate the microfluidic pump into a portable device.Physical fields such as sound field,24 light field,25 electric field,26,27 and magnetic field28 play an important role in the field of real-time detection. Among many external field manipulation methods, the electric field manipulation method is widely used in POCT devices due to its simple structure and easy integration. However, the current form of the electric field of POCT devices is simple and cannot realize the complex electric field regulation functions, resulting in a single function and poor versatility of the device. The control forms based on the electric field include induced charge electroosmosis (ICEO), alternating current electroosmosis (ACEO), thermal buoyancy flow, and dielectrophoresis (DEP). They have played an important role in particle aggregation,29,30 fluid pumping,31 cell capture,32–34 nucleic acid detection,35 material concentration,36 water quality detection,37 particle deflection38 or separation39–42 and other real-time detection methods. Therefore, integrating a variety of electric field regulation technologies into a portable device can meet the detection needs of different application scenarios.43
Microalgae cells have received more and more attention in recent years, mainly because they are rich in oil and can be processed into biofuels to alleviate the current increasingly severe energy crisis.44–46 Although microalgae cells are relatively small in size, they reproduce quickly, have a wide range of survival, and have strong salt tolerance. In an artificial breeding environment, their concentration is an important indicator to test the breeding effect.47,48 Therefore, the rapid detection of microalgae concentration under outdoor conditions is of great significance for the efficient and rapid cultivation of microalgal cells.
In this work, we design a portable general microfluidic device (PGMD) with complex electric field regulation and fluid pumping functions. This device is controlled through the graphical user interface (GUI) and can generate up to four-phase AC signals or DC signals. Its internally embedded micro-pump can provide precise flow pumping, which can meet the experimental conditions required by most microfluidic experiments including ROT-ICEO, thermal buoyancy flow, and DEP. The experimental images observed with the built-in microscope can be sent to a mobile phone in real time through the wireless module of the device. ROT-ICEO, thermal buoyancy convection, and DEP experiments were carried out on the PGMD to verify the feasibility of obtaining accurate and reasonable experimental data from different microfluidic experiments outside the laboratory.
In addition, the PGMD can perform rapid microalgae concentration estimation in an outdoor environment, which can be used to guide microalgae cultivation, further demonstrating the development potential of this device in the field of microbial applications. This portable microfluidic experimental device is easy to use, which means that microfluidic experiments can be performed by anyone in a faster and more convenient mode. The PGMD has a high degree of integration and strong versatility, which greatly expands the application of microfluidic experiments and provides a certain reference for the further integration and portability of subsequent microfluidic experimental devices.
Experimental
Device structure and connections
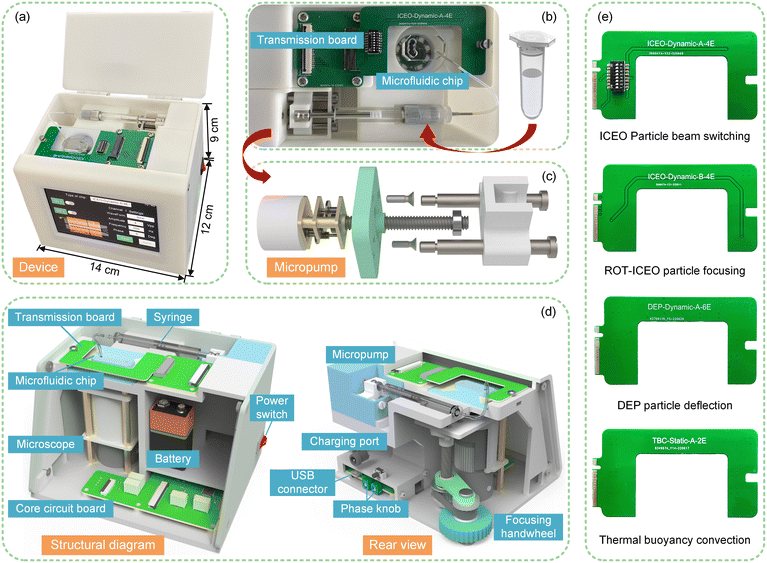
The material of the PGMD shell is photosensitive resin, which is made by light-curing 3D printing technology. The microscope, signal generator, and micro syringe pump are integrated in the PGMD, as shown in Fig. 1(a). The operation area of the device is shown in Fig. 1(b). The micropump pumps the sample solution into the microfluidic chip through the syringe, and the signal transmission board applies an electric field to the microfluidic chip to carry out the required experiments. The structure schematic diagram of the micropump is shown in Fig. 1(c). A micro stepping motor, a reduction box with a reduction ratio of 50, and an M4 threaded output shaft are used to convert rotary motion into linear motion and push the syringe for fluid delivery.The detailed structure diagram of the device is shown in Fig. 1(d). The PGMD can be powered by a built-in lithium battery (5 V, 3600 mAh) or by a 5 V, 2 A power adapter. Part of the energy of the power supply enters the core circuit board, which is used to power the display (TJC8048, Taojingchi, China) and the microcontroller (STM32F103, STMicroelectronics, Italy). The GUI on the display is shown in Fig. S1.† The other part is used as the power supply for image processing and transmission devices on the microscope.
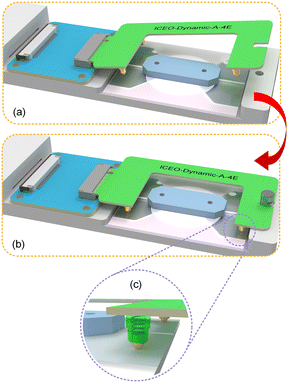
A focusing handwheel is installed at the rear of the PGMD, and the focal length of the microscope is adjusted through a synchronous belt and a lead screw drive. The built-in microscope of the PGMD contains 8 LEDs as light sources and a movable lens, as shown in Fig. S2.† The pictures or videos captured by the microscope can be transmitted to a smartphone via wireless fidelity (Wi-Fi) and displayed through an application (APP) (Max-see, Shenzhen Zhongcheng Technology) on the smartphone. To realize the function of modular design and rapid disassembly and assembly, different signal transmission boards can be replaced according to the requirements of the chip for electrical signals (Fig. 1(e)). The signal transmission board is connected to the device using the M.2 standard interface and is fixed on the device by a hand screw, as shown in Fig. 2(a) and (b). A spring probe is installed at the position corresponding to the signal transmission board and the microfluidic chip. While fixing the signal transmission board, the probe comes into contact with the chip, applies an electric field signal, and maintains a firm contact under the action of the internal spring of the probe (Fig. 2(c)).
Fabrication of the microfluidic chip
Microfluidic chips are composed of channels and electrodes. Glass coated with conductive indium tin oxide (ITO) films was purchased from Xiangcheng Technology (Shenzhen, China). For the thermal buoyancy convection, ITO glass was used with a sheet resistance of 1–2 Ω, an ITO film thickness of 1200 ± 30 nm and a transmittance of 40%. For other experiments, ITO glass was used with a sheet resistance of 6–8 Ω, an ITO film thickness of 185 ± 30 nm and a transmittance of 80%. Polydimethylsiloxane (PDMS) was poured on the dry film mold to copy the channel structure and the electrode pattern was formed on ITO-coated glass by soft lithography. PDMS and ITO-coated glass were bonded together by oxygen plasma activation to form a complete microfluidic chip. The specific manufacturing process is shown in Fig. S3.†Sample preparation
Polystyrene particles (PS, 5 μm, 12 μm, and 20 μm), silica particles (SiO2, 5 μm), and Tween 20 were obtained from Sigma-Aldrich. Potassium chloride (KCl) was purchased from Macklin. Tween (1 wt%) solution was obtained by dilution with ethanol. In the experiment, 10 μS cm−1 KCl solution was used as the particle buffer, and 10 μL of PS or SiO2 particles (2.5% w/v) and 4 μL of Tween (1 wt%) solution were successively added to 1.5 ml of particle buffer to prepare the sample solution. The samples were sonicated for 3 min before each experiment to enhance particle dispersion. Oocystis sp. was obtained from Health Biological Technology Co. Ltd. The algae seeds and purified water were mixed at a ratio of 1![[thin space (1/6-em)]](https://www.rsc.org/images/entities/char_2009.gif) :
:![[thin space (1/6-em)]](https://www.rsc.org/images/entities/char_2009.gif) 3, and after adding 0.2% vol nutrient solution, the culture was carried out under natural light and at room temperature with stirring three times a day.
3, and after adding 0.2% vol nutrient solution, the culture was carried out under natural light and at room temperature with stirring three times a day.
Results and discussion
Working principle and output performance of the PGMD
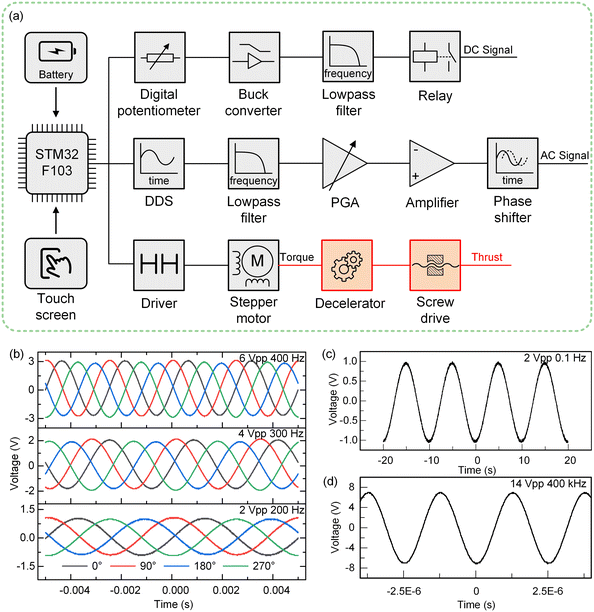
The working principle of the control part of the PGMD is shown in Fig. 3(a). The power from the built-in lithium battery or external power adapter is delivered to each component after being decoupled and filtered by the voltage regulator. The overall working principle is divided into three parts: DC signal output, AC signal output, and fluid pumping. The parameters of each part can be set separately on the corresponding interface of the display screen. In the DC signal output section, a buck converter (PW2058, PWCHIP Semiconductor, China) is used to step down the 5 V DC from the battery or power adapter to the required voltage. To realize the controllable output of the DC signal, a digital potentiometer (MCP41010, Microchip, USA) is used to connect to the feedback end of the buck converter, and the digital potentiometer communicates with the microcontroller through the serial peripheral interface (SPI) bus. The output voltage of the buck converter passes through a low-pass filter to filter out the high-frequency noise, and then the output state is controlled by the relay. A DDS chip (AD9833, Analog Devices, USA) is used to generate the reference signal and also communicates with the microcontroller through the SPI bus. By reading and writing the internal registers of the DDS chip, three reference signals of sine wave, square wave, and triangle wave can be generated. The reference signal is first passed through a low-pass filter to filter out high frequency noise, and then transformed into an up-down symmetrical AC signal through a subtractor, which is then amplified by a programmable gain amplifier (PGA) and a multiplier to output the required AC signal.The micropump uses a double H-bridge drive chip (DRV8834, Texas Instruments, USA) to drive the micro deceleration stepping motor and uses a lead screw to convert the rotary motion into linear motion, thereby pushing the syringe for fluid pumping. The lead of the lead screw is S = 0.7 mm, the inner diameter of the syringe used is D = 3.26 mm, the precise reduction ratio of the reducer is i = 51.1, and the step angle of the motor is a = 18°. If the pumping flow is q (μL min−1), the required pulse speed can be calculated by the following equation:
 | (1) |
 | (2) |
 | (3) |
In microfluidic experiments that require superposition control of the electric field of more than two phases, most experiments use signals with the same amplitude but different phases. To reduce the volume of the control system and improve the stability of the signal, two DDS chips are used for independent control of two channels. And the signals of other channels are obtained from these two signals through phase-shifting transformation. A phase-lag regulator is constructed by using an operational amplifier (Fig. S4, ESI†), which reduces the size of the control circuit while ensuring the function of the device. By adjusting the knob at the back of the PGMD (Fig. 1(d)), the phase can be adjusted quickly, and the adjustment range is 0–180°. Taking four signals with a 90° phase difference as an example, the signals of different amplitudes and frequencies generated by the PGMD are shown in Fig. 3(b). It can be seen that the AC signal generated by the PGMD has a stable waveform and low noise, which can meet the needs of microfluidic experiments. In addition, the PGMD can also generate a low-voltage low-frequency signal of 2 Vpp, 0.1 Hz (Fig. 3(c)) and a high-frequency signal of 14 VPP, 400 kHz (Fig. 3(d)), which can meet the requirements of most microfluidic experiments for electric field conditions. The detailed specification parameters of the PGMD are shown in Table S1.†
The control part of the device is used to provide the required electric field signal and pump fluid to the microfluidic chip. When it is necessary to observe the internal reaction process of the chip, the light generated by the LED light source from the microscope is reflected by the microfluidic chip and illuminated on the CMOS through the lens; the CMOS device converts the external optical signals into digital signals and transmits them to the microcontroller, which then transmits them to the smartphone through Wi-Fi modules. The overall operation process of the PGMD is shown in Movie S1.†
Design and simulation of the ROT-ICEO system
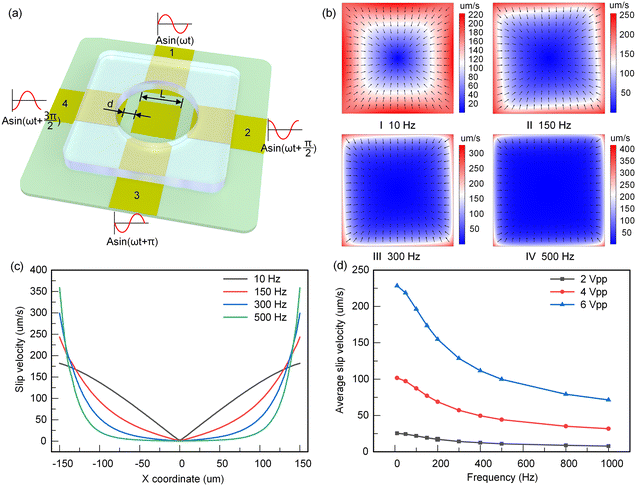
The PGMD can carry out a variety of microfluidic experiments outside the laboratory. In this work, the particle focusing experiment based on ROT-ICEO is taken as an example for a detailed introduction.ICEO is a kind of nonlinear electroosmosis flow, which drives particle motion by generating vortices in solution. Fig. 4(a) describes the structure of the ROT-ICEO system. The chip consists of a circular cavity and ITO-coated glass with a specific electrode structure. The electrode in the middle of the circular cavity is the floating electrode, and the four surrounding electrodes are the excitation electrodes. The length of the electrode is L = 300 μm, the distance between the excitation electrode and the floating electrode is d = 100 μm, the diameter of the circular cavity is 1 mm, and the height is 0.5 mm. A pipette is used to drop the sample solution into the PDMS channel. After the particle movement is stabilized, four AC signals with the same amplitude and a phase difference of 90° are applied to the four excitation electrodes. At this time, an electric double layer will be formed on the surface of the floating electrode, thereby causing the flow of ROT-ICEO. The flow of ROT-ICEO drives the particles to move toward the center of the floating electrode, so as to realize the focusing of particles. Transient ionic charge polarity and the slip flow direction at different time instants are shown in Fig. S5(a)–(d).†
The distribution of electrostatic potential and the ROT-ICEO slip flow field are simulated using COMSOL Multiphysics. The boundary conditions of the simulation model are shown in Table S2.† According to the Helmholtz formula, the time-averaged slip velocity of a polarizable surface is expressed as:49
 | (4) |
After solving the distribution of electrostatic potential, the time-averaged ROT-ICEO slip velocity on the floating electrode can be obtained from eqn (4), as shown in Fig. 4(b). The slip flow on the surface of the floating electrode shows a convergence mode, and the flow stagnation point is located in the center of the electrode (shown in Fig. 4(b)-I). This slip flow will bring particles into the center of the floating electrode to achieve particle focusing. As the electric field frequency increases, the slip flow becomes asymmetric (Fig. 4(b)-II). When the frequency is further increased above 300 Hz, the symmetry of this surface slip flow begins to recover (Fig. 4(b)-III and IV). The time-averaged slip velocity distribution along the diagonal of the floating electrode is shown in Fig. 4(c). It can be seen that with the increase of frequency, the velocity of fluid near the edge of the electrode gradually increases, and the velocity at the stagnation point in the center of the electrode is suppressed. The average value of the time-averaged slip velocity along the diagonal is shown in Fig. 4(d). With the increase of voltage, the average flow rate increases; with the increase of frequency, the average flow rate decreases, which indicates that the focusing speed of particles on the surface of the floating electrode will gradually increase with the increase of voltage and the decrease of frequency.
Particle focusing experiment based on ROT-ICEO
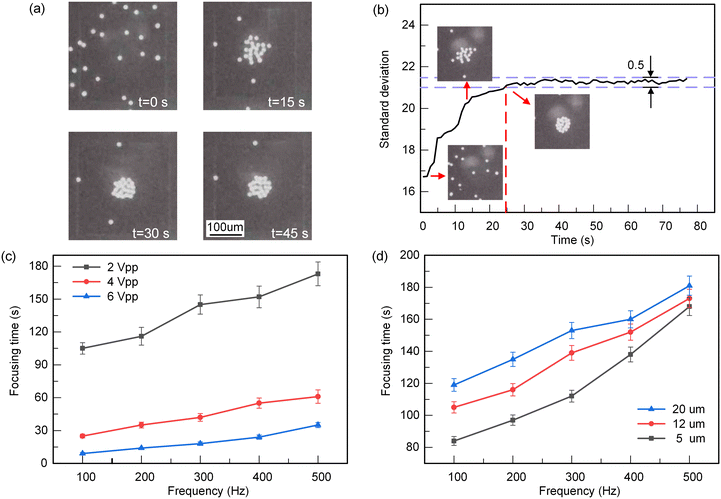
To verify the effectiveness of the PGMD, we carried out the particle focusing experiments based on ROT-ICEO. 12 μm PS microspheres were focused under the electric field conditions of 4 Vpp and 300 Hz. As shown in Fig. 5(a), the particles were successfully focused in the center of the floating electrode, thus the four-phase AC electric field generated by the PGMD is effective. To compare the focusing effect of particles under different electric field conditions, taking 4 Vpp, 100 Hz as an example, the gray standard deviation of the floating electrode area is calculated using ImageJ (Fig. 5(b)). The gray standard deviation represents the difference in the gray value of each pixel. If the gray value of each point on the image is relatively close, the gray standard deviation is small. Therefore, the gray standard deviation is small when the particles are dispersed on the surface of the floating electrode, and the gray value is larger when the particles are focused.It can be seen from Fig. 5(b) that the standard deviation gradually increases as the particles focus towards the center. When all the particles around the floating electrode are attracted to the center of the electrode, the standard deviation remains within a small range. We define that when the fluctuation range of the standard deviation is less than 0.5, the particles achieve stable focusing. The focusing time refers to the time from the application of the electric field to the completion of focusing. Then the focusing times of 12 μm PS microspheres were obtained under different electric field conditions (Fig. 5(c)). Under the conditions of low voltage, the flow of ROT-ICEO is weak and particles cannot be captured immediately. Conversely, the particle focusing speed is faster at higher voltage, indicating that the flow of ROT-ICEO is stronger. At the same time, with the continuous increase of electric field frequency, the particle focusing speed decreases, indicating that the ROT-ICEO flow gradually decreases with the increase of frequency, which is consistent with the simulation results in Fig. 4(d).
Besides, we also tried the focusing effect of three PS microspheres with different sizes at 2 Vpp, as shown in Fig. 5(d). The particles with smaller sizes are easier to be captured by the ROT-ICEO vortex because of their lighter mass and smaller inertia. But the focusing speed of larger particles is slower due to their heavy mass. As a result, the PGMD is effective and reliable in ROT-ICEO experiments.
Particle beam switching based on ICEO
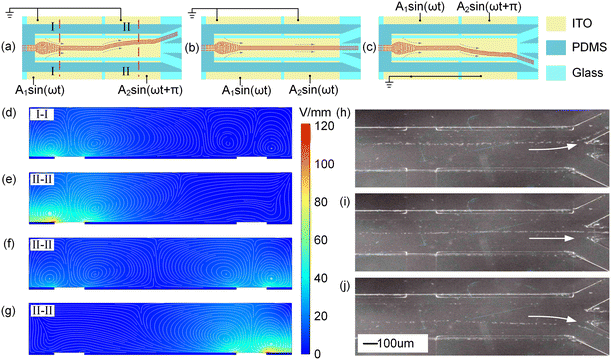
In addition to the ROT-ICEO experiment, the PGMD can also carry out a variety of other microfluidic experiments, such as particle beam exit switching, thermal buoyancy convection, and DEP by changing the signal transmission board. The particle beam exit switching based on ICEO is shown in Fig. 6, and the particles used in the experiment are 5 μm PS microspheres with a flow rate of 10 nL s−1. Fig. 6(a)–(c) are the schematic diagrams of the experiment, and the size of electrodes are shown in Fig. S6(a) and Table S3.† Through different power-on methods, the functions of particle focusing and outlet switching can be realized by using two AC signals. The two AC signals used in the experiments are shown in Fig. S6(b).† If the two electrodes above the channel are grounded, and the two electrodes below are connected to different AC signals (Fig. 6(a)), the frequency of both signals is kept at f = 200 Hz, A1 = 5 V, A2 = 7 V, and A2 is 180° ahead of A1, and the flow field distributions at sections I-I and II-II are shown in Fig. 6(d)–(e). It can be seen that particles at section I-I focus toward the center, and the particle beam deflects upward at section II-II and finally flows out from the upper outlet. The experimental results are shown in Fig. 6(h). If the frequency and phase of the two signals are the same (Fig. 6(b)), A1 = A2 = 5 V, f = 200 Hz, the flow field distribution at section II-II is shown in Fig. 6(f). The particles are focused toward the center of the electrode and finally flow out from the middle outlet. The experimental results are shown in Fig. 6(i). If the two signals are inversely connected, the two electrodes below the channel are grounded, and the two electrodes above the channel are connected to different AC signals (Fig. 6(c)). The frequency of both signals is kept at f = 200 Hz. If A1 = 5 V, A2 = 7 V, and A2 is 180° ahead of A1, the flow field distribution at section II-II is shown in Fig. 6(g), and the particle beam is deflected downward and finally flows out of the lower outlet. The experimental results are shown in Fig. 6(j).Particle manipulation based on thermal buoyancy convection and DEP
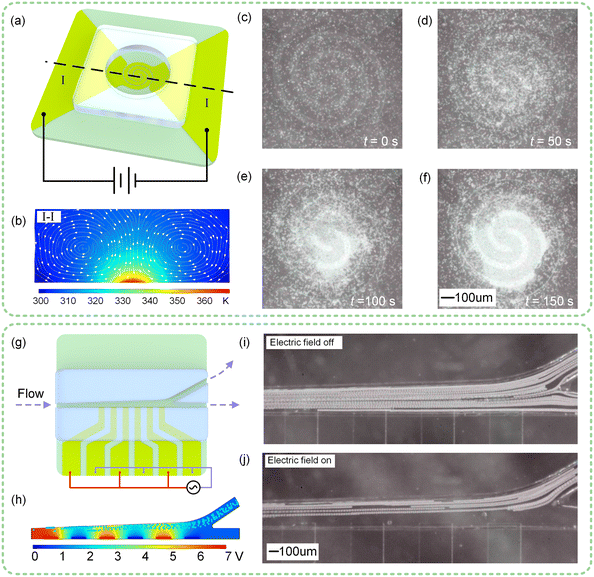
The PGMD is also suitable for thermal buoyancy convection and DEP experiments. As for thermal buoyancy convection, the particle focusing experiment is shown in Fig. 7(a)–(f). Fig. 7(a) is the experimental schematic diagram, and the electrode size is shown in Fig. S7(a).† By selecting the “Thermal buoyancy convection” tab on the display screen and setting the corresponding parameters, the control circuit can generate a 2.6 V DC signal (Fig. S7(b), ESI†), which is connected to both ends of the microfluidic chip through the signal transmission board. The flow field and thermal field distribution at section I-I are obtained through numerical simulation, as shown in Fig. 7(b). The focusing of small-sized particles can be achieved by thermal buoyancy convection. For example, 5 μm SiO2 microspheres whose sharp edges cannot be observed by the PGMD can be quickly focused together, so that the focused particles can be clearly observed (Fig. 7(c)–(f)).DEP-based particle deflection experiments are shown in Fig. 7(g)–(j). Fig. 7(g) is the schematic diagram of the experiment, and the electrode size is shown in Fig. S8(a).† By selecting the “DEP” tab on the display screen and setting the corresponding parameters, the control circuit can generate a 14 Vpp, 100 kHz square wave signal (Fig. S8(b)†). The particle motion state obtained by numerical simulation in COMSOL is shown in Fig. 7(b). The fluid containing 12 μm PS microspheres was pumped through the channel at a rate of 10 nL s−1 by a built-in micropump, and the particles could flow out from both outlets when no power was applied (Fig. 7(i)). It can be seen from Fig. S8(c)† that PS microspheres are affected by negative DEP in the full frequency range. Therefore, under the action of negative dielectrophoresis force, the particles move in the direction of weakening electric field and deflect upward (Fig. 7(j)).
Through the above several different microfluidic experiments, it is proved that the PGMD can flexibly change the output signal and power-on mode according to the different experimental requirements. The experimental results are basically consistent with the numerical simulations, proving that the device is effective for microfluidic experiments.
Rapid detection of Oocystis sp. concentration
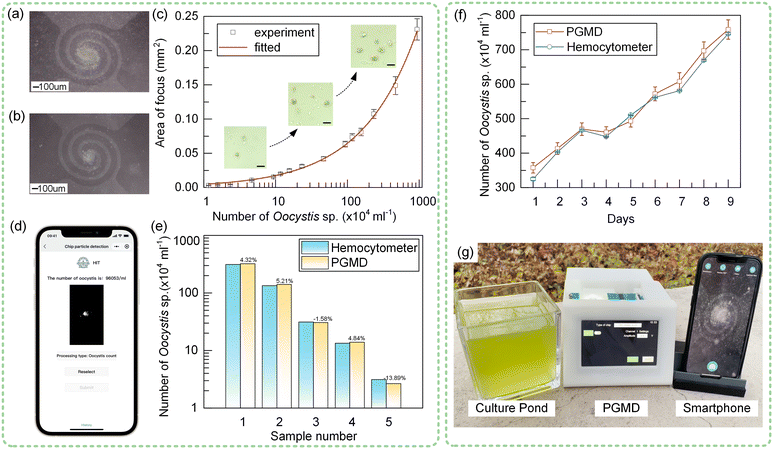
The particles in the solution can be rapidly enriched by thermal buoyancy convection, so the particle concentration in the sample can be quickly detected according to the particle focusing effect. For artificially cultivated microalgae, the rapid detection of concentration has a great guiding role in the cultivation effect. Taking Oocystis sp. as an example, we carried out thermal buoyancy convection experiments on the chip in Fig. 7(a). In the experiment, the cultured Oocystis sp. was used and the maximum concentration was 9.35 × 10⁶ ml−1. We configured different concentrations of Oocystis sp. and used thermal buoyancy convection to focus for 10 minutes at a voltage of 2.4 V. The results are shown in Fig. 8(a) and (b). It can be seen that for different concentrations of Oocystis sp., the focusing degree is different under the same conditions. Using image processing methods, the focusing area of Oocystis sp. can be quickly calculated. The steps of image processing are shown in Fig. S9.† Similarly, we calculated the focusing area of Oocystis sp. at different concentrations and obtained the actual concentration of Oocystis sp. using a hemocytometer, as shown in Fig. 8(c). The approximate trend is similar to the power function, and the fitted curve equation is y = 0.0048x0.56476, where y represents the focusing area of Oocystis sp. and x represents the concentration. To facilitate outdoor use, a smartphone app was developed based on the fitted results, and the estimated concentration of Oocystis sp. can be obtained by uploading the photo taken by the microscope (Fig. 8(d)). Subsequently, we carried out concentration estimation experiments with five different concentrations of Oocystis sp., and the results are shown in Fig. 8(e). The error is larger at lower concentrations because there are fewer Oocystis sp. in the focus area. The detection error is less than 5.21% in the range of 5 × 10⁴–9.35 × 10⁶ ml−1.To demonstrate the role of the PGMD in the cultivation of Oocystis sp. more intuitively, we carried out a 9-day cultivation experiment (Fig. 8(f)) and detected the concentration of Oocystis sp. at the same time every day. The results are shown in Fig. 8(f). The microalgae concentrations estimated by the PGMD were basically consistent with those measured using the hemocytometer. The PGMD can be used to conveniently detect the change of the concentration of Oocystis sp. in a resource-limited out-of-lab environment (Fig. 8(g), Movie S3, ESI†). The farmers can adjust the growth environment of microalgae (temperature, light, etc.) according to the concentration changes, proving the important role of the device in microalgae cultivation.
Conclusions
In summary, a PGMD with complex electric field regulation functions is designed by combining a signal generator, a micro syringe pump, and a microscope. The device can generate up to 4 channels of AC signals and 1 channel of DC signal through the GUI and modular design. The built-in micropump can achieve micro-flow pumping as low as 5.7 nL s−1. The images captured by the microscope inside the device can be transmitted to a smartphone through Wi-Fi and displayed in real time on the mobile APP. Taking ROT-ICEO as an example, the influence of different electrical signals on the surface slip velocity of the floating electrode was calculated by numerical simulation, and the experimental results were consistent with the simulation. In addition, the PGMD was used to carry out other microfluidic experiments such as particle beam exit switching, thermal buoyancy convection, and DEP, which effectively realized the manipulation of particles and verified the effectiveness and versatility of the PGMD. In addition, we used thermal buoyancy convection to obtain the relationship between different concentrations of Oocystis sp. and the focusing area, and further obtained the change of microalgae concentration during the microalgae cultivation, which has great guidance significance for outdoor microalgae cultivation. At the same time, this proves that the PGMD can carry out a variety of experiments outside the laboratory, expand the application of microfluidic experiments, and provide technical support for the further integration and portability of subsequent microfluidic experimental equipment.Author contributions
Wenshang Guo: investigation, methodology, writing – original draft; Ye Tao: methodology, software; Weiyu Liu: validation, writing – review & editing; Rui Xue: validation, methodology, data curation; Zhenyou Ge: methodology, investigation; Yukun Ren: funding acquisition, resources, supervision, writing – review & editing. All authors have read and agreed to the published version of the manuscript.Conflicts of interest
There are no conflicts to declare.Acknowledgements
This research was financially supported by the National Natural Science Foundation of China (No. 12072096, No. 12172064), the Interdisciplinary Research Foundation of HIT (IR2021229), and the Self-Planned Task (SKLRS201803B) of State Key Laboratory of Robotics and System (HIT).Notes and references
- Z. Xu, Z. Liu, M. Xiao, L. Jiang and C. Yi, Chem. Eng. J., 2020, 394, 124966 Search PubMed.
- J. Hui, Y. Gu, Y. Zhu, Y. Chen, S. J. Guo, S. C. Tao, Y. Zhang and P. Liu, Lab Chip, 2018, 18, 2854–2864 RSC.
- C. M. Pandey, S. Augustine, S. Kumar, S. Kumar, S. Nara, S. Srivastava and B. D. Malhotra, Biotechnol. J., 2018, 13, 1700047 Search PubMed.
- B. Hu, J. Li, L. Mou, Y. Liu, J. Deng, W. Qian, J. Sun, R. Cha and X. Jiang, Lab Chip, 2017, 17, 2225–2234 Search PubMed.
- V. C. Romao, S. A. M. Martins, J. Germano, F. A. Cardoso, S. Cardoso and P. P. Freitas, ACS Nano, 2017, 11, 10659–10664 Search PubMed.
- R. Fan, O. Vermesh, A. Srivastava, B. K. H. Yen, L. Qin, H. Ahmad, G. A. Kwong, C.-C. Liu, J. Gould, L. Hood and J. R. Heath, Nat. Biotechnol., 2008, 26, 1373–1378 CrossRef CAS PubMed.
- M. P. McRae, G. Simmons, J. Wong and J. T. McDevitt, Acc. Chem. Res., 2016, 49, 1359–1368 CrossRef CAS PubMed.
- X. Fang, H. Chen, S. Yu, X. Jiang and J. Kong, Anal. Chem., 2011, 83, 690–695 CrossRef CAS PubMed.
- X. Fang, Y. Liu, J. Kong and X. Jiang, Anal. Chem., 2010, 82, 3002–3006 CrossRef CAS PubMed.
- P. Brangel, A. Sobarzo, C. Parolo, B. S. Miller, P. D. Howes, S. Gelkop, J. J. Lutwama, J. M. Dye, R. A. McKendry, L. Lobel and M. M. Stevens, ACS Nano, 2018, 12, 63–73 CrossRef CAS PubMed.
- Z. Ke, M. Lin, J.-F. Chen, J.-S. Choi, Y. Zhang, A. Fong, A.-J. Liang, S.-F. Chen, Q. Li, W. Fang, P. Zhang, M. A. Garcia, T. Lee, M. Song, H.-A. Lin, H. Zhao, S.-C. Luo, S. Hou, H.-H. Yu and H.-R. Tseng, ACS Nano, 2015, 9, 62–70 CrossRef CAS PubMed.
- K.-A. Hyun, T. Y. Lee, S. H. Lee and H.-I. Jung, Biosens. Bioelectron., 2015, 67, 86–92 CrossRef CAS PubMed.
- H.-Y. Lin, C.-H. Huang, J. Park, D. Pathania, C. M. Castro, A. Fasano, R. Weissleder and H. Lee, ACS Nano, 2017, 11, 10062–10069 CrossRef CAS PubMed.
- R. C. Fitzgerald, A. C. Antoniou, L. Fruk and N. Rosenfeld, Nat. Med., 2022, 28, 666–677 CrossRef CAS PubMed.
- J. Zheng, T. Cole, Y. Zhang, J. Kim and S.-Y. Tang, Biosens. Bioelectron., 2021, 194, 113666 CrossRef CAS PubMed.
- K. Zhang, J. Wang, T. Liu, Y. Luo, X. J. Loh and X. Chen, Adv. Healthcare Mater., 2021, 10, 2100734 CrossRef CAS PubMed.
- Q. Wei, R. Nagi, K. Sadeghi, S. Feng, E. Yan, S. J. Ki, R. Caire, D. Tseng and A. Ozcan, ACS Nano, 2014, 8, 1121–1129 CrossRef CAS PubMed.
- J. Song, B. Cha, J. Moon, H. Jang, S. Kim, J. Jang, D. Yong, H.-J. Kwon, I.-C. Lee, E.-K. Lim, J. Jung, H. G. Park and T. Kang, ACS Nano, 2022, 16(7), 11300–11314 CrossRef CAS PubMed.
- T. Guo, R. Patnaik, K. Kuhlmann, A. J. Rai and S. K. Sia, Lab Chip, 2015, 15, 3514–3520 RSC.
- A. Priye, S. Wong, Y. Bi, M. Carpio, J. Chang, M. Coen, D. Cope, J. Harris, J. Johnson, A. Keller, R. Lim, S. Lu, A. Millard, A. Pangelinan, N. Patel, L. Smith, K. Chan and V. M. Ugaz, Anal. Chem., 2016, 88, 4651–4660 CrossRef CAS PubMed.
- A. Nemiroski, C. Christodouleas Dionysios, W. Hennek Jonathan, A. Kumar Ashok, E. J. Maxwell, T. Fernández-Abedul Maria and M. Whitesides George, Proc. Natl. Acad. Sci., 2014, 111, 11984–11989 Search PubMed.
- S. Elizabeth Hulme, S. S. Shevkoplyas and G. M. Whitesides, Lab Chip, 2009, 9, 79–86 Search PubMed.
- A. Unger Marc, H.-P. Chou, T. Thorsen, A. Scherer and R. Quake Stephen, Science, 2000, 288, 113–116 CrossRef PubMed.
- J. Nam, H. Lim, C. Kim, J. Yoon Kang and S. Shin, Biomicrofluidics, 2012, 6, 024120 CrossRef PubMed.
- Y. Lee, B. Kim, I. Oh and S. Choi, Small, 2018, 14, 1802769 CrossRef PubMed.
- L. Coudron, M. B. McDonnell, I. Munro, D. K. McCluskey, I. D. Johnston, C. K. L. Tan and M. C. Tracey, Biosens. Bioelectron., 2019, 128, 52–60 Search PubMed.
- K. Zhao and D. Li, ACS Appl. Mater. Interfaces, 2018, 10, 36572–36581 Search PubMed.
- A. Weddemann, F. Wittbracht, A. Auge and A. Hütten, Appl. Phys. Lett., 2009, 94, 173501 Search PubMed.
- X. Chen, Y. Ren, W. Liu, X. Feng, Y. Jia, Y. Tao and H. Jiang, Anal. Chem., 2017, 89, 9583–9592 CrossRef CAS PubMed.
- H. Sun, Y. Ren, W. Liu, X. Feng, L. Hou, Y. Tao and H. Jiang, Anal. Chem., 2018, 90, 11376–11384 CrossRef CAS PubMed.
- H. Sugioka, K. Yamamoto and H. Yoshijima, Colloids Surf., A, 2022, 649, 129497 Search PubMed.
- X. Chen, Y. Ren, L. Hou, X. Feng, T. Jiang and H. J. N. Jiang, Anal. Chem., 2019, 11, 6410–6421 CAS.
- Y. Wu, Y. Ren, Y. Tao, L. Hou and H. Jiang, Anal. Chem., 2016, 88, 11791–11798 CrossRef CAS PubMed.
- F. Paratore, V. Bacheva, G. V. Kaigala and M. Bercovici, PNAS, 2019, 116, 10258–10263 Search PubMed.
- N. A. P. Ondevilla, T.-W. Wong, N.-Y. Lee and H.-C. Chang, Biosens. Bioelectron., 2022, 199, 113847 CrossRef CAS PubMed.
- A. Abdelghany, K. Yamasaki, Y. Ichikawa and M. Motosuke, Electrophoresis, 2022, 43(16–17), 1755–1764 Search PubMed.
- D. Das, Z. Yan, N. V. Menon, Y. Kang, V. Chan and C. Yang, RSC Adv., 2015, 5, 70197–70203 Search PubMed.
- K. Zhang, Y. Ren, T. Jiang and H. Jiang, Chem. Eng. J., 2022, 431, 134200 Search PubMed.
- B. Mathew, A. Alazzam, G. Destgeer and H. J. Sung, J. Electrost., 2016, 84, 63–72 Search PubMed.
- I. F. Cheng, C.-C. Chung and H.-C. Chang, Microfluid. Nanofluid., 2011, 10, 649–660 Search PubMed.
- H.-H. Cui, J. Voldman, X.-F. He and K.-M. Lim, Lab Chip, 2009, 9, 2306–2312 Search PubMed.
- L. Wang, L. A. Flanagan, N. L. Jeon, E. Monuki and A. P. Lee, Lab Chip, 2007, 7, 1114–1120 RSC.
- W. Guo, Y. Tao, W. Liu, C. Song, J. Zhou, H. Jiang and Y. Ren, Lab Chip, 2022, 22, 1556–1564 RSC.
- M. Sakarika and M. Kornaros, Bioresour. Technol., 2019, 273, 237–243 Search PubMed.
- J. K. Lim, D. C. J. Chieh, S. A. Jalak, P. Y. Toh, N. H. M. Yasin, B. W. Ng and A. L. Ahmad, Small, 2012, 8, 1683–1692 CrossRef CAS PubMed.
- R. Halim, R. Harun, M. K. Danquah and P. A. Webley, Appl. Energy, 2012, 91, 116–121 CrossRef CAS.
- H. N. Winata, M. A. Nasution, T. Ahamed and R. Noguchi, Multimedia Tools and Applications, 2021, vol. 80, pp. 8541–8561 Search PubMed.
- J.-Y. Liu, L.-H. Zeng and Z.-H. Ren, Appl. Spectrosc. Rev., 2021, 56, 171–192 CrossRef CAS.
- Y. Ren, W. Liu, J. Liu, Y. Tao, Y. Guo and H. Jiang, Biomicrofluidics, 2016, 10, 054103 CrossRef PubMed.
Footnote |
| † Electronic supplementary information (ESI) available. See DOI: https://doi.org/10.1039/d2lc01053d |
| This journal is © The Royal Society of Chemistry 2023 |

