 Open Access Article
Creative Commons Attribution 3.0 Unported Licence
Advanced nanocomposite materials made of TiC nanocrystals in situ immobilized in SiC foams with boosted spectral selectivity†
Maxime
Balestrat
*a,
Maxime
Cheype
a,
Christel
Gervais
 b,
Xavier
Deschanels
c and
Samuel
Bernard
 *a
*a
aIRCER, CNRS, Univ. Limoges, Limoges, France. E-mail: maxime.balestrat@unilim.fr; samuel.bernard@unilim.fr
bSorbonne Université, CNRS, Collège de France, Laboratoire Chimie de la Matière Condensée de Paris, 4 Place de Jussieu, 75005 Paris, France
cUniv. Montpellier, ICSM, CEA, CNRS, ENSCM, Marcoule, France
First published on 13th January 2023
Abstract
TiC/SiC nanocomposites have been prepared and fully characterized at various length scales before exploring their spectral selectivity for their exploitation as solar selective absorbers. The full design process consists of (i) performing the reaction between a polysilazane, namely Durazane® 1800, and tetrakis(dimethylamino)titanium, (ii) shaping the as-synthesized polymer into pellets, (iii) pyrolyzing in flowing argon the raw pellets in order to achieve the conversion of the polymer into a single-phase ceramic and (iv) performing a heat-treatment at higher temperature to generate nanocomposite structures while developing the porosity of the pellets. The evolutive material is characterized at each step of the process via a combination of complementary techniques including FTIR and solid-state NMR spectroscopies, elemental analyses, thermogravimetric analysis (TGA) coupled with mass spectroscopy (MS), X-ray diffraction (XRD), Raman spectroscopy, scanning electron microscopy (SEM), energy-dispersive X-ray spectroscopy (EDX) and transmission electron microscopy (TEM). The optical properties (0.25–25 μm wavelength range) of the materials have been explored as a function of the temperature at which the final material has been isolated (1000–1800 °C). The material prepared at 1800 °C made of TiC nanocrystals in situ immobilized in a highly crystallized SiC matrix with an open porosity of 56% exhibited a boosted room temperature spectral selectivity of 1.91 which has been so far the highest referenced among SiC-based materials.
Introduction
Photothermal conversion of solar energy is a safe sustainable energy supply which has been attracting growing research interest to boost the burgeoning research field of Concentrating Solar Power (CSP) systems in recent years.1 Photothermal conversion takes place in the first step in CSP using solar selective absorbers (SSAs). The SSAs – proposed by Tabor in the 1950s – are in thermal contact with a fluid or a gas to create steam which runs a turbine to produce electrical power in the second step.2 Thus, SSAs are seen as the key materials which govern the overall performance of CSP.3A first requirement to design SSAs relies on a high absorbance (α > 90%, low reflectance R) in the wavelength range of 0.3–2.5 μm (spectral region of the solar radiation) and a low thermal emittance (ε < 10%, high reflectance R) in the infrared region (2.5–25 μm). This will contribute to an appropriate spectral selectivity (α/ε) which is the parameter to qualify the material composing SSAs.4 A second requirement is its working temperature. Indeed, the current maximum operating temperature of SSAs is limited to 600 °C due to the degradation of its components above this temperature.5 This significantly limits the full exploitation of the photothermal conversion of solar radiation for CSP. Higher working temperatures (typically 900 °C is a common target) will have the consequence of improving the efficiency of the thermal-to-electricity conversion of the power generation system which is capped by the Carnot efficiency; ηc = 1 − Tc/Th in which Th is the working temperature and Tc is the ambient temperature,6 thereby boosting the efficiency of SSAs.
Silicon carbide (SiC) offers unique features for high temperature applications compatible with the operating conditions of further CSP systems.7 It is light weight, and has a high thermal conductivity, an excellent thermal shock resistance performance, a high strength and an oxidation resistance because of its capability to form a passivating oxide layer upon oxidation which provides a thermal stability up to ∼1400 °C.7–9 However, despite its good sunlight absorption properties, SiC displays a high thermal emittance in the infrared region leading to poor optical selectivity.10
Ultra-High Temperature Ceramics (UHTC, e.g. borides, carbides and some nitrides of early transition metals (TM)) can be considered as a class of promising materials in the field of solar thermal power. They possess favorable properties as solar absorbers such as a very high melting point, a good thermo-mechanical properties at high temperatures and, most of them are intrinsically selective.10–17 Among those materials, TiC and TiN exhibit an inherent spectral selectivity which can be used for delivering high-performance SSAs.17–19 However, they tend to oxidize in the targeted operating temperature range.20–22 As most single-phase materials do not naturally have the required behavior (in terms of both thermal stability and spectral selectivity) as SSAs, how can we further enhance the working temperature of SSAs beyond 600 °C?
Engineered composites combining SiC with its unique features as a matrix surrounding the UHTC phase with its inherent spectral selectivity and a lower thermal emittance would display a combination of properties which can be advantageously exploited to increase the operating temperature of SSAs in the next generation of CSP systems. If such materials can be developed as porous components, they could be able to produce the so-called volumetric effect, which means that the irradiated side of the absorber is at a lower temperature than the medium leaving the absorber. Thus, the porous structure would act as a convective heat exchanger where the heat transfer fluid (i.e., air) is imposed to maximize the absorption of the solar radiation by convection heat transfer mode. However, designing UHTC/SiC composites while developing the porosity is highly challenging.
The Polymer-Derived Ceramics (PDCs) route – via in situ growth and materials nano-structuring23,24 represents an effective precursor approach for designing and synthesizing porous SiC – acting as a matrix – containing in situ generated nanoscale UHTC such as nanoTiC25 or nanoTiN.26
Herein, the synthesis and processing of porous nanocomposites consisting of TiC nanocrystals which are in situ generated in a SiC matrix upon modification of preceramic polymers with Ti-containing precursors (tetrakis(dimethylamino)titanium, Ti[N(CH3)2]4) is addressed. As a preceramic polymer, we have selected a commercially available polysilazane, Durazane® 1800, which is well known to produce silico carbonitride (SiCN) ceramics27,28 at intermediate temperatures and form SiC at higher temperatures because of the occurrence of carbothermal reduction reactions releasing nitrogen while developing the porosity of the material. The schematic representation of our approach is described in Fig. 1. The material has been characterized at each step of the process and we propose extensive chemical, structural and textural characterizations of the final nanocomposites. As a proof of concept, their spectral selectivity has been investigated at room temperature.
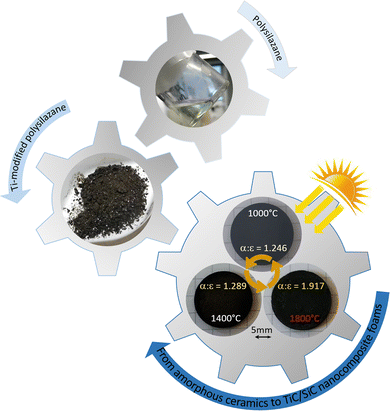 | ||
| Fig. 1 Schematic diagram of the general process of designing SiC-based nanocomposite foams from Ti-modified polysilazanes and the provided chemical, structural and optical fingerprints. | ||
Experimental
Materials
The synthesis of the precursor is carried out in a purified argon atmosphere passing through a column of phosphorus pentoxide and then through a vacuum/argon line by means of standard Schlenk techniques. The cleaned glassware is stored in an oven at 95 °C overnight before being connected to the vacuum/argon line, assembled and pumped under vacuum for 30 min and then filled with argon. All chemical products are handled in an argon-filled glove box (Jacomex, Campus-type; O2 and H2O concentrations kept at ≤0.1 ppm and ≤0.8 ppm, respectively). Toluene (99.85%, Extra Dry over Molecular Sieve, AcroSeal(R)) was purchased from Acros Organics™. The Durazane® 1800 labeled here PSZ was provided in a 5L container by Merck company, Germany, stored in a fridge and used as-received. Anal. found (wt%): Si, 41.3; C, 27.3; N, 22.7; H, 8.3; O, 0.4. [Si11.0C1.5N1.1H5.5]n (normalized to total 100 wt% (total of wt% was 98.9 wt%) and referenced to Si1.0. Oxygen content (below 2 wt%) was omitted in the empirical formulae). FTIR (ATR/cm−1): ν(N–H) = 3381 (s), ν(C–H in vinyl) = 3058 (m), ν(C–H in methyl) = 2954 (s), 2902 (m) and 2848 (w), ν(Si–H) = 2123 (s), δ(C![[double bond, length as m-dash]](https://www.rsc.org/images/entities/char_e001.gif) C) = 1594 (w), δ(
C) = 1594 (w), δ(![[double bond, length as m-dash]](https://www.rsc.org/images/entities/char_e001.gif) C–H) = 1405 (w), δ(Si–CH3) = 1251 (m), δ(N–H): 1169 (s), δ(C
C–H) = 1405 (w), δ(Si–CH3) = 1251 (m), δ(N–H): 1169 (s), δ(C![[double bond, length as m-dash]](https://www.rsc.org/images/entities/char_e001.gif) C/
C/![[double bond, length as m-dash]](https://www.rsc.org/images/entities/char_e001.gif) CH2) = 947 (w), ν(N–Si–N) = 897 (vs), δ(Si–CH3) = 787 (m); 1H NMR (300 MHz, CDCl3, δ/ppm): 0.4–0.1 (br, SiCH3), 1.1–0.5 (br, NH), 4.9–4.4 (br, SiH), 6.3–5.7 (br, vinyl). Tetrakis(dimethylamino)titanium (Ti[N(CH3)2]4, 99.99% trace metal basis) was obtained from Acros Organics™, stored in a fridge and used without further purification. It is labeled TDMAT.
CH2) = 947 (w), ν(N–Si–N) = 897 (vs), δ(Si–CH3) = 787 (m); 1H NMR (300 MHz, CDCl3, δ/ppm): 0.4–0.1 (br, SiCH3), 1.1–0.5 (br, NH), 4.9–4.4 (br, SiH), 6.3–5.7 (br, vinyl). Tetrakis(dimethylamino)titanium (Ti[N(CH3)2]4, 99.99% trace metal basis) was obtained from Acros Organics™, stored in a fridge and used without further purification. It is labeled TDMAT.
Precursor synthesis
The reaction between PSZ and TDMAT occurs at toluene reflux in a three-neck round-bottom flask. In a typical experiment, 2.8 g of TDMAT (8.10 mmol) are quickly added with a syringe under flowing argon to a solution of 2.7 g of PSZ (41.2 mmol referred to the theoretical monomeric unit of the polymer) in 80 mL of toluene at RT under vigorous stirring. Then, the temperature is increased up to toluene reflux under static argon and kept at this temperature under vigorous stirring for three days. After cooling down, the solvent is extracted via an ether bridge (100 °C/0.1 mbar) to release an air- and moisture-sensitive titanium-modified PSZ labeled PSZTi5 (5 being the Si![[thin space (1/6-em)]](https://www.rsc.org/images/entities/char_2009.gif) :
:![[thin space (1/6-em)]](https://www.rsc.org/images/entities/char_2009.gif) Ti ratio) that appears as a brownish-black powder. Anal. Found (wt%): Si 30.1, Ti 10.2, C 29.4, N 21.2, H 7.5, O 1.6. [Si1.0Ti0.2C2.3N1.4H6.9]n (normalized to total 100 wt % (total of wt% was 99.2 wt%) and referenced to Si1.0 and oxygen content (below 2 wt%) was omitted in the empirical formulae). FTIR (ATR/cm−1): ν(N–H) = 3384 (w), ν(C–H in vinyl) = 3046 (m), ν(C–H in methyl) 2960 (s) and 2893 (m), ν(C–H in methylamino groups): 2848 (s), 2789 (s), ν(Si–H) = 2121 (s), ν(C
Ti ratio) that appears as a brownish-black powder. Anal. Found (wt%): Si 30.1, Ti 10.2, C 29.4, N 21.2, H 7.5, O 1.6. [Si1.0Ti0.2C2.3N1.4H6.9]n (normalized to total 100 wt % (total of wt% was 99.2 wt%) and referenced to Si1.0 and oxygen content (below 2 wt%) was omitted in the empirical formulae). FTIR (ATR/cm−1): ν(N–H) = 3384 (w), ν(C–H in vinyl) = 3046 (m), ν(C–H in methyl) 2960 (s) and 2893 (m), ν(C–H in methylamino groups): 2848 (s), 2789 (s), ν(Si–H) = 2121 (s), ν(C![[double bond, length as m-dash]](https://www.rsc.org/images/entities/char_e001.gif) C) = 1591 (w), δ(CH3) = 1457 (m), δ(CH2) = 1401 (s), ν(C–N) = 1294 (m), δ(Si–CH3) = 1255 (s), δ(N–H): 1176 (s), νas(NC2) = 994 (m), νs(NC2) = 951 (w), ν(N–Si–N) = 897 (vs), δ(Si–CH3): 787 (m), ν(Ti–N) = 590 (w).
C) = 1591 (w), δ(CH3) = 1457 (m), δ(CH2) = 1401 (s), ν(C–N) = 1294 (m), δ(Si–CH3) = 1255 (s), δ(N–H): 1176 (s), νas(NC2) = 994 (m), νs(NC2) = 951 (w), ν(N–Si–N) = 897 (vs), δ(Si–CH3): 787 (m), ν(Ti–N) = 590 (w).
Precursor processing
The as-synthesized polymer is placed in alumina boats to be introduced in a sealed tube under an argon atmosphere to prevent any oxygen contamination of the sample during the transfer to the furnace. The polymeric powders is then introduced under an argon flow into a silica tube from a horizontal furnace (Carbolite BGHA12/450B). The tube is evacuated (0.1 mbar) for 30 min and refilled with argon (99.995%) to atmospheric pressure. Subsequently, the samples are subjected to a cycle of ramping of 5 °C min−1 to 1000 °C in flowing argon (dwelling time of 2 h at 1000 °C). A constant flow (120 mL min−1) of argon is passed through the tube during the pyrolysis cycle. After cooling under an argon atmosphere, samples are stored in a glove-box for characterization. Samples are labeled PSZTi5_10 with 10 being the two first digits of the temperature at which the polymer has been exposed. For higher temperature investigations (T > 1000 °C), the as-pyrolyzed samples are subsequently introduced in a graphite furnace (Nabertherm VHT-GR) to be pumped under vacuum (0.1 mbar), refilled with argon and maintained under a constant flow of argon (200 mL min−1) during the whole heat treatment. The program consisted of a 5 °C min−1 heating ramp up to the maximum temperature fixed in the range 1400–1800 °C, dwelling at the selected temperature for 2 h and cooling down to RT at 5 °C min−1. The samples are labeled PSZTi5-T with T being the two first digits of the temperature at which the polymer had been exposed (14 for 1400, 16 for 1600 and 18 for 1800 °C).In order to design foams, PSZTi5 is introduced in a sealed stainless-steel bowl in the glove-box to be then ball milled at 200 rpm for 40 min. Then, 1 g of each of the ball-milled PSZTi5 powder is introduced in a heated steel die (AINT-25-H with a 25 mm internal diameter) in the glove-box then uniaxially pressed using a Specac Atlas Autotouch Press-40T at 80 MPa and heated to the set temperature (80 °C) at a heating rate of 5 °C min−1. The selected temperature and pressure are held for 0.5 h. The pressure applied on the samples is then slowly deloaded during cooling down to RT within 1 h. Typical dimensions of the cylindrical green bodies are of a diameter of 25 mm and a thickness of 1.5 mm. The pyrolysis procedure differs from those applied for powders: the pelleted samples are subjected to a cycle of ramping of 1 °C min−1 to 1000 °C, dwelling there for 2 h, and then cooling down to RT at 2 °C min−1. The high temperature treatment procedure matches that applied for powders.
Characterization
As the polymers are reactive towards moisture and oxygen, the following sample preparations were performed within a glove box. The chemical structure of polymers was determined by transmission FTIR spectroscopy using a Nicolet Magna 550 Fourier transform-infrared spectrometer. 1H NMR data of PSZ solutions in CDCl3 were obtained using a Bruker AM 300 spectrometer operating at 300 MHz. Tetramethylsilane (TMS) was used as a reference for the NMR data. Solid-state 13C CP MAS and 29Si MAS NMR spectra of solid samples were recorded on a Bruker AVANCE 300 spectrometer (7.0 T, ν0(1H) = 300.29 MHz, ν0(13C) = 75.51 MHz, ν0(29Si) = 59.66 MHz) using a 4 mm Bruker probe at a spinning frequency of 10 kHz. 13C CP MAS experiments were recorded with ramped-amplitude cross-polarization in the 1H channel to transfer magnetization from 1H to 13C. (Recycle delay = 3 s, CP contact time = 1 ms, optimized 1H spinal-64 decoupling.) Single pulse 29Si MAS NMR spectra were recorded with a recycle delay of 60 s. Chemical analyses of the polymers were performed by hot gas extraction techniques using a Horiba Emia-321V for carbon content and using a Horiba EMGA-830 for oxygen, nitrogen and hydrogen contents. The Si and Ti contents of the polymer have been measured at Mikroanalytisches Labor Pascher (Remagen, Germany). Thermogravimetric analyses (TGA) of samples were performed in flowing argon at 5 °C min−1 in a two-step process. The first step has been achieved up to 1000 °C using alumina crucibles at ambient atmospheric pressure (STA 449 F3, Netzsch GmbH, Selb, Germany) coupled with a mass spectrometer (Omnistar, Pfeiffer Vacuum GmbH, Asslar, Germany) at the outlet. The second step consisted to pyrolyze samples heat-treated at 1000 °C in a tungsten carbide crucible up to 1800 °C using a Setaram, Setsys apparatus. Elemental analyses of the pyrolyzed powders were carried out by EDS as well as by hot gas extraction techniques for carbon content using a Horiba Emia-321V and for oxygen, nitrogen and hydrogen contents using a Horiba EMGA-830. The Si and Ti contents of the pyrolyzed powders were determined by Inductively Coupled Plasma-Optical Emission Spectrometry (ICP-OES) using a PerkinElmer Optima 8300 instrument. The phase composition of ceramic samples was determined by XRD analyses (Bruker AXS D8 Discover, CuKα radiation, Billerica, Massachusetts, USA). The scans were performed in the range of 2θ ∈ 〈20°; 90°〉 with a step of 0.015° and an exposure time of 0.7 s. The diffractograms were analyzed using the Diffrac + EVA software with the JCPDS-ICDD database. Raman spectroscopy microanalyses were carried out with a Renishaw InViaReflex using 2 excitation laser wavelengths of 532 nm and 785 nm. The density of nanocomposite objects was investigated by hydrostatic weighing and compared to those of crushed powders studied by Helium pycnometry (Micromeritics, AccucPyc II 1340). Polished-bulk materials and also powders were observed using a JEOL IT300 scanning electron microscope. These microstructural observations were completed by chemical analyses using an Oxford X-ray dispersive spectrometer (EDX). Further observation on powders was done by transmission electron microscopy (TEM) with a JEOL JEM 2100F. Two spectrophotometers were used to measure the total spectral reflectance of the bulk samples at room temperature. Over the wavelength range from 0.25 to 2.5 μm, the near-normal (8°) hemispherical reflection spectrum was acquired using a Shimadzu UV-3600 UV-vis-NIR spectrophotometer equipped with an integrating sphere BaSO4 coating of 60 mm diameter. Over the wavelength range from 2.5 μm to 16 μm, the hemispherical directional reflectance (R ∩, θ) was recorded using a PerkinElmer Spectrum 100 spectrophotometer with an integrating sphere gold coating of 150 mm diameter. A mathematical treatment (Mathematica software) was used to get access to the final optical parameters such as the thermal emittance ε (in the infrared region; also referred to as spectrally averaged emissivity) and the solar absorptance α (in the UV-visible-near infrared regions; also referred to as spectrally averaged absorptivity) from the spectroscopy data, by using eqn (1) and (2), respectively: | (1) |
 | (2) |
Results and discussion
Synthesis and pyrolysis of Ti-modified polysilazanes
As displayed in Fig. 2a, the ATR-FTIR spectrum of PSZ shows the expected absorption bands of polysilazane; firstly, attributed to –Si–NH–Si– groups such as the N–H stretching at 3381 cm−1 and the vibration of the –NH unit bridging two silicon atoms at 1169 cm−1.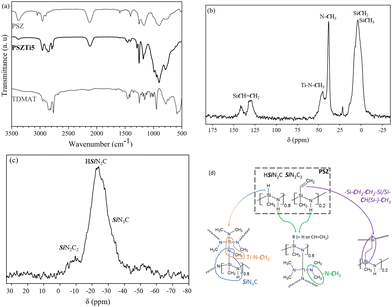 | ||
| Fig. 2 (a) FTIR spectrum of PSZ, TDMAT and PSZTi5, (b) 13C CP MAS and (c) 29Si MAS NMR spectra of PSZTi5 and (d) chemical environments identified in PSZTi5. | ||
It also highlights the typical bands of preceramic polymers containing (i) vinyl silyl groups (CH2 = CH–Si–) via the bands attributed to C–H vibrations at 3058 cm−1, C![[double bond, length as m-dash]](https://www.rsc.org/images/entities/char_e001.gif) C stretching at 1594 cm−1, and scissoring of terminal methylene at 1404 cm−1, (ii) Si-methyl groups with two bands located at 2954 and 2902 cm−1 and assigned to the C–H stretching and one more intense band at 1251 cm−1 (δ(Si–CH3)) and (iii) Si–H groups through the strong absorption band at 2123 cm−1. The largest bands in the 1000–500 cm−1 range can be attributed to Si–N stretching in Si–N–Si units at 897 cm−1 and Si–C bond stretching at 787 cm−1 overlapping – in part – the deformation of vinyl and Si–H units.
C stretching at 1594 cm−1, and scissoring of terminal methylene at 1404 cm−1, (ii) Si-methyl groups with two bands located at 2954 and 2902 cm−1 and assigned to the C–H stretching and one more intense band at 1251 cm−1 (δ(Si–CH3)) and (iii) Si–H groups through the strong absorption band at 2123 cm−1. The largest bands in the 1000–500 cm−1 range can be attributed to Si–N stretching in Si–N–Si units at 897 cm−1 and Si–C bond stretching at 787 cm−1 overlapping – in part – the deformation of vinyl and Si–H units.
A marked decrease in the intensity of absorption bands corresponding to N–H groups in –Si–NH–Si– units is observed in the ATR-FTIR spectrum of PSZTi5 while new bands related to TDMAT can be detected in the wavenumber ranges of 2880–2725 cm−1 and 1500–1425 cm−1. They can be attributed to –N(CH3)x (1 ≤ x ≤ 3) units and more particularly to the C–H vibrations and deformation in such units, respectively. These results suggest the successful incorporation of Ti in the PSZ backbone via the reaction between TDMAT and NH groups in PSZ. Additionally, a decrease in the intensity of the band related to Si–H bonds is also observed, while the absorption bands at 3058 and 1594 cm−1 attributed to the vinyl groups strongly decreased in intensity. If considering both units, this could be explained by hydrosilylation reactions between Si–H and –Si–CH![[double bond, length as m-dash]](https://www.rsc.org/images/entities/char_e001.gif) CH2. Although the hydrosilylation reaction usually takes place above 120 °C in pure polysilazanes,29 previous works showed that the presence of inorganic catalysts such as transition metals or metal complexes could remarkably lower this reaction temperature.25,30–32 However, taken separately, this can also reflect the reaction of Si–H units with TDMAT while vinyl groups polymerize.
CH2. Although the hydrosilylation reaction usually takes place above 120 °C in pure polysilazanes,29 previous works showed that the presence of inorganic catalysts such as transition metals or metal complexes could remarkably lower this reaction temperature.25,30–32 However, taken separately, this can also reflect the reaction of Si–H units with TDMAT while vinyl groups polymerize.
The chemical structure of PSZTi5 was further established by 13C and 29Si solid-state NMR spectroscopy (Fig. 2b and c). The cross-polarization (CP) technique has been used for 13C-NMR experiments to obtain spectra with reasonable acquisition times and signal-to-noise ratios. The solid-state 13C CP MAS NMR spectrum of PSZTi5 (Fig. 2b) exhibits signals generally observed with titanium-modified polysilazane.33 The very broad signal emerging around 3 ppm with shoulders present around 6 and 14 ppm is typical of carbon atoms of aliphatic groups bonded to a silicon atom, i.e., –SiCHx (1 ≤ x ≤ 3).34,35 The resonances at 39 and 45 ppm are assigned to –TiNCH3 groups in N2Si(CH3)–N(CH3)–TiN3 units – thus indicating the occurrence of the reaction between the silicon center of PSZ and –N(CH3)2 groups in TDMAT with the concomitant evolution of methane – and in Si2N–TiN3 units, respectively.25,33 Signals at 124 and 138 ppm are attributed to the carbon of the vinyl groups present in PSZ which tend to demonstrate that hydrosilylation – suggested by FTIR – is uncomplete during the synthesis of the PSZTi5 sample. This means that the decrease of the intensity of the Si–H band in the spectrum of PSZTi5 is most probably ascribed to both the reaction between the silicon center of PSZ and –N(CH3)2 groups in TDMAT, hydrosilylation reaction and vinyl polymerization. The 29Si MAS spectrum of the PSZTi5 sample (Fig. 2c) is composed of a main broad resonance at around −24 ppm that can be assigned to HSiN2C environments, i.e., CH3–Si(H)N2 units as present in PSZ.34,35 In addition, there are two shoulders at around −9 ppm and −35 ppm that can be attributed to SiN2C2 and SiN3C environments, respectively. These results confirm the chemical reaction between TDMAT and PSZ via two main mechanisms as proposed in Fig. 2d.
Our findings are in line with recently proposed mechanisms for the reaction of polycarbosilanes (Si–H) and polysilazanes (Si–H and N–H) with –N(R)2 (R = CH3 and/or CH2CH3) ligands of the TM precursors (with TM = Ti, Zr and Hf).36,37 The proposed reaction mechanisms also agree with our previous report on the mechanism involved in the reaction of polysilazanes with TDMAT25,33 although, in the present paper, the hydrosilylation reaction seems to be more limited most probably because of a too low Ti content in PSZTi5 ([Si1.0Ti0.2C2.2N1.4H6.7]n; oxygen content in the sample is 1.6 wt% and can be therefore neglected). Compared to the chemical formula of PSZ ([Si1.0C1.5N1.1H5.5]n (oxygen content in the sample is 0.4 wt% and can be therefore neglected), the elemental analysis data (Table 1) of PSZTi5 confirms the successful incorporation of Ti in the backbone of PSZ in agreement with the fixed Si![[thin space (1/6-em)]](https://www.rsc.org/images/entities/char_2009.gif) :
:![[thin space (1/6-em)]](https://www.rsc.org/images/entities/char_2009.gif) Ti ratio (5) and especially the presence of –Ti(NCH3)x (x = 1, 2) groups according to the increase of the carbon, nitrogen and hydrogen contents. The successful incorporation of –Ti(NCH3)x (x = 1, 2) groups modifies the chemical environment around Si and N as schematically shown in Fig. 2d. It is expected to increase the crosslinking degree of PSZ (x = 1) while forming side groups which are more likely to be released in the early stage of the thermo-chemical conversion of the precursors into nanocomposites (x = 2).
Ti ratio (5) and especially the presence of –Ti(NCH3)x (x = 1, 2) groups according to the increase of the carbon, nitrogen and hydrogen contents. The successful incorporation of –Ti(NCH3)x (x = 1, 2) groups modifies the chemical environment around Si and N as schematically shown in Fig. 2d. It is expected to increase the crosslinking degree of PSZ (x = 1) while forming side groups which are more likely to be released in the early stage of the thermo-chemical conversion of the precursors into nanocomposites (x = 2).
Conversion of Ti-modified polysilazanes into nanocomposites
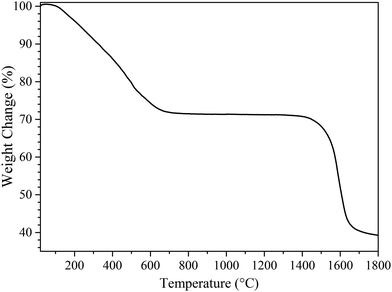
Our previous expectations are confirmed by following the weight changes of the precursors upon heat-treatment to 1800 °C by TG analysis (Fig. 3). For comparison, the TG curve of PSZ is given in the ESI† (see Fig. S1 in the ESI†). It shows that the weight changes of PSZTi5 occur through a two-step process: (1) from room temperature (RT) to 1000 °C and (2) from 1400 to 1800 °C. Thus, in this section, we split our results and discussion into 2 parts related to each domain of temperature in which a weight loss has been identified on the TG curve (Fig. 3).RT to 1000 °C
In this part, we discuss the thermochemical conversion of the PSZTi5 sample up to 1000 °C in flowing argon. PSZTi5 showed a weight loss decreased by 5% compared to PSZ (67%) as recorded at 1000 °C.The main difference between the two polymers occurs in the low temperature regime of the TG experiments in which volatilization of low molecular weight species takes place with PSZ. As expected, the formation of –Si–N(R)–Ti– (R = CH3 or Si≡) units in PSZTi5 upon chemical modification of PSZ with TDMAT tends to reduce the segment mobility of oligomeric chains; thus, limiting volatilization of small oligomeric fragments in the low temperature regime of the polymer-to-ceramic conversion. As a consequence, PSZTi5 exhibits a reduced weight loss after decomposition at 1000 °C compared to PSZ. However, this reduced weight loss is somewhat limited most probably due to the presence of pendant groups in the form of –Ti[(NCH3)2]x (x = 1, 2 or 3) units that tend to be easily released as dimethylamine upon pyrolysis.
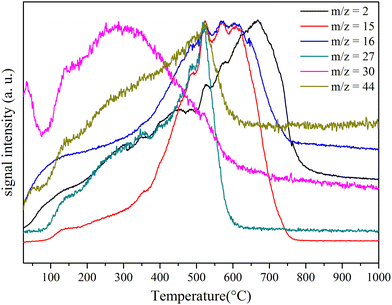
Indeed, MS (Fig. 4) demonstrated that the decomposition of PSZTi5 is accompanied with the evolution of gaseous H2 (m/z = 2), CH4 and/or NH3 (m/z = 15 and 16), ethane (m/z = 27), methylamine (m/z = 30) and dimethylamine (m/z = 44). The evolution of amine derivatives, i.e., methylamine and dimethylamine, occurred earlier in the process whereas NH3 and/or CH4 evolutions preferentially occurred at intermediate temperatures. Amine release indicates condensation reaction between as-formed –NCH3– bridges in N2Si(CH3)–N(CH3)–TiN3 units and –N(CH3)2 groups in pendant –Ti[(NCH3)2]x (x = 1, 2 or 3) groups with residual N–H units. They represent a continuation of the reaction which occurred during the PSZTi5 synthesis. NH3 evolution corresponds to the transamination reaction while the CH4 evolution originates from the decomposition of Si–CH3. The evolution of H2 indicates the occurrence of dehydrocoupling reactions (low temperature) as well as recombination of radicals (higher temperature) and allows forming the ceramic network labelled PSZTi5_10 after heat-treatment at 1000 °C under argon.
The 29Si MAS NMR spectrum (Fig. 5a) of the PSZTi5_10 sample shows a large signal ranging from 0 to −50 ppm indicating a distribution of SiCxN4−x (0 ≤ x ≤ 4) units. It can nonetheless be noticed that the main peak is centered at −48 ppm corresponding to a predominant SiN4 environment. In parallel, the X-ray diffractogram reveals that PSZTi5_10 is poorly crystallized as shown by the diffuse peaks identified in the XRD pattern (Fig. 5b). They indicate the slow nucleation of face-centered cubic (fcc) TiCxN1−x (0 ≤ x ≤ 1) (ICDD PDF number: 00-042-1488) – which represents the complete solid solution between TiC (ICDD PDF: 00-032-1383) and TiN (ICDD PDF: 00-038-1420) – according to the presence of reflections at 2θ around 36.7° (111), 42.1° (200) and 61.5° (220). Raman spectroscopy (Fig. 5c) allows distinguishing the bands of the defect-induced D (originates from the breathing mode A1g of the sp2 rings) and graphitic G bands (arises from the stretching mode E2g of the sp2 C–C bonds) at ∼1355 cm−1 and ∼1590 cm−1, respectively.38
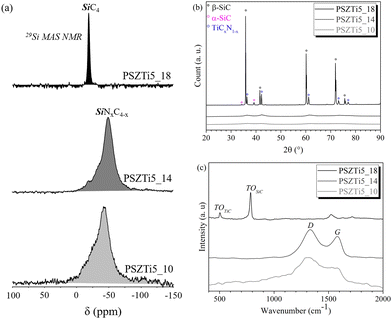 | ||
| Fig. 5 (a) 29Si MAS NMR spectra, (b) XRD patterns and (c) Raman spectra of PSZTi5_X samples with X = 10, 14 and 18. | ||
The presence of free carbon is confirmed through the determination of the chemical formula (Si1.0Ti0.2C1.3N1.4H0.2) of PSZTi5_10 (Table 2) allowing calculating the phase content in the sample: TiN (17 wt%), Si3N4 (57.6 wt%), SiC (5.4 wt%) and sp2 C (20 wt%) phases.
| Samples | Ti (wt%) | Si (wt%) | C (wt%) | N (wt%) | O (wt%) | H (wt%) | Chemical formulab |
|---|---|---|---|---|---|---|---|
| a Measured by EDX. b Because of its low content (<2 wt%), oxygen has been omitted in the chemical formula. | |||||||
| PSZ_10 | — | 43.6 | 19.1 | 23.2 | 0.2 | 1.1 | Si1.0C1.0N1.1H0.7 |
| PSZTi5_10 | 14.3 | 37.9 | 20.2 | 26.0 | 1.4 | 0.2 | Si1.0Ti0.2C1.3N1.4H0.2 |
| PSZTi5_14 | 18.7a | 40.8a | 14.9 | 24.2 | 1.4 | — | Si1.0Ti0.3C0.9N1.2 |
| PSZTi5_18 | 15.8a | 55.3a | 27.4 | 1.3 | 0.2 | — | Si1.0Ti0.2C1.1N0.04 |
Analyses showed that the Si![[thin space (1/6-em)]](https://www.rsc.org/images/entities/char_2009.gif) :
:![[thin space (1/6-em)]](https://www.rsc.org/images/entities/char_2009.gif) Ti ratio fixed at the polymer level is retained in the ceramic sample prepared at 1000 °C and that the carbon and nitrogen contents increased compared to the reference PSZ_10 sample produced from PSZ under the same pyrolysis conditions. This is clearly due to the introduction of TDMAT in the PSZ network in the early stage of the process which enriches the Si environment with nitrogen and carbon.
Ti ratio fixed at the polymer level is retained in the ceramic sample prepared at 1000 °C and that the carbon and nitrogen contents increased compared to the reference PSZ_10 sample produced from PSZ under the same pyrolysis conditions. This is clearly due to the introduction of TDMAT in the PSZ network in the early stage of the process which enriches the Si environment with nitrogen and carbon.
1400 to 1800 °C
Then, we followed the high temperature behaviour of the PSZTi5 sample by characterizing samples at 1400 °C (PSZTi5_14) and 1800 °C (PSZTi5_18) to be investigated by 29Si solid-state NMR spectroscopy, X-ray diffraction and Raman spectroscopy (Fig. 5).Solid State NMR (Fig. 5a) shows a 29Si MAS NMR spectrum displaying SiN4 units present in the PSZTi5_14 sample (Fig. 5a). The X-ray diffractogram of the PSZTi5_14 sample (Fig. 5b) confirmed the results obtained with the PSZTi5_10 samples: the broad peaks at 2θ around 36.4°, 42.3°, 61.4° and 73.4° are attributed to a TiCxN1−x phase (0 ≤ x ≤ 1). Peaks related to this carbonitride phase are at the mid-position between the two references (i.e., TiC and TiN) that could be approximated by Vegard's law39 to a TiC0.5N0.5 phase. The Raman spectrum (Fig. 5c) confirms the presence of free carbon while elemental analyses show that the nitrogen content of the material is relatively stable compared to the PSZTi5_10 sample. This confirmed that no decomposition occurred in the temperature range 1000–1400 °C as shown by TG experiments (Fig. 3).
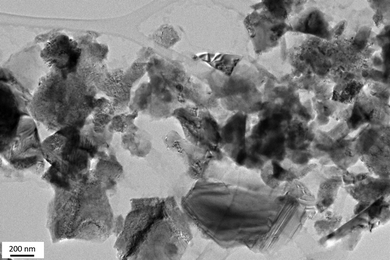
By assessing the phase micro-/nanostructure of the PSZTi5_14 sample by transmission electron microscopy (TEM, Fig. 6), a sample made of homogeneously dispersed small precipitates (appearing as a dark cluster in the TEM image) embedded in a featureless medium characteristic of an amorphous network is delivered. The Selected Area Electron Diffraction (SAED) pattern (insets in Fig. 6) of these small precipitates identifies poorly defined continuous rings which can be nevertheless indexed as the (111), (200) and (220) planes of the TiCxN1−x phase (0 ≤ x ≤ 1) at 0.251, 0.216 and 0.152 nm, respectively. Therefore, the material prepared at 1400 °C can be described as a nanocomposite made of TiCxN1−x nanocrystals surrounded by a poorly defined matrix; most probably made of SiCxN4−x (0 ≤ x ≤ 4) and sp2 carbon phases as identified by solid-state NMR and Raman spectroscopy, respectively.
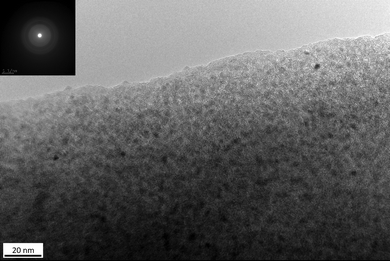 | ||
| Fig. 6 High-resolution TEM image of the surface of the PSZTi5_14 sample with the corresponding selected area electron diffraction pattern as the inset. | ||
Above 1400 °C, Fig. 3 shows that the weight underwent a significant and continuous change up to 1700 °C. The weight loss rate then decreased in the temperature range 1700–1800 °C. Such changes are highlighted by solid-state NMR spectroscopy. The 29Si MAS NMR spectrum of the PSZTi5_18 sample completely changed (Fig. 5a): it is only composed of SiC4 units; thus, indicating a total decomposition of SiCxN4−x (0 ≤ x ≤ 4) units identified in the PSZTi5_10 and PSZTi5_14 samples. This corroborates the XRD results (Fig. 5b): the XRD pattern of the PSZTi5_18 sample identifies β- and α-SiC phases along with a TiCxN1−x (0 ≤ x ≤ 1) which can be assimilated to a TiC0.7N0.3 phase (Vegard law) based on the peak positions at 2θ = 36.4°, 42.2°, 61.1°, 73.2° and 77.0° that shifted towards TiC peak positions. The Raman spectrum of the PSZTi5_18 sample (Fig. 5c) highlights this decomposition since it identifies the TO bands of TiC and β-SiC phases while the absence of the sp2 carbon bands can be noticed. This indicates the complete carbothermal reduction of the Si–N bonds identified in the PSZTi5_14 sample forming Si–C bonds in the PSZTi5_18 sample. Carbothermal reduction reactions induce the evolution of nitrogen (See Table 2) which is responsible of the weight loss recorded by HT-TGA (Fig. 3): a weight loss of 30% has been measured in the temperature range 1400–1800 °C for the PSZTi5_18 sample which fits relatively well the difference in terms of chemical formula between the PSZTi5_10/PSZTi5_14 samples and the PSZTi5_18 sample. Therefore, the material generated at 1800 °C can be considered as a TiC/SiC composite.
The increase of the heat-treatment temperature to 1800 °C (PSZTi5_18 sample) fully changes the local phase micro-/nanostructure of the materials (Fig. 7). The material appears to be highly crystallized with relatively big crystals. Based on the associated EDX spectra in Fig. 8, these crystals are made of Ti and Si elements (top image) and of Si as identified in the down image. Based on EDX results, we can assume that the SAED patterns (inset in Fig. 8) identify SiC (zinc blende type, space group F![[4 with combining macron]](https://www.rsc.org/images/entities/char_0034_0304.gif) 3m, a = 0.436 nm) and TiC (rock-salt type, space group Fm
3m, a = 0.436 nm) and TiC (rock-salt type, space group Fm![[3 with combining macron]](https://www.rsc.org/images/entities/char_0033_0304.gif) m; a = 0.433 nm) which display close crystalline forms and lattice parameters.40 Both SAED patterns are indeed composed of distinct spots that are ascribed to the (111), (200), (220), (311), (222), (400) and (331) planes of the cubic structures of SiC and TiC. In the following section, we investigate the effect of the structural evolution occurring from 1000 to 1800 °C on the optical properties.
m; a = 0.433 nm) which display close crystalline forms and lattice parameters.40 Both SAED patterns are indeed composed of distinct spots that are ascribed to the (111), (200), (220), (311), (222), (400) and (331) planes of the cubic structures of SiC and TiC. In the following section, we investigate the effect of the structural evolution occurring from 1000 to 1800 °C on the optical properties.
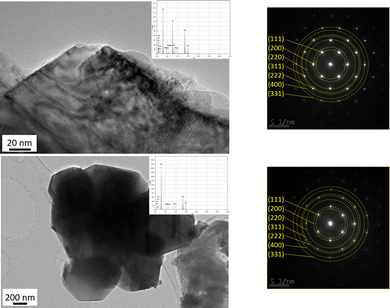 | ||
| Fig. 8 TEM images of the PSZTi5_18 sample with the corresponding EDX spectra selected area electron diffraction patterns identifying (top) TiC and (down) SiC crystals. | ||
Spectral selectivity of nanocomposite foams
As mentioned previously, the PSZTi5 sample is shaped into pellets in order to investigate – as a proof of concept – the optical properties of the derived nanocomposites in the solar spectrum. Thus, we prepared the PSZTi5_T samples (T = 10, 14 and 18) by integrating a warm-pressing (WP) stage after the synthesis of PSZTi5. The PSZTi5 sample exhibits sufficient plasticity to be warm-pressed at 80 °C for 30 min under 80 MPa and form crack-free pieces after pyrolysis at 1000 °C (PSZTi5_10). Then, the samples were heat-treated in the temperature range 1400 °C (PSZTi5_14) – 1800 °C (PSZTi5_18) in flowing argon (see Fig. S2 in the ESI†) to follow the evolution of the textural properties (Table 3) and hemispherical reflectance (Fig. 9) of pellets according to their temperature of preparation. It should be mentioned that pellets display similar XRD patterns to those recorded for powder analogs (see Fig. S3 in the ESI†).| Samples | Powder | Bulk analogs | ||
|---|---|---|---|---|
| ρ He (g cm−3) | ρ a (g cm−3) | ρ b (g cm−3) | O.P. (%) | |
| PSZTi5_10 | 2.38 | 2.40 | 2.59 | 8 |
| PSZTi5_14 | 2.88 | 2.67 | 2.97 | 10 |
| PSZTi5_18 | 3.67 | 1.78 | 3.69 | 52 |
Table 3 gathers the results obtained from the hydrostatic weight of bulk analogs (ρa apparent density, ρb bulk density and O.P. Open Porosity).
As expected, the bulk density increases with the temperature of preparation according to the extended crystallization of the materials. However, data also show that the carbothermal reduction reactions previously discussed involve a very high level of open porosity in the bulk PSZTi5_18 samples indicating that they form foams upon heat-treatment to this temperature. The effect of the temperature of synthesis of these materials on their selectivity which is defined by the absorptance![[thin space (1/6-em)]](https://www.rsc.org/images/entities/char_2009.gif) :
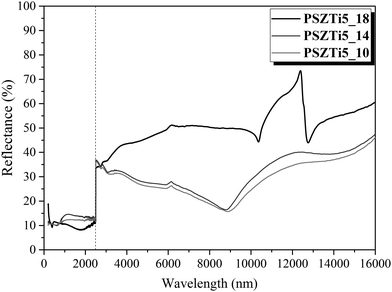
:![[thin space (1/6-em)]](https://www.rsc.org/images/entities/char_2009.gif) emittance ratio41 has been investigated. Absorptance in the solar spectrum wavelength and emittance in the infrared one are both related to hemispherical reflectance by Kirchhoff law. Fig. 9 plots the evolution of the hemispherical reflectance versus the wavelength for the PSZTi_T samples (T = 10, 14 and 18) at room temperature (RT). As expected, the reflectance is very low below λ = 2500 nm and is independent of the temperature of the preparation of the samples. It is close to expectation for an ideal SSA in the solar spectrum. However, the poorly crystallized samples (PSZTi5_10 and PSZTi5_14) have a common non-selective behaviour with a reflectance less than 35% above 2500 nm.
emittance ratio41 has been investigated. Absorptance in the solar spectrum wavelength and emittance in the infrared one are both related to hemispherical reflectance by Kirchhoff law. Fig. 9 plots the evolution of the hemispherical reflectance versus the wavelength for the PSZTi_T samples (T = 10, 14 and 18) at room temperature (RT). As expected, the reflectance is very low below λ = 2500 nm and is independent of the temperature of the preparation of the samples. It is close to expectation for an ideal SSA in the solar spectrum. However, the poorly crystallized samples (PSZTi5_10 and PSZTi5_14) have a common non-selective behaviour with a reflectance less than 35% above 2500 nm.
The increase of the temperature of synthesis of these materials at 1800 °C provides enormous benefits. Below 2500 nm wavelength, the reflectance of the PSZTi5_18 sample is decreased to around 10% and from 2500 to 10![[thin space (1/6-em)]](https://www.rsc.org/images/entities/char_2009.gif) 000 nm, a major increase of the reflectance close to 50% is identified. At 10
000 nm, a major increase of the reflectance close to 50% is identified. At 10![[thin space (1/6-em)]](https://www.rsc.org/images/entities/char_2009.gif) 000 nm, the reflectance evolves through the Christiansen point which is due to absorption mechanisms in the far-infrared range (lattice vibration), causing the material to behave like a blackbody (low reflectance = high emissivity, assuming Kirchhoff's law of radiation).42 Thus, above 10
000 nm, the reflectance evolves through the Christiansen point which is due to absorption mechanisms in the far-infrared range (lattice vibration), causing the material to behave like a blackbody (low reflectance = high emissivity, assuming Kirchhoff's law of radiation).42 Thus, above 10![[thin space (1/6-em)]](https://www.rsc.org/images/entities/char_2009.gif) 000 nm, the reflectance profile is characteristic of a highly crystallized SiC phase43 in the PSZTi5_18 sample.
000 nm, the reflectance profile is characteristic of a highly crystallized SiC phase43 in the PSZTi5_18 sample.
The highly crystallized SiC phase in the PSZTi5_18 sample leads to a higher hemispherical reflectance above 2500 nm and therefore a better general selectivity value (Table 4) as calculated from Fig. 9 according to eqn (1) and (2) described in the experimental part. In Table 4, we can clearly observe the contribution of the highly crystalline TiCxN1−x phase which can be assimilated to a TiC phase present in the PSZTi5_18 sample. A RT selectivity of 1.917 has been calculated for the PSZTi5_18 sample.
| Samples | α, absorptance | ε, emittance | α/ε, selectivity |
|---|---|---|---|
| PSZTi5_10 | 0.888 | 0.712 | 1.246 |
| PSZTi5_14 | 0.882 | 0.684 | 1.289 |
| PSZTi5_18 | 0.893 | 0.466 | 1.917 |
| Ideal solar absorbers | 1 | 0 | ∞ |
To our knowledge, this is the highest selectivity reported so far for SiC-based materials.43–45 We should keep in mind that – in addition to the high crystal quality of the nanocomposite – one further parameter – which is not discussed here – can affect the selectivity: the porosity. Although, it is assumed that a porous structure could maximize the absorption of the solar radiation (see introduction), it has been reported that the total hemispherical emissivity can notably increase with the increase of the surface roughness/porosity.46 For instance, an increase of the porosity from 5 to 30 vol% in HfC-based materials led to significant gain of emissivity from 0.4 to 0.55;46 thereby a decrease of the selectivity. As a consequence, this is a property to be further investigated and we can reasonably expect an increase of the RT selectivity if dense materials (as pellets or coatings) can be prepared.
Conclusions
Within the present study, titanium-modified polysilazanes have been synthesized and used as precursors of SiC-based nanocomposites. The chemistry behind the polymer synthesis and pyrolysis was investigated in detail and the high temperature behavior of derived amorphous ceramics was critically followed. The final nano-/microstructure evolved according to the heat-treatment temperature fixed in the range of 1000–1800 °C. The amorphous single-phase ceramics produced at 1000 °C led to nanocrystalline- TiCxN1−x (0 ≤ x ≤ 1)/amorphous-SiCxN4−x (0 ≤ x ≤ 4) nanocomposites after heat-treatment at 1400 °C. In the temperature range of 1400–1800 °C, a large weight loss occurred in the samples involving the release of nitrogen to form highly crystallized nanocomposite foams composed of TiCxN1−x (0 ≤ x ≤ 1) and SiC crystals with free carbon. The highest optical selectivity is reached with the samples prepared at 1800 °C, which is the result of the presence of the TiCxN1−x (0 ≤ x ≤ 1) crystals confined in the SiC matrix. The RT selectivity of these nanocomposites of 1.917 is even the highest reported for SiC-based materials despite the fact that the sample is highly porous. Thus, there is still room for further studies on optimizing the optical selectivity (not only at room temperature) of these materials by considering specific process parameters that can contribute to increase the TiC(N) volume fraction while decreasing the porosity. These opportunities are now being addressed. It can be reasonably anticipated that this will lead to SiC-based nanocomposites with a high optical selectivity.Author contributions
MB and MC contributed equally to this work by synthesizing the materials, carrying out characterizations, analyzed and discussed the experimental data, prepared and drew the images and graphics for the publication and wrote the first draft of the manuscript. CG, AJ and XD performed selected characterization (solid-state NMR spectroscopy (CG) and optical measurements (AJ & XD)). SB (supervisor of MB and MC) supervised this research project, assisted in the material syntheses, contributed to the experimental design and data interpretation and reviewed the paper.Conflicts of interest
There are no conflicts to declare.Acknowledgements
Dr Samuel Bernard, Dr Maxime Balestrat, and Dr Xavier Deschanels acknowledge Agence Nationale de la Recherche (ANR) for supporting this work through the Carapass project (PhD thesis of Maxime Balestrat, Project No. ANR-16-CE08-0026-01). Dr Samuel Bernard thanks the Nouvelle-Aquitaine region and CTTC for the financial support of the PhD thesis of Maxime Cheype.Notes and references
- Q. Chen, Y. Wang, J. Zhang and Z. Wang, Energies, 2020, 13, 1988 CrossRef.
- F. Cao, K. McEnaney, G. Chen and Z. Ren, A review of cermet-based spectrally selective solar absorbers, Energy Environ. Sci., 2014, 7, 1615–1627 RSC.
- L. Noč and I. Jerman, Sol. Energy Mater. Sol. Cells, 2022, 238, 111625 CrossRef.
- J. Mandal, D. Wang, A. C. Overvig, N. N. Shi, D. Paley, A. Zangiabadi, Q. Cheng, K. Barmak, N. Yu and Y. Yang, Adv. Mater., 2017, 29, 1702156 CrossRef PubMed.
- C. E. Kennedy, Review of Mid- to High-Temperature Solar Selective Absorber Materials, National Renewable Energy Lab., Golden, CO. (US), 2002 Search PubMed.
- J. J. Cuomo, J. F. Ziegler and J. M. Woodall, Appl. Phys. Lett., 1975, 26, 557–559 CrossRef CAS.
- I. Cañadas, V. M. Candelario, G. De Aloysio, J. Fernández, L. Laghi, S. Cuesta-López, Y. Chen, T. J. Marrow, A. Rinaldi, A. M. Sanchez, A. Tatì and C. Testani, Materials, 2021, 14, 4627 CrossRef PubMed.
- M. J. H. Balat, J. Eur. Ceram. Soc., 1996, 16, 55–62 CrossRef CAS.
- C. Verdon, O. Szwedek, A. Allemand, S. Jacques, Y. Le Petitcorps and P. David, J. Eur. Ceram. Soc., 2014, 34, 879–887 CrossRef CAS.
- E. Sani, L. Mercatelli, F. Francini, J.-L. Sans and D. Sciti, Scr. Mater., 2011, 65, 775–778 CrossRef CAS.
- E. Sani, L. Mercatelli, P. Sansoni, L. Silvestroni and D. Sciti, J. Renewable Sustainable Energy, 2012, 4, 033104 CrossRef.
- E. Sani, L. Mercatelli, J.-L. Sans, L. Silvestroni and D. Sciti, Opt. Mater., 2013, 36, 163–168 CrossRef CAS.
- V. Ern and A. C. Switendick, Phys. Rev., 1965, 137, A1927–A1936 CrossRef.
- E. Sani, L. Mercatelli, M. Meucci, A. Balbo, L. Silvestroni and D. Sciti, Sol. Energy, 2016, 131, 199–207 CrossRef CAS.
- K. Xu, M. Du, L. Hao, J. Mi, Q. Yu and S. Li, J. Materiomics, 2020, 6, 167–182 CrossRef.
- H. Aréna, M. Coulibaly, A. Soum-Glaude, A. Jonchère, A. Mesbah, G. Arrachart, N. Pradeilles, M. Vandenhende, A. Maitre and X. Deschanels, Sol. Energy Mater. Sol. Cells, 2019, 191, 199–208 CrossRef.
- H. Aréna, M. Coulibaly, A. Soum-Glaude, A. Jonchère, G. Arrachart, A. Mesbah, N. Pradeilles, M. Vandenhende, A. Maître and X. Deschanels, Sol. Energy Mater. Sol. Cells, 2020, 213, 110536 CrossRef.
- B. Du, X. Wang and Z. Zou, Tribol. Lett., 2011, 43, 295–301 CrossRef CAS.
- P. J. Martin, R. P. Netterfield, W. G. Sainty and C. G. Pacey, J. Vac. Sci. Technol., A, 1984, 2, 341–345 CrossRef CAS.
- S. Shimada and T. Ishil, J. Am. Ceram. Soc., 1990, 73, 2804–2808 CrossRef CAS.
- S. Shimada, Solid State Ionics, 2002, 149, 319–326 CrossRef CAS.
- A. Onuma, H. Kiyono, S. Shimada and M. Desmaison, Solid State Ionics, 2004, 172, 417–419 CrossRef CAS.
- M. C. Bechelany, A. Lale, M. Balestrat, C. Gervais, S. Malo, R. K. Nishihora and S. Bernard, J. Eur. Ceram. Soc., 2022, 42, 4172–4178 CrossRef CAS.
- M. C. Bechelany, V. Proust, A. Lale, M. Balestrat, A. Brioude, C. Gervais, R. K. Nishihora and S. Bernard, J. Eur. Ceram. Soc., 2022, 42, 2135–2145 CrossRef CAS.
- M. Balestrat, A. Lale, A. V. A. Bezerra, V. Proust, E. W. Awin, R. A. F. Machado, P. Carles, R. Kumar, C. Gervais and S. Bernard, Molecules, 2020, 25, 5236–5258 CrossRef CAS PubMed.
- M.-C. Bechelany, V. Proust, C. Gervais, R. Ghisleny, S. Bernard and P. Miele, Adv. Mater., 2014, 26, 6548 CrossRef CAS PubMed.
- A. Lale, A. Wasan, R. Kumar, P. Miele, U. B. Demirci and S. Bernard, Int. J. Hydrogen Energy, 2016, 41, 15477–15488 CrossRef CAS.
- M. Wynn, D. Lopez-Ferber, A. Viard, D. Fonblanc, M. Schmidt, F. Rossignol, P. Carles, G. Chollon, C. Gervais and S. Bernard, Open Ceram., 2021, 5, 100055 CrossRef CAS.
- N. S. Choong Kwet Yive, R. J. P. Corriu, D. Leclercq, P. H. Mutin and A. Vioux, Chem. Mater., 1992, 4, 141–146 CrossRef CAS.
- J. Wang, V. Schölch, O. Görke, G. Schuck, X. Wang, G. Shao, S. Schorr, M. F. Bekheet and A. Gurlo, Open Ceram., 2020, 1, 100001 CrossRef CAS.
- S. Tada, M. D. Mallmann, H. Takagi, J. Iihama, N. Asakuma, T. Asaka, Y. Daiko, S. Honda, R. K. Nishihora, R. A. F. Machado, S. Bernard and Y. Iwamoto, Chem. Commun., 2021, 57, 2057–2060 RSC.
- N. Asakuma, S. Tada, E. Kawaguchi, M. Terashima, S. Honda, R. K. Nishihora, P. Carles, S. Bernard and Y. Iwamoto, Nanomaterials, 2022, 12, 1644–1659 CrossRef CAS PubMed.
- M. C. Bechelany, V. Proust, A. Lale, P. Miele, S. Malo, C. Gervais and S. Bernard, Chem. – Eur. J., 2017, 23, 832–845 CrossRef CAS PubMed.
- D. Fonblanc, D. Lopez-Ferber, M. Wynn, A. Lale, A. Soleilhavoup, A. Leriche, Y. Iwamoto, F. Rossignol, C. Gervais and S. Bernard, Dalton Trans., 2018, 47, 14580–14593 RSC.
- A. Viard, D. Fonblanc, M. Schmidt, A. Lale, C. Salameh, A. Soleilhavoup, M. Wynn, P. Champagne, S. Cerneaux, F. Babonneau, G. Chollon, F. Rossignol, C. Gervais and S. Bernard, Chem. – Eur. J., 2017, 23, 9076–9090 CrossRef CAS PubMed.
- Q. Wen, Y. Xu, B. Xu, C. Fasel, O. Guillon, G. Buntkowsky, Z. Yu, R. Riedel and E. Ionescu, Nanoscale, 2014, 6, 13678–13689 RSC.
- J. Yuan, S. Hapis, H. Breitzke, Y. Xu, C. Fasel, H.-J. Kleebe, G. Buntkowsky, R. Riedel and E. Ionescu, Inorg. Chem., 2014, 53, 10443–10455 CrossRef CAS PubMed.
- M. Balestrat, E. Diz Acosta, O. Hanzel, N. Tessier-Doyen, R. Machado, P. Šajgalík, Z. Lenčéš and S. Bernard, J. Eur. Ceram. Soc., 2020, 40, 2604–2612 CrossRef CAS.
- P. Duwez and F. Odell, J. Electrochem. Soc., 1950, 97, 299–304 CrossRef CAS.
- N. R. Mediukh, V. I. Ivashchenko, P. E. A. Turchi, V. I. Shevchenko, J. Leszczynski and L. Gorb, Calphad, 2019, 66, 101643 CrossRef CAS.
- J. D. Macias, D. M. Herrera-Zamora, F. I. Lizama-Tzec, J. Bante-Guerra, O. E. Arés-Muzio, G. Oskam, H. R.-P. Rubio, J. J. Alvarado-Gil, C. Arancibia-Bulnes, V. Ramos-Sánchez and H. I. Villafán-Vidales, AIP Conf. Proc., 2017, 1850, 120001 CrossRef.
- B. Rousseau, J. F. Brun, D. D. S. Meneses and P. Echegut, Int. J. Thermophys., 2005, 26, 1277–1286 CrossRef CAS.
- M. Coulibaly, G. Arrachart, A. Mesbah and X. Deschanels, Sol. Energy Mater. Sol. Cells, 2015, 143, 473–479 CrossRef CAS.
- E. Sani, L. Mercatelli, D. Jafrancesco, J. L. Sans and D. Sciti, J. Eur. Opt. Soc. Rap. Public., 2012, 7, 12052 Search PubMed.
- X. Xu, Z. Rao, J. Wu, Y. Li, Y. Zhang and X. Lao, Sol. Energy Mater. Sol. Cells, 2014, 130, 257–263 CrossRef CAS.
- E. Sani, L. Mercatelli, J.-L. Sans, L. Silvestroni and D. Sciti, Opt. Mater., 2013, 36, 163–168 CrossRef CAS.
Footnote |
| † Electronic supplementary information (ESI) available. See DOI: https://doi.org/10.1039/d2ma00886f |
| This journal is © The Royal Society of Chemistry 2023 |

