 Open Access Article
Creative Commons Attribution 3.0 Unported Licence
Improving magnesium's corrosion resistance through tannic acid–polyethyleneimine coatings for bioresorbable implant applications
Daniel
 a,
Michael
Leonardo
 a,
Safira Meidina
Nursatya
 c,
Anggraini
Barlian
 d,
Ekavianty
Prajatelistia
 *b and
Hermawan
Judawisastra
 *b
*b
aMaterials Science and Engineering Study Program, Faculty of Mechanical and Aerospace Engineering, Institut Teknologi Bandung, Jl. Ganesha 10, Bandung 40132, Indonesia
bMaterials Science and Engineering Research Group, Faculty of Mechanical and Aerospace Engineering, Institut Teknologi Bandung, Jl. Ganesha 10, Bandung 40132, Indonesia. E-mail: ekavianty@material.itb.ac.id; hermawan.judawisastra@ftmd.itb.ac.id
cBiotechnology Program Study Program, School of Life Sciences and Technology, Institut Teknologi Bandung, Jl. Ganesha 10, Bandung 40132, Indonesia
dBiotechnology Research Group, School of Life Sciences and Technology, Institut Teknologi Bandung, Jl. Ganesha 10, Bandung 40132, Indonesia
First published on 1st March 2023
Abstract
The high corrosion rate of magnesium limits its application as a bioresorbable implant, despite its good biocompatibility. A tannic acid (TA) coating on magnesium has succeeded in increasing the corrosion resistance of magnesium, although the presence of cracks in this coating still limits its effectiveness. This research focuses on the effect of adding polyethyleneimine (PEI) to the TA coating to increase the corrosion resistance of magnesium and its biocompatibility. The TA–PEI coating on magnesium with TA![[thin space (1/6-em)]](https://www.rsc.org/images/entities/char_2009.gif) :
:![[thin space (1/6-em)]](https://www.rsc.org/images/entities/char_2009.gif) PEI weight ratios of 1
PEI weight ratios of 1![[thin space (1/6-em)]](https://www.rsc.org/images/entities/char_2009.gif) :
:![[thin space (1/6-em)]](https://www.rsc.org/images/entities/char_2009.gif) 0, 1
0, 1![[thin space (1/6-em)]](https://www.rsc.org/images/entities/char_2009.gif) :
:![[thin space (1/6-em)]](https://www.rsc.org/images/entities/char_2009.gif) 0.5, 1
0.5, 1![[thin space (1/6-em)]](https://www.rsc.org/images/entities/char_2009.gif) :
:![[thin space (1/6-em)]](https://www.rsc.org/images/entities/char_2009.gif) 1, and 1
1, and 1![[thin space (1/6-em)]](https://www.rsc.org/images/entities/char_2009.gif) :
:![[thin space (1/6-em)]](https://www.rsc.org/images/entities/char_2009.gif) 2, which was achieved by the immersion method, was evaluated by characterizing the composition, morphology, structure, and surface roughness of the coating as well as the deformation mechanism. The corrosion properties and corrosion rate were examined through immersion and electrochemical corrosion tests (potentiodynamic polarization and EIS). Wettability, cell adhesion, and MTT assay tests were carried out as a coating biocompatibility test. The magnesium's surface was successfully covered with the TA–PEI coating, increasing its corrosion resistance and biocompatibility. The increase in the PEI content in the weight ratio of TA
2, which was achieved by the immersion method, was evaluated by characterizing the composition, morphology, structure, and surface roughness of the coating as well as the deformation mechanism. The corrosion properties and corrosion rate were examined through immersion and electrochemical corrosion tests (potentiodynamic polarization and EIS). Wettability, cell adhesion, and MTT assay tests were carried out as a coating biocompatibility test. The magnesium's surface was successfully covered with the TA–PEI coating, increasing its corrosion resistance and biocompatibility. The increase in the PEI content in the weight ratio of TA![[thin space (1/6-em)]](https://www.rsc.org/images/entities/char_2009.gif) :
:![[thin space (1/6-em)]](https://www.rsc.org/images/entities/char_2009.gif) PEI from 1
PEI from 1![[thin space (1/6-em)]](https://www.rsc.org/images/entities/char_2009.gif) :
:![[thin space (1/6-em)]](https://www.rsc.org/images/entities/char_2009.gif) 0 to 1
0 to 1![[thin space (1/6-em)]](https://www.rsc.org/images/entities/char_2009.gif) :
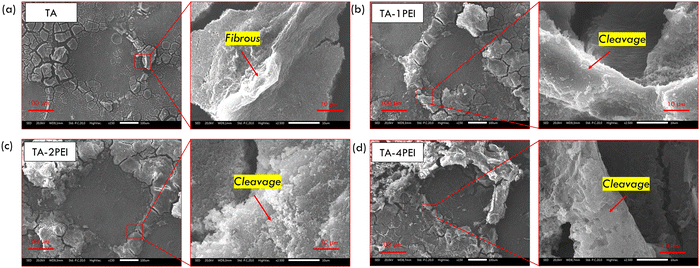
:![[thin space (1/6-em)]](https://www.rsc.org/images/entities/char_2009.gif) 2 resulted in a reduction in the areal crack density from 25.49% to 7.12%, an increase in the coating thickness from 5.7 μm to 9.3 μm, a decrease in the surface roughness from 5.20 μm to 0.98 μm, but a change in the deformation mechanism from ductile to brittle. Adding PEI to TA as a pure magnesium coating has increased the material's corrosion resistance. The changed weight ratio of TA
2 resulted in a reduction in the areal crack density from 25.49% to 7.12%, an increase in the coating thickness from 5.7 μm to 9.3 μm, a decrease in the surface roughness from 5.20 μm to 0.98 μm, but a change in the deformation mechanism from ductile to brittle. Adding PEI to TA as a pure magnesium coating has increased the material's corrosion resistance. The changed weight ratio of TA![[thin space (1/6-em)]](https://www.rsc.org/images/entities/char_2009.gif) :
:![[thin space (1/6-em)]](https://www.rsc.org/images/entities/char_2009.gif) PEI from 1
PEI from 1![[thin space (1/6-em)]](https://www.rsc.org/images/entities/char_2009.gif) :
:![[thin space (1/6-em)]](https://www.rsc.org/images/entities/char_2009.gif) 0 to 1
0 to 1![[thin space (1/6-em)]](https://www.rsc.org/images/entities/char_2009.gif) :
:![[thin space (1/6-em)]](https://www.rsc.org/images/entities/char_2009.gif) 2 is the most optimum ratio because it can reduce the corrosion rate of the material from 3.7 mm year−1 to 0.47 mm year−1. The formation of hydroxyapatite on a corroded material indicates that this system is biocompatible. Increasing the PEI content from 1
2 is the most optimum ratio because it can reduce the corrosion rate of the material from 3.7 mm year−1 to 0.47 mm year−1. The formation of hydroxyapatite on a corroded material indicates that this system is biocompatible. Increasing the PEI content from 1![[thin space (1/6-em)]](https://www.rsc.org/images/entities/char_2009.gif) :
:![[thin space (1/6-em)]](https://www.rsc.org/images/entities/char_2009.gif) 0 to 1
0 to 1![[thin space (1/6-em)]](https://www.rsc.org/images/entities/char_2009.gif) :
:![[thin space (1/6-em)]](https://www.rsc.org/images/entities/char_2009.gif) 2 TA
2 TA![[thin space (1/6-em)]](https://www.rsc.org/images/entities/char_2009.gif) :
:![[thin space (1/6-em)]](https://www.rsc.org/images/entities/char_2009.gif) PEI weight ratio decreased the contact angle from 74° to 24°. At a 1
PEI weight ratio decreased the contact angle from 74° to 24°. At a 1![[thin space (1/6-em)]](https://www.rsc.org/images/entities/char_2009.gif) :
:![[thin space (1/6-em)]](https://www.rsc.org/images/entities/char_2009.gif) 2 TA
2 TA![[thin space (1/6-em)]](https://www.rsc.org/images/entities/char_2009.gif) :
:![[thin space (1/6-em)]](https://www.rsc.org/images/entities/char_2009.gif) PEI ratio, passage 6 HWJ cells can adhere well, and this system has the highest absorbance from the MTT assay result. Both indicate that this coating system has good biocompatibility with human physiochemical systems.
PEI ratio, passage 6 HWJ cells can adhere well, and this system has the highest absorbance from the MTT assay result. Both indicate that this coating system has good biocompatibility with human physiochemical systems.
1. Introduction
Bone is one of the musculoskeletal systems with specific mechanical properties.1–3 The load-bearing capacity of bone is limited; thus, it will fracture when the load exceeds a certain value. However, the bone itself has the ability to regenerate its structure and functionality within 4 months to 1 year.2To realign fractured bones, orthopaedic implants are used to support the regeneration process. Implants must be biocompatible since they are in contact with the living system inside the human body.4–6 Metals, e.g., titanium alloy, chromium–cobalt alloy, and stainless steel, have been developed as bioinert materials. However, there are several downsides to using these bioinert materials. Under several operating conditions, the metals will be dissolved and form toxic ions in the body. The stress shielding effect has also been observed due to a significant difference in the stiffness value between bone and implants.7 Implant patients also need to be operated on twice, insertion and extraction. Thus, a biodegradable material with good biocompatibility and similar stiffness to the bone can be a solution.8
Magnesium (Mg) is a promising biodegradable material since it is abundant in the human body and has a similar stiffness value compared to bone.8,9 Nonetheless, the high degradation rate has limited its use in orthopaedic implants. Premature mechanical loss would likely occur in Mg-based implants before the fractured bone is fully restored.10 To overcome this problem, alloying and coating of Mg can be employed to hinder corrosion.11–47 By adding some alloying elements to magnesium at a specific value, the corrosion resistance of magnesium will enhance. In addition, the mechanical properties will also change. However, this process is complex because alloying should be done in a liquid state while magnesium has high partial pressure, making it easier to form a gas state. If the atmosphere is not being controlled carefully with inert gases, the targeted final composition is hard to achieve.15,21 Compared to alloying Mg, the coating process of pure Mg would be relatively cheap and easily done since pure Mg has sufficient stiffness and strength needed as an orthopaedic implant.48
Tannic acid (TA) is one of the largest natural resources easily found, such as chestnuts and mangroves.49 TA is a polyphenol molecule consisting of abundant catechol groups with ortho-hydroxyl groups. These ortho-hydroxyls make TA suitable for reaction with metals through metal-chelation to form TA–metal complexes.28,50,51 Furthermore, TA is well-known for its biocompatibility because this molecule is hydrolysable, biocompatible, and has superior hemostatic properties due to its ability to react with various proteins.49,52 For these reasons, including its wide range of availability and the facile deposition method through immersion, TA is well developed as a coating material for Mg to enhance corrosion resistance, known as a conversion coating.31,53 The effectiveness of the TA coating in overcoming corrosion resistance has been proven compared to others; however, the morphology of the TA coating is full of cracks which enables fluids such as simulated body fluid (SBF) to penetrate the Mg substrate and cause corrosion.28,31
Nevertheless, TA has excellent adhesiveness, which means that TA can provide intermolecular reactions with nucleophiles, such as a molecule that contains amine bonds.28,31,45,49 Polyethyleneimine (PEI) is a molecule that contains amine groups which means that this molecule can make a linkage with TA. The catechol group will be oxidized and form primary boding with amine groups in PEI, also known as crosslink linkage through Michael-type addition or a Schiff-base reaction.28,50,54,55 This phenomenon could affect the morphology of the coating, that is, reducing the crack density, which means a more solid and uniform coating to give better corrosion protection, as well as improving other properties such as enhancing wettability and facilitating cell adsorption.28
In this research, various TA–PEI coatings were deposited on the Mg substrate, aiming to study the effect of PEI addition on the TA coating and its morphology based on the visual investigation through SEM and corrosion behaviour through immersion and electrochemical tests. Moreover, the biocompatibility based on in vitro tests, cell adhesion, and MTT assay was also investigated in this research.
2. Materials and methods
2.1. Materials
Pure Mg (with an Mg content of 99.3 wt%) was used as the substrate. TA powder (Merck, Germany) and the PEI oligomer (Jinan Future Chemical Co. Ltd, China; Mw = 1300) were used as the coating material. Aqua DM was also used throughout this study as a solvent material.2.2. Synthesis of TA–PEI coatings on pure Mg
A pure Mg surface was first prepared by grinding and polishing. The coating material was prepared by mixing TA and PEI with weight ratios of TA![[thin space (1/6-em)]](https://www.rsc.org/images/entities/char_2009.gif) :
:![[thin space (1/6-em)]](https://www.rsc.org/images/entities/char_2009.gif) PEI of 1
PEI of 1![[thin space (1/6-em)]](https://www.rsc.org/images/entities/char_2009.gif) :
:![[thin space (1/6-em)]](https://www.rsc.org/images/entities/char_2009.gif) 0, 1
0, 1![[thin space (1/6-em)]](https://www.rsc.org/images/entities/char_2009.gif) :
:![[thin space (1/6-em)]](https://www.rsc.org/images/entities/char_2009.gif) 0.5, 1
0.5, 1![[thin space (1/6-em)]](https://www.rsc.org/images/entities/char_2009.gif) :
:![[thin space (1/6-em)]](https://www.rsc.org/images/entities/char_2009.gif) 1, and 1
1, and 1![[thin space (1/6-em)]](https://www.rsc.org/images/entities/char_2009.gif) :
:![[thin space (1/6-em)]](https://www.rsc.org/images/entities/char_2009.gif) 2. Pure Mg was then immersed in the mixture for 5 minutes. After 5 minutes, the coated Mg was dried in ambient air for approximately 1 min. The immersion process was repeated three times in a fresh mixture of TA–PEI at the same time interval. Finally, the coated Mg was dried in ambient air for 24 hours. The sample codification is shown in Table 1.
2. Pure Mg was then immersed in the mixture for 5 minutes. After 5 minutes, the coated Mg was dried in ambient air for approximately 1 min. The immersion process was repeated three times in a fresh mixture of TA–PEI at the same time interval. Finally, the coated Mg was dried in ambient air for 24 hours. The sample codification is shown in Table 1.
| Code | TA (mg/500 mL) | PEI (mg/500 mL) | Weigh ratio | Solvent | Dimensions (cm) |
|---|---|---|---|---|---|
| TA | 2 | 0 | 1![[thin space (1/6-em)]](https://www.rsc.org/images/entities/char_2009.gif) : :![[thin space (1/6-em)]](https://www.rsc.org/images/entities/char_2009.gif) 0 0 |
Aqua DM | 1 × 1 × 0.2 |
| TA–1PEI | 1 | 1![[thin space (1/6-em)]](https://www.rsc.org/images/entities/char_2009.gif) : :![[thin space (1/6-em)]](https://www.rsc.org/images/entities/char_2009.gif) 0.5 0.5 |
|||
| TA–2PEI | 2 | 1![[thin space (1/6-em)]](https://www.rsc.org/images/entities/char_2009.gif) : :![[thin space (1/6-em)]](https://www.rsc.org/images/entities/char_2009.gif) 1 1 |
|||
| TA–4PEI | 4 | 1![[thin space (1/6-em)]](https://www.rsc.org/images/entities/char_2009.gif) : :![[thin space (1/6-em)]](https://www.rsc.org/images/entities/char_2009.gif) 2 2 |
2.3. Chemical structure and surface characterization
After treatment, Fourier transform infrared (FTIR) spectroscopy was used to analyze the functional groups of the coating (Bruker Alpha II, Bandung, Indonesia). The components and morphology of the surface were examined using a scanning electron microscope (SEM) integrated with an energy dispersive spectroscopy system (EDS) (JSM-IT300, Bandung, Indonesia). The areal crack density of the samples was calculated using ImageJ software by identifying percentage areas with a discontinuous coating morphology. EDS line analysis was used to quantify the coating thickness on the coating's cross-section. The coating's thickness was considered a part of the coated material with abundant elements from the coating without any presence of magnesium elements. The border between the coating and the substrate is defined when the amount of magnesium detected from the EDS line analysis suddenly increases. In addition, the deformation mode was also visually examined by SEM after the micro-Vickers hardness test (0.01 HV) was carried out. The surface of coating roughness was measured through the contact (tactile) method (Mitutoyo, Bandung, Indonesia).2.4. Immersion corrosion test and corrosion product analysis
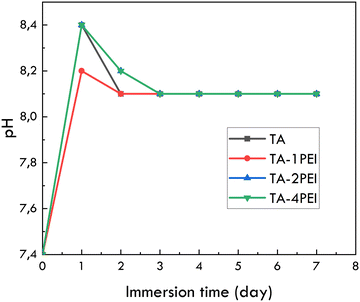
One side of all samples was sealed with tape to expose only one side of the sample (1 cm × 1 cm) to SBF solution as a corrosive fluid representing the human physiological system. The immersion tests of samples were conducted in a chamber that contained simulated body fluid (SBF) solution with pH 7.4 and a temperature of 37 ± 1 °C. Samples were immersed with different intervals of immersion (1 hour, 1 day, 3 days, and 7 days) in a 40 mL SBF for each sample to stabilize the pH solution based on ASTM G31-72. Furthermore, SBF is constantly changed, and pH solutions were also measured every 24 hours. The surface morphology after the immersion test was examined using a scanning electron microscope (SEM) (JSM-IT300, Bandung, Indonesia). Corrosion products were analyzed using an XRD machine (Bruker D8 Advance). The percentage of each phase of the corrosion products was analyzed using MATCH! Software.2.5. Electrochemical corrosion test
One side of all samples was connected to copper wire and sealed with tape to expose only one side of the sample (1 cm × 1 cm) to SBF for both potentiodynamic polarization and electro impedance spectroscopy (EIS) test. The potentiodynamic polarization test was conducted with a three electrode configuration. The samples were connected to the working electrode, graphite to the counter electrode, and saturated calomel to the reference electrode. A potentiodynamic polarization test (VersaSTAT3, Bandung, Indonesia) was only conducted on fresh samples. Meanwhile, an EIS test (Gamry, Bandung, Indonesia) with the same configuration of electrodes was performed on samples immersed at SBF for 1 hour, 1 day, 3 days, and 7 days using 5 mV sinusoidal potential with 100 kHz to 0.01 Hz frequency range.2.6. Water contact angle test
The wettability of the samples was measured using a contact angle test (Dino-Lite, Bandung, Indonesia). Specimens are placed on a flat horizontal surface and subjected to one drop of water through a pipette. The angle formed between the water and specimens was then captured using a camera integrated with DinoCapture 2.0 software. To ensure repeatability, all tests were repeated three times.2.7. Cell adhesion and MTT assay test
Passage 6 human Wharton's jelly mesenchymal stem cells (HWJ-MSCs) were used in this experiment. DMEM (Dulbecco's Modified Eagle's Medium) with 10% FBS and 1% antibiotic–antimycotic was used to culture the cells. The medium was held at 37 °C, with 95% humidity and 5% CO2. Furthermore, cell fixation was carried out with 100 μl of 2.5 glutaraldehyde in 0.1 cacodylate buffer, incubated overnight at 4 °C. After that, alcohol series and HDMS were used to dehydrate and dry the samples, respectively. After fixation, the cell morphologies were examined by scanning electron microscopy (JSM-IT300, Bandung, Indonesia).For the MTT assay test, 24-well plates were used as the media. Passage 6 HWJ-MSCs were grown at a density of 15![[thin space (1/6-em)]](https://www.rsc.org/images/entities/char_2009.gif) 000 cells per well. The plates were incubated for 1, 3, and 7 days after adding the medium to the well. The temperature should be maintained at 37 °C. Cell viability was assessed using an MTT test with 0.5 mg mL−1 as the final concentration.
000 cells per well. The plates were incubated for 1, 3, and 7 days after adding the medium to the well. The temperature should be maintained at 37 °C. Cell viability was assessed using an MTT test with 0.5 mg mL−1 as the final concentration.
3. Results and discussion
3.1. Functional group characterization of TA and TA–PEI coated pure Mg
The FTIR spectra of TA–PEI coatings are shown in Fig. 1a. There are several distinct bands observed. | ||
| Fig. 1 (a) FTIR spectrum of TA–PEI coated Mg. (b) Schematic of the TA and PEI chemical reaction on the pure Mg substrate. | ||
A band at 1710.86 cm−1 of the TA sample shows the presence of C![[double bond, length as m-dash]](https://www.rsc.org/images/entities/char_e001.gif) O functional groups in the TA structure. Bands at 2960.73–2962.66 cm−1 were only observed on TA–PEI representing CH2 functional groups at the PEI structure. This evidence matches the previous study to show the presence of both functional groups.44,45 Broad bands were observed around 3373.50–3421.08 cm−1, showing chemical bonding evidence of TA and PEI.28 More detailed information on the chemical bonding of TA–PEI is illustrated in the schematic figure, shown in Fig. 1b. Catechol groups in TA can spontaneously be oxidized into quinone groups when TA remains in touch with an alkaline solution. When PEI is added to the same solution, the oxidized catechol group will react with the amino group in PEI through a Michael-type or Schiff-base reaction to build a primary chemical bonding. In other words, crosslink bonding is formed between TA and PEI. The linkage makes overlap stretching vibration between TA and PEI around 2500–3700 cm−1. Thus, individual vibration of the OH structure at TA and NH structures at PEI reduces.44 The origin bands of OH and NH2 are at 3392 cm−1 and 3371 cm−1, respectively.45 However, this study observed TA, TA–1PEI, TA–2PEI, and TA–4PEI bands at 3373.50 cm−1, 3412.08 cm−1, 3410.15 cm−1, and 3392.72 cm−1, respectively. This evidence shows a band shift due to the strong hydrogen bonding between TA and PEI besides the presence of crosslink phenomena.45 In addition, there are also metal chelation phenomena between TA and metal at the material surface. This type of bonding is not strong enough as TA–PEI bonding but enough to make the coating deposited and bonded on a metal surface.
O functional groups in the TA structure. Bands at 2960.73–2962.66 cm−1 were only observed on TA–PEI representing CH2 functional groups at the PEI structure. This evidence matches the previous study to show the presence of both functional groups.44,45 Broad bands were observed around 3373.50–3421.08 cm−1, showing chemical bonding evidence of TA and PEI.28 More detailed information on the chemical bonding of TA–PEI is illustrated in the schematic figure, shown in Fig. 1b. Catechol groups in TA can spontaneously be oxidized into quinone groups when TA remains in touch with an alkaline solution. When PEI is added to the same solution, the oxidized catechol group will react with the amino group in PEI through a Michael-type or Schiff-base reaction to build a primary chemical bonding. In other words, crosslink bonding is formed between TA and PEI. The linkage makes overlap stretching vibration between TA and PEI around 2500–3700 cm−1. Thus, individual vibration of the OH structure at TA and NH structures at PEI reduces.44 The origin bands of OH and NH2 are at 3392 cm−1 and 3371 cm−1, respectively.45 However, this study observed TA, TA–1PEI, TA–2PEI, and TA–4PEI bands at 3373.50 cm−1, 3412.08 cm−1, 3410.15 cm−1, and 3392.72 cm−1, respectively. This evidence shows a band shift due to the strong hydrogen bonding between TA and PEI besides the presence of crosslink phenomena.45 In addition, there are also metal chelation phenomena between TA and metal at the material surface. This type of bonding is not strong enough as TA–PEI bonding but enough to make the coating deposited and bonded on a metal surface.
3.2. Surface characterization of TA and TA–PEI coated pure Mg
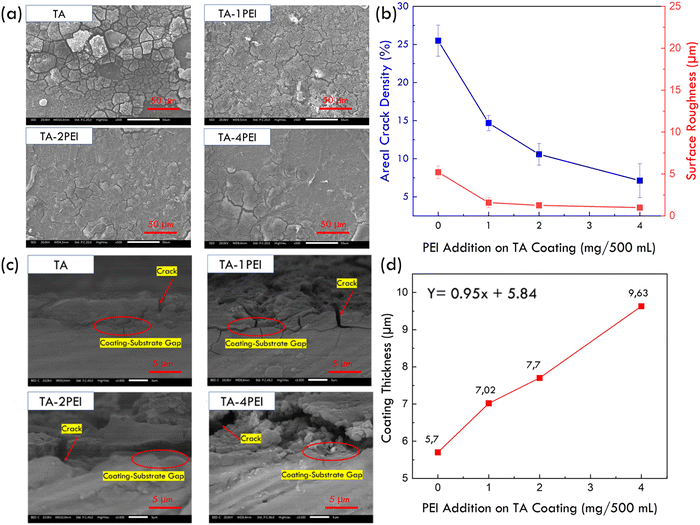
![[thin space (1/6-em)]](https://www.rsc.org/images/entities/char_2009.gif) :
:![[thin space (1/6-em)]](https://www.rsc.org/images/entities/char_2009.gif) PEI 1
PEI 1![[thin space (1/6-em)]](https://www.rsc.org/images/entities/char_2009.gif) :
:![[thin space (1/6-em)]](https://www.rsc.org/images/entities/char_2009.gif) 0 to 1
0 to 1![[thin space (1/6-em)]](https://www.rsc.org/images/entities/char_2009.gif) :
:![[thin space (1/6-em)]](https://www.rsc.org/images/entities/char_2009.gif) 2 resulted in a reduction in the area of crack density from 25.49% to 7.12%, and a decrease in the surface roughness from 5.20 μm to 0.98 μm.
2 resulted in a reduction in the area of crack density from 25.49% to 7.12%, and a decrease in the surface roughness from 5.20 μm to 0.98 μm.
In addition, the EDS result on all coatings shows evidence of Mg, C, and O as an element that builds TA, PEI, and Mg as a substrate. Meanwhile, N was only observed on TA–PEI samples due to the presence of NH2 in PEI, see Table 2.
| Samples | Elements (wt%) | |||
|---|---|---|---|---|
| C | N | O | Mg | |
| TA | 31.21 | 0 | 36.55 | 32.24 |
| TA–1PEI | 38.35 | 3.08 | 30.24 | 28.15 |
| TA–2PEI | 47.94 | 3.95 | 15.29 | 32.82 |
| TA–4PEI | 35.07 | 3.82 | 28.32 | 32.79 |
From a cross-sectional view of the coatings shown in Fig. 2c, the morphology of coatings is uneven and not continuous due to the presence of cracks, confirming the morphology from the top view. It can be seen that the crack penetrated through the thickness of the coating until it reached the substrate. Based on the EDS line analysis result in Fig. 2d, the coating tends to be thicker with the increase of PEI addition due to the higher crosslink density between the TA and PEI. Thus, the deposition of TA–PEI is much more to occur and be deposited on magnesium. EDS line analysis result shows that the increase in the PEI content from a weight ratio of TA![[thin space (1/6-em)]](https://www.rsc.org/images/entities/char_2009.gif) :
:![[thin space (1/6-em)]](https://www.rsc.org/images/entities/char_2009.gif) PEI 1
PEI 1![[thin space (1/6-em)]](https://www.rsc.org/images/entities/char_2009.gif) :
:![[thin space (1/6-em)]](https://www.rsc.org/images/entities/char_2009.gif) 0 to 1
0 to 1![[thin space (1/6-em)]](https://www.rsc.org/images/entities/char_2009.gif) :
:![[thin space (1/6-em)]](https://www.rsc.org/images/entities/char_2009.gif) 2 resulted in an increase in the coating thickness from 5.7 μm to 9.3 μm. A simple mathematical equation with linear behaviour assumptions shows that adding 1 mg/500 mL of PEI will increase the coating thickness to 0.95 μm.
2 resulted in an increase in the coating thickness from 5.7 μm to 9.3 μm. A simple mathematical equation with linear behaviour assumptions shows that adding 1 mg/500 mL of PEI will increase the coating thickness to 0.95 μm.
3.3. Immersion corrosion behaviour of TA and TA–PEI coated pure Mg
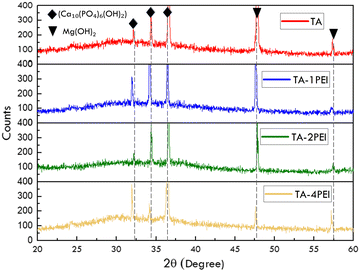
Table 3 shows the EDS result of the corrosion product. The primary corrosion product elements are magnesium, oxygen, calcium, and phosphor. It can be predicted that brucite or magnesium hydroxide (Mg(OH)2) and hydroxyapatite (Ca10(PO4)6(OH)2) formed. Besides this, the Ca/P ratio reaches around 1.13–1.31, indicating hydroxyapatite formation.
| Samples | Elements (wt%) | Ca/P | ||||
|---|---|---|---|---|---|---|
| Mg | O | C | Ca | P | ||
| TA | 3.57 | 57.54 | 23.56 | 8.01 | 7.11 | 1.13 |
| TA–1PEI | 7.02 | 51.73 | 24.77 | 8.94 | 7.55 | 1.19 |
| TA–2PEI | 4.59 | 56.94 | 25.39 | 6.96 | 6.11 | 1.14 |
| TA–4PEI | 2.67 | 46.67 | 39.11 | 6.55 | 5.00 | 1.31 |
Based on the XRD result (Fig. 6), several peaks at 20–35° and 55–70° on all samples were observed, confirming the presence of hydroxyapatite and brucite, respectively.15 These results support the EDS result. Thus, this TA and TA–PEI system is suitable for the human physiological system to the evidence of hydroxyapatite formation. Moreover, the corrosion product quantification in Table 4 shows a considerable difference between the corrosion product percentage of TA and TA–4PEI, especially for hydroxyapatites. The hydroxyapatite of TA is much higher than that of TA–4PEI, indicating that a more massive corrosion reaction occurred at TA compared to TA–4PEI.
| Sample | Corrosion product percentage (%) | |
|---|---|---|
| Ca10(PO4)6(OH)2 | Mg(OH)2 | |
| TA | 55 | 45 |
| TA–1PEI | 68 | 32 |
| TA–2PEI | 40 | 60 |
| TA–4PEI | 48 | 52 |
3.4. Electrochemical corrosion behaviour of TA and TA–PEI coated pure Mg
| Sample | E corr (V vs. VSCE) | −βc (mV dec−1) | log![[thin space (1/6-em)]](https://www.rsc.org/images/entities/char_2009.gif) icorr (A cm−2) icorr (A cm−2) |
Corrosion rate (mmpy) | Ref. |
|---|---|---|---|---|---|
| Pure Mg | −2.25 | 0.54 | −3.72 | 5.5 | 57 |
| TA | −1.77 ± 0.03 | 0.43 ± 0.07 | −3.67 ± 0.05 | 4.97 ± 0.06 | Experimental |
| TA–1PEI | −1.60 ± 0.01 | 0.39 ± 0.07 | −3.73 ± 0.01 | 4.30 ± 0.17 | |
| TA–2PEI | −1.76 ± 0.07 | 0.24 ± 0.11 | −3.94 ± 0.35 | 3.14 ± 1.83 | |
| TA–4PEI | −1.55 ± 0.02 | 0.42 ± 0.03 | −3.96 ± 0.29 | 2.90 ± 1.53 |
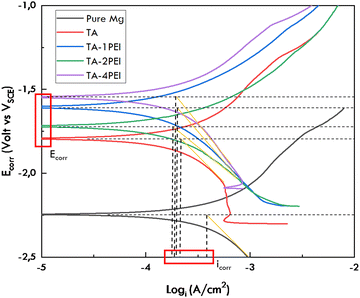
As shown in Fig. 7, the anodic branch of polarization curves represents magnesium dissolution, and the cathodic branch represents hydrogen evolution. Pseudo-passivation in the anodic branch indicates protective layer formation and enhances the material's corrosion resistance.61Table 5 shows the data extracted from Fig. 7. The addition of TA and PEI will increase the corrosion potential value relative to pure Mg. Only the TA–2PEI sample showed a decrease in the corrosion potential value compared to TA–1PEI, and the values are relatively similar to the corrosion potential of the TA samples. It should be noted that due to the negative difference effect (NDE) in magnesium, the cathodic polarization technique is a valid method to determine magnesium's quantitative corrosion parameters instead of the anodic–cathodic approach.61–65 It focused on a current density value as an essential parameter predicting the corrosion rate. Adding TA and TA–PEI coating systems onto pure Mg resulted in a declining value of the corrosion current density, which implies that the corrosion rate is decreased. The reason is that the more PEI added to the TA-coating, the coating's crack density will be lower; the coating is more uniform and makes the corrosive fluid harder to penetrate further and corrode the substrate. Thus, it can be predicted that the material's corrosion resistance will be higher.
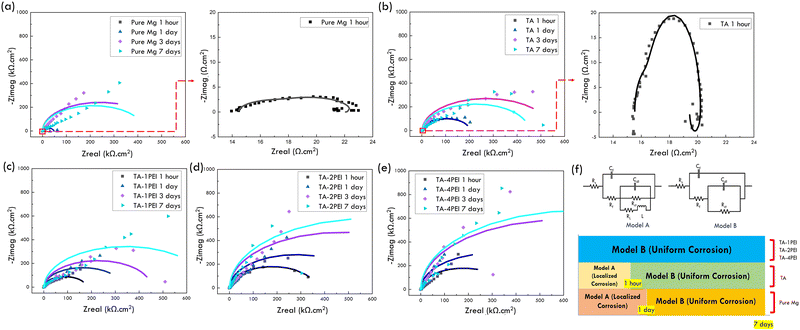
As the immersion time increases, the value of impedance of all samples will increase, as shown in Fig. 8a–e, indicated by the greater semicircle in the Nyquist plot. With the increase in the impedance value, the current density that can pass through the material will get smaller. Therefore, the corrosion rate is predicted to decrease upon increasing the immersion time on the material.19 The plausible cause of the increasing impedance value was the corrosion products such as magnesium hydroxide and hydroxyapatite deposited on the coating surface. These corrosion products act as a protective layer filling the crack area, hindering the SBF penetration towards the Mg surface.19
In addition, EIS characterization can also predict the evolution of different corrosion modes in the material. Based on the Nyquist plot (Fig. 8a–e), an electric circuit equivalent was made to indicate the corrosion mechanism that occurred. The electrical circuits and the corrosion mechanism in the sample are presented in Fig. 8f.
There are two models, namely model A and model B, shown in Fig. 8f. Rs is the solution's resistance between the reference and working electrode, Cf is the coating film capacitance, Rf is the resistance film, Cdl is the double-layer capacitance, Rct is the charge transfer resistance, RL is the inductance, and L is the resistance of inductance.19,21,28,31 The primary difference between model A and model B is the presence of RL and L in model A. These two components can be visually seen in Fig. 8a and b, especially in the pure Mg sample (1 hour and 1 day of immersion) and TA sample (1 hour of immersion) marked with the shape of a semicircle facing up at low frequencies. The existence of these two components indicates a localized corrosion phenomenon. Furthermore, these results align with other EIS measurements for magnesium's system as a bioresorbable implant application, thus, ensuring its applicability.19,28,29,31,40,66,67
On the other hand, the presence of Cf and Rf indicates the uniform corrosion phenomenon. Visually, the presence of Cf and Rf can be seen in most of Fig. 8a–e, which is characterized by the presence of a downward-facing semicircle at high frequencies.19,21 Therefore, based on EIS data and the electric circuit model equivalently, the corrosion mechanism that occurs could be predicted, as shown in Fig. 9 (bottom-center). In the pure Mg sample, the corrosion began with localized corrosion until the third day of immersion, and then uniform corrosion took place up to the seventh day of immersion. On the TA sample, localized corrosion only occurred within one hour of immersion; it continued with uniform corrosion until the seventh day of immersion. In the bare pure Mg and TA sample, the area exposed to SBF at the start of immersion was relatively high due to the absence of a coating in pure Mg and the high area of crack density in TA. As a result, localized breakdown on the sample surface caused localized corrosion to occur.19 However, along with increasing immersion time (1 hour), the exposed area was reduced due to the deposition of corrosion products on the surface so that the inductive loop (indication of localized corrosion) will slowly disappear. Thus, the corrosion mode that occurs afterward is uniform corrosion.19,21 In all TA–PEI samples, uniform corrosion was the only corrosion mechanism. It is hypothesized that with a smaller crack density area in the sample at the beginning, it will be difficult for the SBF solution to penetrate into the substrate to cause a localized breakdown. In particular, when corrosion products start to be deposited, the area exposed to SBF will be reduced so that Rf increases and Cdl decreases.19,21,28
3.5. Corrosion rate measurement through weight loss and EIS methods
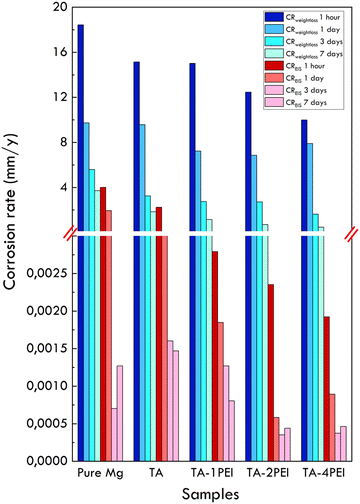
A comparison of corrosion rates of samples based on weight loss and EIS methods and their quantification is shown in Fig. 9 and Table 6, respectively.| Sample | Method | Corrosion rate (mm year−1) | |||
|---|---|---|---|---|---|
| 1 hour | 1 day | 3 days | 7 days | ||
| Pure Mg | Weight loss | 18.4249 | 9.7306 | 5.5881 | 3.7170 |
| EIS | 4.0068 | 1.9505 | 0.0007 | 0.0013 | |
| TA | Weight loss | 15.1336 | 9.5707 | 3.2501 | 1.8484 |
| EIS | 2.2438 | 0.0046 | 0.0016 | 0.0015 | |
| TA–1PEI | Weight loss | 15.0156 | 7.2287 | 2.7497 | 1.1611 |
| EIS | 0.0028 | 0.0018 | 0.0013 | 0.0008 | |
| TA–2PEI | Weight loss | 12.4530 | 6.8538 | 2.7234 | 0.7092 |
| EIS | 0.0024 | 0.0006 | 0.0004 | 0.0004 | |
| TA–4PEI | Weight loss | 9.9926 | 7.8980 | 1.6347 | 0.4781 |
| EIS | 0.0019 | 0.0009 | 0.0004 | 0.0005 | |
As presented in Fig. 9 and Table 6, the corrosion rate prediction through the weightloss method shows the same trend. For each variation, the corrosion rate will decrease with an increase in the immersion time. If compared between samples for any given immersion time, the corrosion rate will be reduced with the increasing concentration of PEI. This is mainly due to the reduction of crack density area, which facilitates SBF penetration. In addition, the presence of corrosion product deposits on the surface also contributes to reducing the material's corrosion rate by creating a passive barrier between the substrate and SBF. Meanwhile, the corrosion rate prediction obtained through the EIS method tends to fluctuate. EIS is an instantaneous technique that predicts the corrosion rate over a certain period, i.e., when testing occurs. This method does not predict the actual corrosion rate at certain time exposure. The competition between the micro galvanic couplings formed in the substrate area exposed to SBF with the deposition of corrosion products also contributed to the fluctuating corrosion rate.19
Another concern is that the EIS method (an electrochemical method) always produces lower values of the corrosion rate compared to the weight loss method (steady state method), indicating that a non-faradaic mechanism occurred during magnesium dissolution.68 This phenomenon was due to several factors. First, there is a localized reaction of formation and dissolution of MgH2. Hydrogen will cover a part of the specimen and make it unable to be detected by EIS.68,69 Second is the presence of an intermediate unipositive dissolution of Mg+ due to local anodic and cathodic reactions. Some of these ions will spontaneously oxidise to Mg+, and the rest will react with water to form Mg2+. This reaction causes no contribution of electron loss from the Mg substrate.69,70 The last factor is the undercutting of phases. A random grain orientation in pure Mg may result in potential differences. A grain fall-off mechanism on adjacent grains may occur when the corrosion process occurs on the grain. Therefore, the grains enter the fluid physically, not as a result of an electrochemical reaction. It contributes to mass reduction but is not considered in the electrochemical methods.19,71 It should be remembered that corrosion rate prediction using the Stern equation by inputting EIS data might vary depending on the chosen electrical circuit.68
Based on the explanation, the corrosion rate measured through the weight loss method will be more accurate in estimating the corrosion rate of a system. In relation to implant application, the allowable corrosion rate is 0.2–0.5 mm year−1.72 Graphically, the comparison of the corrosion rate of all samples with the limitation is shown in Fig. 10.
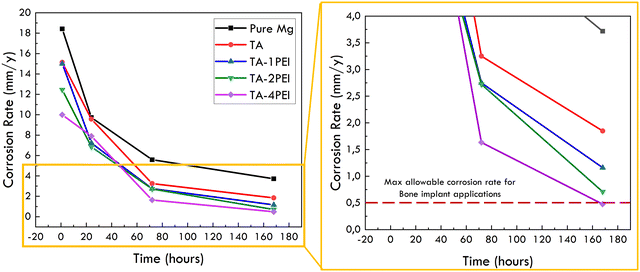 | ||
| Fig. 10 Corrosion rate of all samples measured through the weight loss method and the allowable corrosion rate as a bone implant. | ||
The sample whose corrosion rate is still in the allowable corrosion rate as the bone implant is the one with a weight ratio of TA![[thin space (1/6-em)]](https://www.rsc.org/images/entities/char_2009.gif) :
:![[thin space (1/6-em)]](https://www.rsc.org/images/entities/char_2009.gif) PEI of 1
PEI of 1![[thin space (1/6-em)]](https://www.rsc.org/images/entities/char_2009.gif) :
:![[thin space (1/6-em)]](https://www.rsc.org/images/entities/char_2009.gif) 2 or coated with TA–4PEI (0.48 mm year−1) after being immersed for 7 days, as shown in Fig. 10. The reason was due to the minimum crack density area to minimize the penetration of SBF into the pure Mg substrate.
2 or coated with TA–4PEI (0.48 mm year−1) after being immersed for 7 days, as shown in Fig. 10. The reason was due to the minimum crack density area to minimize the penetration of SBF into the pure Mg substrate.
3.6. Biocorrosion mechanisms
Fig. 11 shows the proposed biocorrosion mechanism at TA and TA–PEI coated pure Mg based on the actual morphology and corrosion product formed. The corrosion reaction occurred in several steps:15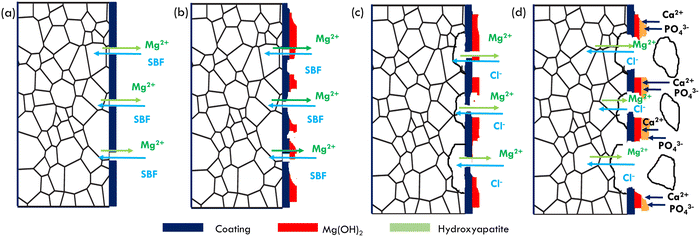 | ||
| Fig. 11 Proposed corrosion mechanism at TA and TA–PEI coated pure Mg.15 | ||
(1) Through-the-thickness coating cracks will act as a medium for SBF to penetrate and react with pure magnesium as a substrate. Microgalvanic coupling between grains will be formed, and the following reaction will occur:
| Mg(s) → Mg2+(aq) + 2e (anodic reaction) |
| 2H2O + 2e → H2(g) + OH(aq) (cathodic reaction) |
| Mg2+(aq) + 2OH(aq) → Mg(OH)2 (overall reaction) |
(2) The Mg2+ released into the fluid will react with OH− and form a passive layer of Mg(OH)2. Although this passive layer is formed and deposited on coating surfaces, the protection of this layer from the corrosive fluid is not enough due to the porous structure of the layer.
(3) Due to the existence of Cl− in SBF, Mg(OH)2 will continue to be in a looping reaction of precipitation and dissolution. The site where Mg(OH)2 dissolves means less protection than the area where Mg(OH)2 exists. This reaction will continuously occur until there is a saturation of ions in the SBF.
(4) The site where Mg(OH)2 exists will act as a nucleation site of hydroxyapatite. With the increase of pH value and the saturation of the solution, calcium and phosphate ions will be deposited on the surface of Mg(OH)2 and form hydroxyapatite. In addition, besides an electrochemical reaction, there is a possibility of grain falling off into the solution. This evidence shows that the degradation of pure magnesium in SBF is not only controlled by an electrochemical process but also a physical degradation. The magnesium degrades to the SBF in the form of an alpha-phase-single grain instead of an Mg2+ ion.
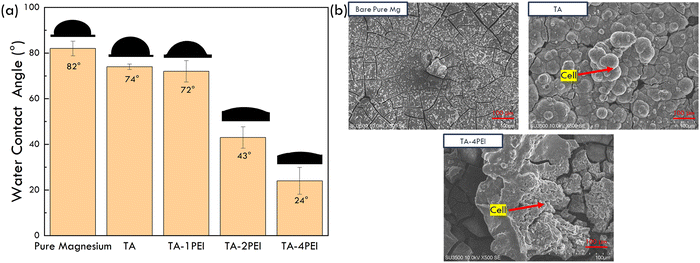
3.7. Wettability and cell adhesion of TA and TA–PEI coated pure Mg
The results of the water contact angle test on pure magnesium samples, both uncoated and coated with four coating variations, are shown in Fig. 12a and Table 7.| Sample | Wetting angle (°) |
|---|---|
| Pure magnesium | 82 ± 3.1 |
| TA | 74 ± 1.25 |
| TA–1PEI | 72 ± 4.76 |
| TA–2PEI | 43 ± 4.76 |
| TA–4PEI | 24 ± 5.96 |
As shown in Fig. 12a and Table 7, adding TA coating on bare pure Mg decreased the wetting angle from 82° to 74°. Then, along with the increase of PEI concentration in the coating system, the wetting angle value will further decrease to 24°. In other words, the wettability of the sample increases. Previous research showed that surfaces with a moderately hydrophilic characteristic (20°–40°) exhibit the best wettability for implant application. Moreover, it will promote the highest cell attachments.73 TA–4PEI is the only sample that fulfills this criterion. A decrease in the wetting angle due to the addition of TA is due to the presence of hydroxyl groups found in TA, which is considered a polar group. The polar group facilitates the presence of hydrogen bonds with water. As a result, the wettability of Mg increases. Furthermore, amino groups in PEI are also hydrophilic groups, so the coating will increasingly become hydrophilic. With the increase in PEI concentration, the number of crosslinks in the TA–PEI system will increase, and so will be the number of hydrogen bonds, which resulted in a more hydrophilic coating system. The hydrophilicity of a system is predicted to promote the adhesion of cells making the system more biocompatible.
Human Wharton's jelly mesenchymal stem cell adhesion test results of samples through SEM observation are presented in Fig. 12b. It can be inferred from Fig. 12b that on the surface of the bare pure Mg sample, there are no HWJ cells attached. However, in the TA and TA–4PEI coated samples, it is estimated that there are HWJ cells attached. In comparison, the cells grown on TA–4PEI have a better attachment and spreading than the TA-coated sample. This observation showed that the cell adhesion of TA–4PEI was better than that of TA samples. In general, it can also be concluded that the TA and TA–4PEI coating systems are proven to be non-toxic towards cells.
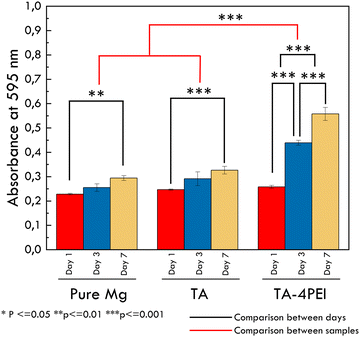
3.8. MTT assay result
The MTT assay test result is presented in Fig. 13. The MTT test was used to measure the metabolic activity of cells seeded on the samples using (3-(4,5-dimethylthiazol-2-yl)-2,5-diphenyltetrazolium bromide). This test determines the activity of cellular metabolism, that is, formazan crystal formation, indicated by the colour change from yellow to purple. This phenomenon is caused by mitochondrial dehydrogenase. The optical density (OD) value is related to cell viability; the higher the OD value, the higher the cell viability.74 All samples showed increased cell viability with an increase in time, or in other words, better cytocompatibility.75 The TA–PEI system offers the highest cell viability, indicating that the TA–PEI system supports the human Wharton's jelly mesenchymal stem Cell (hWJ-MSC) proliferation and does not generate non-toxic properties compared to the others. Cells will adhere to the surface of the material in order to perform some biological activity such as migration, proliferation, and differentiation.76 hWJ-MSCs have attracted great interest in bone tissue engineering since they can differentiate into the osteogenic lineage.77 Previous research found that osteogenic differentiation of MSCs was observed on the scaffold with polyethyleneimine.78 The scaffolds provided a suitable environment for mesenchymal Stem Cell survival and osteogenesis. In addition, corrosion of magnesium that produces hydrogen evolution and alkalization has a detrimental effect on a living organism, such as cell apoptosis if the pH value is higher or lower than 7.4.28 This research proves that the higher corrosion resistance of TA–4PEI minimizes the corrosion process and alkalization. Thus, it will facilitate a higher number of cells to grow in that medium and be biocompatible and suitable for bone tissue engineering applications.4. Conclusion
The results showed that a TA–PEI coating on magnesium increased the corrosion resistance and biocompatibility of the material with the following details. First, the increase in the PEI content from a weight ratio of TA![[thin space (1/6-em)]](https://www.rsc.org/images/entities/char_2009.gif) :
:![[thin space (1/6-em)]](https://www.rsc.org/images/entities/char_2009.gif) PEI 1
PEI 1![[thin space (1/6-em)]](https://www.rsc.org/images/entities/char_2009.gif) :
:![[thin space (1/6-em)]](https://www.rsc.org/images/entities/char_2009.gif) 0 to 1
0 to 1![[thin space (1/6-em)]](https://www.rsc.org/images/entities/char_2009.gif) :
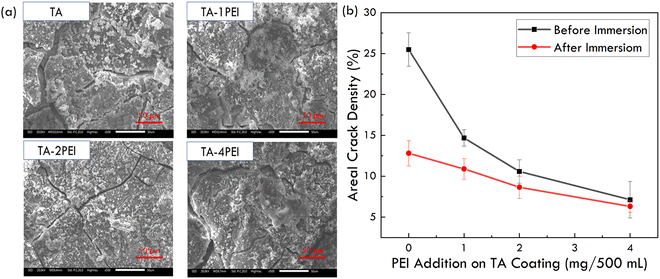
:![[thin space (1/6-em)]](https://www.rsc.org/images/entities/char_2009.gif) 2 resulted in a reduction in the area of crack density from 25.49% to 7.12%, an increase in the coating thickness from 5.7 μm to 9.3 μm, a decrease in the surface roughness from 5.20 μm to 0.98 μm, but a change in the deformation mechanism from the ductile to the brittle layer. The reason is because of the crosslink phenomenon development between TA and PEI. Second, immersion in the SBF solution reduces the area of crack density in the TA–PEI coating. Deposits of corrosion products cover the cracks in the form of magnesium hydroxide and hydroxyapatite. Hydroxyapatite formation indicates that this system is biocompatible with the human body. Third, adding PEI to TA as a pure magnesium coating has increased the material's corrosion resistance because the coating's crack density is reduced. Then it will make the corrosive fluids harder to penetrate and corrode the materials. Changes in the weight ratio of TA
2 resulted in a reduction in the area of crack density from 25.49% to 7.12%, an increase in the coating thickness from 5.7 μm to 9.3 μm, a decrease in the surface roughness from 5.20 μm to 0.98 μm, but a change in the deformation mechanism from the ductile to the brittle layer. The reason is because of the crosslink phenomenon development between TA and PEI. Second, immersion in the SBF solution reduces the area of crack density in the TA–PEI coating. Deposits of corrosion products cover the cracks in the form of magnesium hydroxide and hydroxyapatite. Hydroxyapatite formation indicates that this system is biocompatible with the human body. Third, adding PEI to TA as a pure magnesium coating has increased the material's corrosion resistance because the coating's crack density is reduced. Then it will make the corrosive fluids harder to penetrate and corrode the materials. Changes in the weight ratio of TA![[thin space (1/6-em)]](https://www.rsc.org/images/entities/char_2009.gif) :
:![[thin space (1/6-em)]](https://www.rsc.org/images/entities/char_2009.gif) PEI 1
PEI 1![[thin space (1/6-em)]](https://www.rsc.org/images/entities/char_2009.gif) :
:![[thin space (1/6-em)]](https://www.rsc.org/images/entities/char_2009.gif) 0 to 1
0 to 1![[thin space (1/6-em)]](https://www.rsc.org/images/entities/char_2009.gif) :
:![[thin space (1/6-em)]](https://www.rsc.org/images/entities/char_2009.gif) 2 reduce the corrosion rate of the material from 3.7 mm year−1 to 0.47 mm year−1. In pure magnesium and coatings with a weight ratio of TA
2 reduce the corrosion rate of the material from 3.7 mm year−1 to 0.47 mm year−1. In pure magnesium and coatings with a weight ratio of TA![[thin space (1/6-em)]](https://www.rsc.org/images/entities/char_2009.gif) :
:![[thin space (1/6-em)]](https://www.rsc.org/images/entities/char_2009.gif) PEI 1
PEI 1![[thin space (1/6-em)]](https://www.rsc.org/images/entities/char_2009.gif) :
:![[thin space (1/6-em)]](https://www.rsc.org/images/entities/char_2009.gif) 0 or coated with the TA sample, the corrosion mechanism is in the form of local corrosion and then changes to uniform corrosion, while for all TA–PEI, the corrosion mechanism is uniform corrosion. The corrosion rate at a weight ratio of TA
0 or coated with the TA sample, the corrosion mechanism is in the form of local corrosion and then changes to uniform corrosion, while for all TA–PEI, the corrosion mechanism is uniform corrosion. The corrosion rate at a weight ratio of TA![[thin space (1/6-em)]](https://www.rsc.org/images/entities/char_2009.gif) :
:![[thin space (1/6-em)]](https://www.rsc.org/images/entities/char_2009.gif) PEI 1
PEI 1![[thin space (1/6-em)]](https://www.rsc.org/images/entities/char_2009.gif) :
:![[thin space (1/6-em)]](https://www.rsc.org/images/entities/char_2009.gif) 2 or coated with TA–4PEI (0.48 mm year−1) meets the corrosion rate criteria allowed for bone implant applications (0.2–0.5 mm year−1). Finally, increasing the PEI content from the TA
2 or coated with TA–4PEI (0.48 mm year−1) meets the corrosion rate criteria allowed for bone implant applications (0.2–0.5 mm year−1). Finally, increasing the PEI content from the TA![[thin space (1/6-em)]](https://www.rsc.org/images/entities/char_2009.gif) :
:![[thin space (1/6-em)]](https://www.rsc.org/images/entities/char_2009.gif) PEI weight ratio of 1
PEI weight ratio of 1![[thin space (1/6-em)]](https://www.rsc.org/images/entities/char_2009.gif) :
:![[thin space (1/6-em)]](https://www.rsc.org/images/entities/char_2009.gif) 0 to 1
0 to 1![[thin space (1/6-em)]](https://www.rsc.org/images/entities/char_2009.gif) :
:![[thin space (1/6-em)]](https://www.rsc.org/images/entities/char_2009.gif) 2 reduces the contact angle from 74° to 24°. At a 1
2 reduces the contact angle from 74° to 24°. At a 1![[thin space (1/6-em)]](https://www.rsc.org/images/entities/char_2009.gif) :
:![[thin space (1/6-em)]](https://www.rsc.org/images/entities/char_2009.gif) 2 TA
2 TA![[thin space (1/6-em)]](https://www.rsc.org/images/entities/char_2009.gif) :
:![[thin space (1/6-em)]](https://www.rsc.org/images/entities/char_2009.gif) PEI ratio, passage 6 HWJ cells can adhere well and have the highest absorbance level as observed from the MTT result. Both indicate that this coating system has good biocompatibility and is potentially suitable for bone tissue engineering applications.
PEI ratio, passage 6 HWJ cells can adhere well and have the highest absorbance level as observed from the MTT result. Both indicate that this coating system has good biocompatibility and is potentially suitable for bone tissue engineering applications.
Conflicts of interest
There are no conflicts to declare.References
- G. J. Tortora and B. Derrickson, Principles of Anatomy and Physiology, John Wiley & Sons, Inc, USA, 12th edn, vol. 01, 2009 Search PubMed.
- F. H. Martini, J. L. Nath and E. F. Bartholomew, Anatomy & Physiology, Fredereic H. Martini, Inc, San Francisco, 2012, p. 1273 Search PubMed.
- P. E. R. Richard, L. Drake, A. Wayne Vogl, A. W. M. Mitchell and R. M. Tibbitts, Gray's Atlas of Anatomy, International Edition, 2015, pp. 134–206. Available: http://www.elsevier.com%0Awww.bookaid.org Search PubMed.
- T. Kim, C. Wang, X. Li and D. Zhu, Orthopedic implants and devices for bone fractures and defects: Past, present and perspective, Engineered Regeneration, 2020, 1, 6–18, DOI:10.1016/j.engreg.2020.05.003.
- W. Jin, P. K. Chu and H. Kong, Orthopedic Implants, Elsevier Inc., 2017 DOI:10.1016/B978-0-12-801238-3.10999-7.
- J. L. Wang, J. K. Xu, C. Hopkins, D. H. K. Chow and L. Qin, Biodegradable Magnesium-Based Implants in Orthopedics—A General Review and Perspectives, Adv. Sci., 2020, 7(8) DOI:10.1002/advs.201902443.
- A. Arifin, A. B. Sulong, N. Muhamad, J. Syarif and M. I. Ramli, Material processing of hydroxyapatite and titanium alloy (HA/Ti) composite as implant materials using powder metallurgy: A review, Mater. Des., 2014, 55, 165–175, DOI:10.1016/j.matdes.2013.09.045.
- M. P. Staiger, A. M. Pietak, J. Huadmai and G. Dias, Magnesium and its alloys as orthopedic biomaterials: A review, Biomaterials, 2006, 27(9), 1728–1734, DOI:10.1016/j.biomaterials.2005.10.003.
- R. Chitturi, V. R. Baddam, L. Prasad, L. Prashanth and K. Kattapagari, A review on role of essential trace elements in health and disease, J. Dr NTR Univ. Heal. Sci., 2015, 4(2), 75, DOI:10.4103/2277-8632.158577.
- D. Zhao, F. Witte, F. Lu, J. Wang, J. Li and L. Qin, Current status on clinical applications of magnesium-based orthopaedic implants: A review from clinical translational perspective, Biomaterials, 2017, 112, 287–302, DOI:10.1016/j.biomaterials.2016.10.017.
- K. Munir, J. Lin, C. Wen, P. F. A. Wright and Y. Li, Mechanical, corrosion, and biocompatibility properties of Mg-Zr-Sr-Sc alloys for biodegradable implant applications, Acta Biomater., 2020, 102, 493–507, DOI:10.1016/j.actbio.2019.12.001.
- R. Radha and D. Sreekanth, Insight of magnesium alloys and composites for orthopedic implant applications – a review, J. Magnes. Alloy., 2017, 5(3), 286–312, DOI:10.1016/j.jma.2017.08.003.
- X. Meng, Z. Jiang, S. Zhu and S. Guan, Effects of Sr addition on microstructure, mechanical and corrosion properties of biodegradable Mg–Zn–Ca alloy, J. Alloys Compd., 2020, 838, 155611, DOI:10.1016/j.jallcom.2020.155611.
- L. A. Villegas-Armenta, R. A. L. Drew and M. O. Pekguleryuz, The Ignition Behavior of Mg–Ca Binary Alloys: The Role of Heating Rate, Oxid. Met., 2020, 93(5–6), 545–558, DOI:10.1007/s11085-020-09970-x.
- Z. Li, X. Gu, S. Lou and Y. Zheng, The development of binary Mg-Ca alloys for use as biodegradable materials within bone, Biomaterials, 2008, 29(10), 1329–1344, DOI:10.1016/j.biomaterials.2007.12.021.
- M. Salahshoor and Y. Guo, Biodegradable orthopedic magnesium-calcium (MgCa) alloys, processing, and corrosion performance, Materials, 2012, 5(1), 135–155, DOI:10.3390/ma5010135.
- Y. Wang, et al., icrostructures, mechanical properties, and degradation behaviors of heat-treated Mg-Sr alloys as potential biodegradable implant materials, J. Mech. Behav. Biomed. Mater., 2018, 77, 47–57, DOI:10.1016/j.jmbbm.2017.08.028.
- Y. Jin, et al., Microstructure-corrosion behaviour relationship of micro-alloyed Mg-0.5Zn alloy with the addition of Ca, Sr, Ag, In and Cu, Mater. Des., 2020, 195, 108980, DOI:10.1016/j.matdes.2020.108980.
- H. Pan, et al., Effect of alloyed Sr on the microstructure and corrosion behavior of biodegradable Mg-Zn-Mn alloy in Hanks’ solution, Corros. Sci., 2019, 157, 420–437, DOI:10.1016/j.corsci.2019.06.022.
- T. Nayeri, M. Yari and S. Sadreddini, Effect of Sr on the Microstructure and Properties of Mg-6Al Alloy, Prot. Met. Phys. Chem. Surf., 2016, 52(2), 273–278, DOI:10.1134/S2070205116020209.
- G. Chen, et al., Effects of Sr and y on microstructure and corrosion resistance of AZ31 magnesium alloy, Trans. Nonferrous Met. Soc. China, 2011, 21(4), 725–731, DOI:10.1016/S1003-6326(11)60772-3.
- I. S. Berglund, et al., Synthesis and characterization of Mg-Ca-Sr alloys for biodegradable orthopedic implant applications, J. Biomed. Mater. Res., Part B, 2012, 100 B(6), 1524–1534, DOI:10.1002/jbm.b.32721.
- F. Cao, Z. Shi, G. Song, M. Liu, M. S. Dargusch and A. Atrens, Influence of hot rolling on the corrosion behavior of several Mg – X alloys, Corros. Sci., 2015, 90, 176–191, DOI:10.1016/j.corsci.2014.10.012.
- S. Koleini, M. Hasbullah and H. Jafari, Influence of hot rolling parameters on microstructure and biodegradability of Mg – 1Ca alloy in simulated body fluid, J. Mater., 2012, 33, 20–25, DOI:10.1016/j.matdes.2011.06.063.
- S. Pawar, et al., Crystallographic effects on the corrosion of twin roll cast AZ31 Mg alloy sheet, Acta Mater., 2017, 133, 90–99, DOI:10.1016/j.actamat.2017.05.027.
- D. Li, H. Wang, D. Wei, Z. Zhao and Y. Liu, Effects of Deformation Texture and Grain Size on Corrosion Behavior of Mg − 3Al − 1Zn Alloy Sheets, ACS Omega, 2020, 5, 1448–1456, DOI:10.1021/acsomega.9b03009.
- H. Lee, S. M. Dellatore, W. M. Miller and P. B. Messersmith, Mussel-Inspired Surface Chemistry for Multifunctional Coatings, J. Chem. Inf. Model., 2019, 53(9), 1689–1699 Search PubMed.
- H. Zhang, et al., Catechol/polyethyleneimine conversion coating with enhanced corrosion protection of magnesium alloys: Potential applications for vascular implants, J. Mater. Chem. B, 2018, 6(43), 6936–6949, 10.1039/c8tb01574k.
- X. He, G. Zhang and Y. Pei, Layered hydroxide/polydopamine/hyaluronic acid functionalized magnesium alloys for enhanced anticorrosion, biocompatibility and antithrombogenicity in vascular stents, J. Biomater. Appl., 2020, 34, 1131–1141, DOI:10.1177/0885328219899233.
- B. Zhu, S. Wang, L. Wang, Y. Yang, J. Liang and B. Cao, Preparation of hydroxyapatite/tannic acid coating to enhance the corrosion resistance and cytocompatibility of AZ31 magnesium alloys, Coatings, 2017, 7, 105–118, DOI:10.3390/coatings7070105.
- X. Chen, G. Li, J. Lian and Q. Jiang, Study of the formation and growth of tannic acid based conversion coating on AZ91D magnesium alloy, Surf. Coatings Technol., 2009, 204(5), 736–747, DOI:10.1016/j.surfcoat.2009.09.022.
- H. P. Lee, D. J. Lin and M. L. Yeh, Phenolic modified ceramic coating on biodegradable Mg alloy: The improved corrosion resistance and osteoblast-like cell activity, Materials, 2017, 10, 696–709, DOI:10.3390/ma10070696.
- S. Chen, et al., The anticorrosion mechanism of phenolic conversion coating applied on magnesium implants, Appl. Surf. Sci., 2019, 463, 953–967, DOI:10.1016/j.apsusc.2018.08.261.
- M. P. Gomes, I. Costa, N. Pébère, J. L. Rossi, B. Tribollet and V. Vivier, On the corrosion mechanism of Mg investigated by electrochemical impedance spectroscopy, Electrochim. Acta, 2019, 306, 61–70, DOI:10.1016/j.electacta.2019.03.080.
- S. T. Vagge and S. Bakshi, Effect of precipitation hardening on stress corrosion cracking susceptibility index of AZ31B magnesium alloy in simulated body fluid, Mater. Today Proc., 2020, 38, 2191–2199, DOI:10.1016/j.matpr.2020.05.568.
- S. Razaviamri, K. Wang, B. Liu and B. P. Lee, Catechol-Based Antimicrobial Polymers, Molecules, 2021, 26, 559–575, DOI:10.3390/molecules26030559.
- Z. Chen, Z. Lv, Y. Sun, Z. Chi and G. Qing, Recent advancements in polyethyleneimine-based materials and their biomedical, biotechnology, and biomaterial applications, J. Mater. Chem. B, 2020, 8(15), 2951–2973, 10.1039/c9tb02271f.
- Y. Yang, et al., A biocompatible and functional adhesive amine-rich coating based on dopamine polymerization, J. Mater. Chem. B, 2015, 3(1), 72–81, 10.1039/c4tb01236d.
- L. Huang, J. Yi, Q. Gao, X. Wang, Y. Chen and P. Liu, Carboxymethyl chitosan functionalization of CPED-treated magnesium alloy via polydopamine as intermediate layer, Surf. Coatings Technol., 2014, 258, 664–671, DOI:10.1016/j.surfcoat.2014.08.020.
- H. Li, F. Peng, D. Wang, Y. Qiao, D. Xu and X. Liu, Layered double hydroxide/poly-dopamine composite coating with surface heparinization on Mg alloys: Improved anticorrosion, endothelialization and hemocompatibility, Biomater. Sci., 2018, 6(7), 1846–1858, 10.1039/c8bm00298c.
- F. Singer, M. Schlesak, C. Mebert, S. Höhn and S. Virtanen, Corrosion Properties of Polydopamine Coatings Formed in One-Step Immersion Process on Magnesium, ACS Appl. Mater. Interfaces, 2015, 7(48), 26758–26766, DOI:10.1021/acsami.5b08760.
- Z. Zhou, B. Zheng, H. Lang, A. Qin and J. Ou, Corrosion resistance and biocompatibility of polydopamine/hyaluronic acid composite coating on AZ31 magnesium alloy, Surf. Interfaces, 2020, 20, 100560, DOI:10.1016/j.surfin.2020.100560.
- X. Zhang, G. Zhang, H. Zhang, J. Li, X. Yao and B. Tang, Surface immobilization of heparin and chitosan on titanium to improve hemocompatibility and antibacterial activities, Colloids Surf., B, 2018, 172, 338–345, DOI:10.1016/j.colsurfb.2018.08.060.
- Q. Li, et al., Tannic acid-polyethyleneimine crosslinked loose nanofiltration membrane for dye/salt mixture separation, J. Memb. Sci., 2019, 584, 324–332, DOI:10.1016/j.memsci.2019.05.002.
- J. Ren, R. Kong, Y. Gao, L. Zhang and J. Zhu, Bioinspired adhesive coatings from polyethylenimine and tannic acid complexes exhibiting antifogging, self-cleaning, and antibacterial capabilities, J. Colloid Interface Sci., 2021, 602, 406–414, DOI:10.1016/j.jcis.2021.06.032.
- M. Serhan, et al., A one-step tannic acid coating to improve cell adhesion and proliferation on polydimethylsiloxane, AIChE Annu. Meet., Conf. Proc., 2020, 44, 15140–15147 Search PubMed.
- M. Y. Lee, J. H. Lee, J. W. Chung and S. Y. Kwak, Hydrophilic and positively charged polyethylenimine-functionalized mesoporous magnetic clusters for highly efficient removal of Pb(II) and Cr(VI) from wastewater, J. Environ. Manage., 2018, 206, 740–748, DOI:10.1016/j.jenvman.2017.10.051.
- P. Tian and X. Liu, Surface modification of biodegradable magnesium and its alloys for biomedical applications, Regen. Biomater., 2015, 2(2), 135–151, DOI:10.1093/rb/rbu013.
- C. Chen, H. Yang, X. Yang and Q. Ma, Tannic acid: A crosslinker leading to versatile functional polymeric networks: A review, RSC Adv., 2022, 12(13), 7689–7711, 10.1039/d1ra07657d.
- W. Z. Qiu, G. P. Wu and Z. K. Xu, Robust Coatings via Catechol-Amine Codeposition: Mechanism, Kinetics, and Application, ACS Appl. Mater. Interfaces, 2018, 10(6), 5902–5908, DOI:10.1021/acsami.7b18934.
- H. C. Yang, et al., Dopamine: Just the Right Medicine for Membranes, Adv. Funct. Mater., 2018, 28(8), 1–14, DOI:10.1002/adfm.201705327.
- H. Di, et al., Ag nanoparticles incorporated tannic acid/nanoapatite composite coating on Ti implant surfaces for enhancement of antibacterial and antioxidant properties, Surf. Coatings Technol., 2020, 399, 126169, DOI:10.1016/j.surfcoat.2020.126169.
- C. Steffi, Z. Shi, C. H. Kong and W. Wang, Bioinspired polydopamine and polyphenol tannic acid functionalized titanium suppress osteoclast differentiation: A facile and efficient strategy to regulate osteoclast activity at bone-implant interface, J. R. Soc., Interface, 2019, 16, 152–160, DOI:10.1098/rsif.2018.0799.
- T. Poon, B. P. Mundy and T. W. Shattuck, The Michael reaction, J. Chem. Educ., 2002, 79(2), 264, DOI:10.1021/ed079p264.
- E. Montanari, et al., Hyaluronan/Tannic Acid Nanoparticles Via Catechol/Boronate Complexation as a Smart Antibacterial System, Macromol. Biosci., 2016, 16(no. 12), 1815–1823, DOI:10.1002/mabi.201600311.
- S. lin Yang, Z. H. Wu, W. Yang and M. B. Yang, Thermal and mechanical properties of chemical crosslinked polylactide (PLA, Polym. Test., 2008, 27(8), 957–963, DOI:10.1016/j.polymertesting.2008.08.009.
- D. Y. Kim, J. W. Park, D. Y. Lee and K. H. Seo, Correlation between the crosslink characteristics and mechanical properties of natural rubber compound via accelerators and reinforcement, Polymers, 2020, 12(9), 1–14, DOI:10.3390/polym12092020.
- A. Matsumoto, et al., Further discussion on correlation between brittleness and inhomogeneous network structure of cross-linked resins originating in specific polymerization behavior of triallyl isocyanurate, Macromolecules, 2008, 41(21), 7938–7945, DOI:10.1021/ma800974s.
- T. Semba, K. Kitagawa, U. S. Ishiaku and H. Hamada, The effect of crosslinking on the mechanical properties of polylactic acid/polycaprolactone blends, J. Appl. Polym. Sci., 2006, 101(3), 1816–1825, DOI:10.1002/app.23589.
- T. Koch and S. Seidler, Correlations between indentation hardness and yield stress in thermoplastic polymers, Strain, 2009, 45(1), 26–33, DOI:10.1111/j.1475-1305.2008.00468.x.
- Z. Rajabalizadeh, D. Seifzadeh, A. Khodayari and S. Sohrabnezhad, Corrosion protection and mechanical properties of the electroless Ni-P-MOF nanocomposite coating on AM60B magnesium alloy, J. Magnes. Alloy., 2022, 10(8), 2280–2295, DOI:10.1016/j.jma.2021.08.013.
- W. Zhang, Q. Liu, Y. Chen and G. Wan, Anodic dissolution dictates the negative difference effect (NDE) of magnesium corrosion more in chemical pathway, Mater. Lett., 2018, 232, 54–57, DOI:10.1016/j.matlet.2018.08.069.
- H. Pan, et al., Mechanistic study of ammonium-induced corrosion of AZ31 magnesium alloy in sulfate solution, J. Mater. Sci. Technol., 2020, 54, 1–13, DOI:10.1016/j.jmst.2020.02.074.
- Z. Rajabalizadeh and D. Seifzadeh, The effect of copper ion on microstructure, plating rate and anticorrosive performance of electroless Ni-P coating on AZ61 magnesium alloy, Prot. Met. Phys. Chem. Surfaces, 2014, 50(4), 516–523, DOI:10.1134/S2070205114040157.
- P. Shoghi, D. Seifzadeh, M. Gholizadeh-gheshlaghi and A. Habibi-yangjeh, Pretreatment-free Ni−P plating on magnesium alloy at low temperatures, Trans. Nonferrous Met. Soc. China, 2018, 28(12), 2478–2488, DOI:10.1016/S1003-6326(18)64894-0.
- C. Wang, J. Shen, F. Xie, B. Duan and X. Xie, A versatile dopamine-induced intermediate layer for polyether imides (PEI) deposition on magnesium to render robust and high inhibition performance, Corros. Sci., 2017, 122, 32–40, DOI:10.1016/j.corsci.2017.03.021.
- L. Zhang, E. A. A. Mohammed and A. Adriaens, Synthesis and electrochemical behavior of a magnesium fluoride-polydopamine-stearic acid composite coating on AZ31 magnesium alloy, Surf. Coatings Technol., 2016, 307, 56–64, DOI:10.1016/j.surfcoat.2016.08.021.
- F. Ge, Z. Cui, Y. Liu, L. Lei, X. Wang and H. Cui, Influence of ammonium sulfate on the corrosion behavior of AZ31 magnesium alloy in chloride environment, J. Magnes. Alloy., 2022 DOI:10.1016/j.jma.2022.07.014.
- A. D. Atrens, I. Gentle and A. Atrens, Possible dissolution pathways participating in the Mg corrosion reaction, Corros. Sci., 2015, 92, 173–181, DOI:10.1016/j.corsci.2014.12.004.
- F. Cao, et al., Corrosion of ultra-high-purity Mg in 3.5% NaCl solution saturated with Mg(OH)2, Corros. Sci., 2013, 75, 78–99, DOI:10.1016/j.corsci.2013.05.018.
- D. Zander and C. Schnatterer, The influence of manufacturing processes on the microstructure and corrosion of the AZ91D magnesium alloy evaluated using a computational image analysis, Corros. Sci., 2015, 98, 291–303, DOI:10.1016/j.corsci.2015.05.032.
- Y. Yang, et al., Mg bone implant: Features, developments and perspectives, Mater. Des., 2020, 185, 108259, DOI:10.1016/j.matdes.2019.108259.
- K. Webb, V. Hlady and P. A. Tresco, Relative importance of surface wettability and charged functional groups on NIH 3T3 fibroblast attachment, spreading, and cytoskeletal organization, J. Biomed. Mater. Res., 1998, 41(3), 422–430, DOI:10.1002/(SICI)1097-4636(19980905)41:3<422::AID-JBM12>3.0.CO;2-K.
- T. Mosmann, Rapid Colorimetric Assay for Cellular Growth and Survival: Application to Proliferation and Cytotoxicity Assays, J. Immunol. Methods, 1983, 65, 55–63 CrossRef CAS PubMed.
- L. Lei, Z. Cui, H. Pan, K. Pang, X. Wang and H. Cui, Effect of extrusion on the microstructure and corrosion behavior of Mg-Zn-Mn-(0, 1.5)Sr alloys in Hank's solution, Corros. Sci., 2022, 195, 109975, DOI:10.1016/j.corsci.2021.109975.
- J. L. McGrath, Cell Spreading: The Power to Simplify, Curr. Biol., 2007, 17(10), R357–R358, DOI:10.1016/j.cub.2007.03.057.
- E. Torreggiani, et al., Role of slug transcription factor in human mesenchymal stem cells, J. Cell. Mol. Med., 2012, 16(4), 740–751, DOI:10.1111/j.1582-4934.2011.01352.x.
- J.-S. Oh and E.-J. Lee, Enhanced Effect of Polyethyleneimine-Modified Graphene Oxide and Simvastatin on Osteogenic Differentiation of Murine Bone Marrow-Derived Mesenchymal Stem Cells, Biomedicines, 2022, 10, 1802–1814, DOI:10.3390/biomedicines9050501.
| This journal is © The Royal Society of Chemistry 2023 |

