DOI:
10.1039/D3MA00040K
(Paper)
Mater. Adv., 2023,
4, 1583-1589
A novel inorganic violet pigment based on zinc niobate
Received
23rd January 2023
, Accepted 15th February 2023
First published on 1st March 2023
Abstract
(Zn1−xCox)3Nb2O8 (0 ≤ x ≤ 0.50) samples were synthesized as novel inorganic violet pigments by a conventional solid-state reaction method, and the powders obtained were characterized by using X-ray powder diffraction (XRD), ultraviolet and visible (UV-Vis) diffuse reflectance spectroscopy, and L*a*b*Ch° chromatic coordinates defined by the Commission Internationale de l’Éclairage (CIE). The (Zn1−xCox)3Nb2O8 (0 ≤ x ≤ 0.20) pigments were obtained in a single phase form. The Co atoms introduced into the lattice occupied both octahedral and tetrahedral sites, and the amount of Co in both sites was almost the same. Considering the Laporte rule and the results of the Rietveld analysis, optical absorption was observed around 450 and 530–600 nm in the Co2+-doped samples, which was mainly due to the d–d transition of Co2+ in the tetrahedral site. The absorption intensity increased with increasing the Co2+ concentration. The most vibrant violet color was obtained with (Zn0.80Co0.20)3Nb2O8.
Introduction
Inorganic pigments are widely used in a variety of applications such as ceramics, glasses, and cosmetics, because they have high hiding powers and fine coloring properties.1–3 Among various colors, violet is known as one of the healing colors to have the effect of relieving tension.4 BaCuSi2O6 is the first synthesized inorganic violet pigment. This compound absorbs visible light corresponding to yellow-green and shows violet color due to the d–d transition of Cu2+ at the square planar tetracoordinate site.5,6 But, unfortunately, the chemical stability of BaCuSi2O6 is not high enough.7 Currently, several violet inorganic pigments are commercially available such as cobalt violet, Co3(PO4)2,8–10 and manganese violet, NH4MnP2O7,11 where Co2+ and Mn3+ are used as the color source, respectively. However, the chroma of these pigments is insufficient. Furthermore, it has been reported that NH4MnP2O7 decomposes at a low temperature of 340 °C.11
When a divalent cobalt ion is used as a color source, unfortunately, the pigment often turns blue, as seen in Co2SiO4 olivine,12 (Co, Zn)2SiO4 willemite,13 CoAl2O4 spinel,14 and Co2SnO4.15 Against this background, there is a strong demand for new violet inorganic pigments that are heat resistant and exhibit a bright violet color, and several targeted studies have been conducted.7,16,17 In this study, we focused on Zn3Nb2O8 as a host material of novel violet pigment containing Co2+ as a color source. This compound has a monoclinic layered structure with a space group of C2/c, consisting of octahedral 6-coordinated Zn2+ and Nb5+, and tetrahedral 4-coordinated Zn2+.18,19 Zn3Nb2O8 has attracted attention as a magnetic, dielectric, phosphorescent, and photocatalytic material,19–23 but has not yet been reported as a pigment. In a pilot experiment, we synthesized Co2+-doped Zn3Nb2O8 samples and found that they exhibited a violet color. In this study, therefore, (Zn1−xCox)3Nb2O8 (0 ≤ x ≤ 0.50) samples were synthesized and their colors were evaluated. The coordination environment around Co2+ was also investigated by crystal structure analysis.
Experimental
Materials and methods
The (Zn1−xCox)3Nb2O8 (0 ≤ x ≤ 0.50) samples were synthesized by a conventional solid-state reaction method. ZnO (Kishida Chemical, Japan), Nb2O5 (Wako Pure Chemical, Japan) and Co3O4 (Wako Pure Chemical, Japan) were used as the starting materials. The raw materials were mixed in a stoichiometric amount and ground in an agate mortar for 30 min. The mixture was calcined in an alumina crucible at 1000 °C for 6 h. The resulting samples were pulverized in an agate mortar before characterization.
Characterization
The sample composition was confirmed by X-ray Fluorescence spectroscopy (XRF: Rigaku, ZSX Primus). The crystal structure of the sample was identified by X-ray powder diffraction (XRD: Rigaku, Ultima IV) with Cu-Kα radiation (40 kV and 40 mA). The XRD data were collected by scanning a 2θ range of 20° to 80°, and the sampling width and the scan speed were 0.02° and 6.0° min−1, respectively. The unit cell volume was calculated with the CellCalc Ver 2.20 software from the refined XRD peak angles using α-Al2O3 as a standard. Rietveld analysis for the XRD patterns obtained in the 2θ range of 10–120° for (Zn1−xCox)3Nb2O8 (x = 0 and 0.20) was carried out by the RIETAN-FP software package24 to refine the crystal structure and to investigate the site occupancy of Co2+ at two non-equivalent Zn2+ sites.
The size and morphology of (Zn1−xCox)3Nb2O8 (x = 0, 0.10, 0.15 and 0.20) were observed using a field-emission-type scanning electron microscope (FE-SEM: JEOL, JSM-6701F). The optical reflectance spectra of the samples were measured with an ultraviolet-visible-near infrared (UV-vis-NIR) spectrometer (JASCO, V-770) with reference to a standard white plate. The color properties of the samples were evaluated on the Commission Internationale de l'Éclairage (CIE) L*a*b*Ch° system using a chroma meter (Konica-Minolta, CR-400), under the following conditions: illuminant C and pulsed xenon lamp as a default light source. This instrument was calibrated with standard calibration plates provided by the manufacturer. The L* parameter describes the brightness or the darkness of a color with respect to neutral greyscale, while the parameter a* (the red–green axis) and b* (the yellow–blue axis) parameters quantitatively describe the color. The chroma parameter (C) represents the color saturation of the pigments, and it is calculated by the following formula: C = [(a*)2 + (b*)2]1/2. The hue angle h° ranges from 0 to 360, and it is calculated by the formula, h° = tan−1(b*/a*).
Results and discussion
X-ray fluorescence analysis (XRF)
The XRF analysis results of the samples are listed in Table 1. The sample compositions were in good agreement with the nominal stoichiometric compositions of the starting mixtures.
Table 1 Chemical compositions of the (Zn1−xCox)3Nb2O8 (0 ≤ x ≤ 0.50) pigments
| Stoichiometric composition |
Analyzed composition |
| Zn3Nb2O8 |
Zn2.93Nb2.07O8.11 |
| (Zn0.90Co0.10)3Nb2O8 |
(Zn0.88Co0.10)3Nb2.06O8.09 |
| (Zn0.85Co0.15)3Nb2O8 |
(Zn0.83Co0.15)3Nb2.05O8.07 |
| (Zn0.80Co0.20)3Nb2O8 |
(Zn0.78Co0.20)3Nb2.06O8.09 |
| (Zn0.75Co0.25)3Nb2O8 |
(Zn0.73Co0.25)3Nb2.04O8.07 |
| (Zn0.70Co0.30)3Nb2O8 |
(Zn0.68Co0.30)3Nb2.05O8.07 |
| (Zn0.60Co0.40)3Nb2O8 |
(Zn0.59Co0.40)3Nb2.04O8.07 |
| (Zn0.50Co0.50)3Nb2O8 |
(Zn0.49Co0.50)3Nb2.05O8.10 |
X-ray powder diffraction (XRD) and scanning electron microscopy (SEM)
Fig. 1 shows the XRD patterns of the (Zn1−xCox)3Nb2O8 (0 ≤ x ≤ 0.50) pigments. The samples were obtained in a single-phase form of the monoclinic Zn3Nb2O8 phase (space group: C2/c) in the range of 0 ≤ x ≤ 0.20. However, in the range of 0.25 ≤ x ≤ 0.50, Co4Nb2O9 and CoNb2O6 were observed as impurities, and the sample became a mixed phase. As the Co2+ content increased, the diffraction peaks shifted to higher angles. The cell volumes of the (Zn1−xCox)3Nb2O8(0 ≤ x ≤ 0.50) samples calculated from the diffraction angles are summarized in Table 2, where the numbers in parentheses indicate estimated standard deviations.
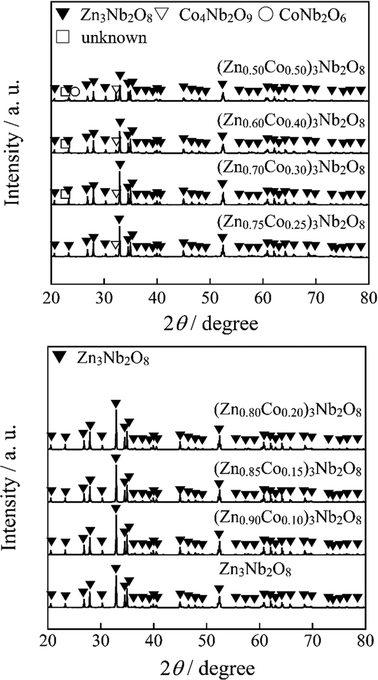 |
| | Fig. 1 XRD patterns of the (Zn1−xCox)3Nb2O8 (0 ≤ x ≤ 0.50) pigments. | |
Table 2 Cell volumes of (Zn1−xCox)3Nb2O8 (0 ≤ x ≤ 0.50). The numbers in parentheses indicate estimated standard deviations
| Sample |
Cell volume/nm3 |
| Zn3Nb2O8 |
0.58333(8) |
| (Zn0.90Co0.10)3Nb2O8 |
0.58290(6) |
| (Zn0.85Co0.15)3Nb2O8 |
0.58273(6) |
| (Zn0.80Co0.20)3Nb2O8 |
0.58238(4) |
| (Zn0.75Co0.25)3Nb2O8 |
0.58232(11) |
| (Zn0.70Co0.30)3Nb2O8 |
0.58226(10) |
| (Zn0.60Co0.40)3Nb2O8 |
0.58215(11) |
| (Zn0.50Co0.50)3Nb2O8 |
0.5821(2) |
Since a part of Zn2+ (ionic radius: 0.060 nm)25 was replaced with Co2+ (ionic radius: 0.058 nm),25 the cell volume monotonically decreased as Co2+ increased in the x range of 0 ≤ x ≤ 0.20. On the other hand, in the 0.20 ≤ x region, the degree of lattice shrinkage became smaller than that in the low concentration region. This result indicates that some Co2+ ions doped into the samples were not introduced into the lattice, which corresponds to the fact that Co4Nb2O9 and CoNb2O6 were observed as impurities. Based on the above results, 0 ≤ x ≤ 0.20 was the range of the (Zn1−xCox)3Nb2O8 solid solutions.
Fig. 2 shows the SEM images of (Zn1−xCox)3Nb2O8 (x = 0, 0.10, 0.15 and 0.20). There was almost no change in the shape and surface condition of the particles, but the particle size slightly increased when Co2+ was dissolved into the Zn3Nb2O8 lattice. For the Co2+-doped samples, on the other hand, almost no change in the morphologies as well as the particle sizes was observed.
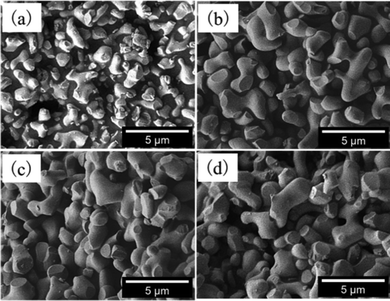 |
| | Fig. 2 SEM images of (Zn1−xCox)3Nb2O8; x = 0 (a), x = 0.10 (b), x = 0.15 (c), and x = 0.20 (d). | |
Rietveld analysis
The Rietveld refinements of the XRD patterns recorded for the (Zn1−xCox)3Nb2O8 (x = 0 and 0.20) samples were performed to estimate the site occupancies of the Co2+ ions at the two non-equivalent Zn2+ sites. The Rietveld refinement profiles of the samples are shown in Fig. 3, and the crystallographic and structural parameters are summarized in Tables 3 and 4, respectively. The schematic illustration of the (Zn0.80Co0.20)3Nb2O8 structure refined by Rietveld analysis is shown in Fig. 4, which was represented by the VESTA program.26 The low R-factors were obtained for both (Zn1−xCox)3Nb2O8 (x = 0 and 0.20) samples. As illustrated in Fig. 4, there are two non-equivalent Zn2+ sites in the lattice and the Zn1 and Zn2 sites are coordinated by six and four O2− ions, respectively. The Rietveld refinement revealed that the Co atoms occupied both octahedral Zn1 and tetrahedral Zn2 sites, as seen in Table 4. The values of multiplicity × occupancy (g) indicate the amount of the atoms in the unit cell. The multiplicity × g values of the Co atoms at the octahedral (Co1) and tetrahedral (Co2) sites were approximately the same, indicating that the Co atoms did not preferentially occupy only either the octahedral or tetrahedral site. In other words, the Co atoms occupy equally both sites.
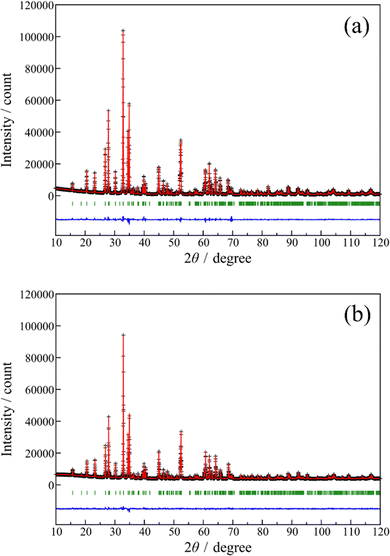 |
| | Fig. 3 Rietveld refinement profiles for the Zn3Nb2O8 (a) and (Zn0.80Co0.20)3Nb2O8 (b) samples. The black cross symbols and the solid red lines represent the observed and calculated intensities, respectively. The difference curves between the observed and calculated patterns are depicted as a blue line at the bottom. The green vertical bars represent the Bragg reflection peak. | |
Table 3 Crystallographic parameters of the (Zn1−xCox)3Nb2O8 (x = 0 and 0.20) samples analyzed by the Rietveld refinementa
|
|
x = 0 |
x = 0.20 |
|
Crystal system: monoclinic, space group: C2/c (No. 15), number of formula units per unit cell: Z = 4.
|
|
a/nm |
1.90155(2) |
1.899061(9) |
|
b/nm |
0.590289(5) |
0.590063(3) |
|
c/nm |
0.519690(4) |
0.519720(3) |
|
β/° |
90.0933(5) |
89.9923(11) |
|
V nm−3 |
0.583333(8) |
0.582380(5) |
|
R
wp/% |
6.20 |
1.94 |
|
R
p/% |
3.99 |
1.31 |
|
R
e/% |
2.07 |
1.41 |
|
S
|
2.99 |
1.37 |
|
R
F
/% |
2.24 |
2.56 |
Table 4 Structural parameters of the (Zn1−xCox)3Nb2O8 (x = 0 and 0.20) samples refined by Rietveld analysis
| Atom |
Site |
Occupancy (g) |
Multiplicity × g |
x
|
y
|
z
|
B
iso/Å2 |
|
The values of the isotropic atomic displacement parameters (Biso) of the zinc, niobium, and oxygen sites for the (Zn0.80Co0.20)3Nb2O8 (x = 0.20) sample were fixed to them for the Zn3Nb2O8 (x = 0) sample. The atomic positions and Biso of the Co1 and Co2 sites were constrained to be equal to those of the Zn1 and Zn2 sites.
The occupancies of the Zn1, Co1 and Zn2 sites were linearly constrained to be the stochiometric ratio; g(Zn1) = 0.4 + g(Co2), g(Co1) = 0.6 − g(Co2), g(Zn2) = 1 − g(Co2).
|
|
x = 0 |
| Zn1 |
4e |
1 |
4 |
0 |
0.6571(4) |
1/4 |
0.72(3) |
| Zn2 |
8f |
1 |
8 |
0.27863(6) |
0.1527(3) |
0.2589(4) |
= Biso(Zn1) |
| Nb |
8f |
1 |
8 |
0.11462(5) |
0.1636(2) |
0.2398(3) |
0.53(3) |
| O1 |
8f |
1 |
8 |
0.3197(4) |
0.3952(12) |
0.4465(12) |
0.88(6) |
| O2 |
8f |
1 |
8 |
0.1921(4) |
0.3530(13) |
0.1299(11) |
= Biso(O1) |
| O3 |
8f |
1 |
8 |
0.4287(4) |
0.3858(12) |
0.0655(13) |
= Biso(O1) |
| O4 |
8f |
1 |
8 |
0.0593(3) |
0.3723(14) |
0.4155(12) |
= Biso(O1) |
|
|
|
x = 0.20a |
| Zn1 |
4e |
0.718b |
2.82 |
0 |
0.6537(4) |
1/4 |
0.72 |
| Co1 |
4e |
0.282b |
1.13 |
= x(Zn1) |
= y(Zn1) |
= z(Zn1) |
= Biso(Zn1) |
| Zn2 |
8f |
0.841b |
6.72 |
0.27864(5) |
0.1531(3) |
0.2554(5) |
0.72 |
| Co2 |
8f |
0.159(7) |
1.27(6) |
= x(Zn2) |
= y(Zn2) |
= z(Zn2) |
= Biso(Zn2) |
| Nb |
8f |
1 |
8 |
0.11466(4) |
0.1634(2) |
0.2362(4) |
0.53 |
| O1 |
8f |
1 |
8 |
0.3209(3) |
0.3980(11) |
0.4442(11) |
0.88 |
| O2 |
8f |
1 |
8 |
0.1917(4) |
0.3617(12) |
0.1320(9) |
0.88 |
| O3 |
8f |
1 |
8 |
0.4265(3) |
0.3873(11) |
0.0627(11) |
0.88 |
| O4 |
8f |
1 |
8 |
0.0606(3) |
0.3676(13) |
0.4097(11) |
0.88 |
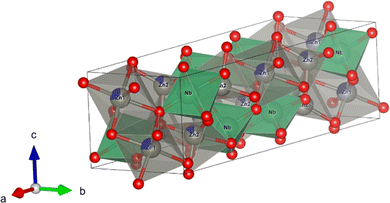 |
| | Fig. 4 Crystal structure of (Zn0.80Co0.20)3Nb2O8 (gray: Zn, blue: Co, green: Nb, red: O) refined by the Rietveld analysis. | |
Reflectance and absorbance spectra
The UV-vis reflectance and absorbance spectra of (Zn1−xCox)3Nb2O8 (0 ≤ x ≤ 0.50) are shown in Fig. 5. The absorbance spectra were the reflectance spectra that were transformed by using the Kubelka–Munk function, f(R) = (1 − R)2/2R, where R is reflectance.27 The undoped Zn3Nb2O8 (x = 0) sample exhibited high reflectance in the visible light region. On the other hand, when some Zn2+ ions in the lattice were substituted by Co2+ ions, optical absorption was observed at wavelengths of 450, 534, 585, and 654 nm. These optical absorption bands were due to the d–d transitions of Co2+, which were mainly tetrahedrally coordinated. As already discussed with respect to the result in Table 4, the Co atoms introduced in the lattice were located at the octahedral and tetrahedral sites and the amount of Co at both sites was almost the same. The octahedral site had parity symmetry while the tetrahedral site did not have an inversion center i. According to the Laporte rule,28 d–d transitions at the former and the latter sites are symmetric forbidden and allowed transitions, respectively. Therefore, the absorption intensities of the d–d transitions of Co2+ at the octahedral Zn1/Co1 site could be weaker than those at the tetrahedral Zn2/Co2 site. The main optical absorption bands for the Co2+-doped samples synthesized in this study could be principally assigned to the d–d transitions of Co2+ at the tetrahedral site.
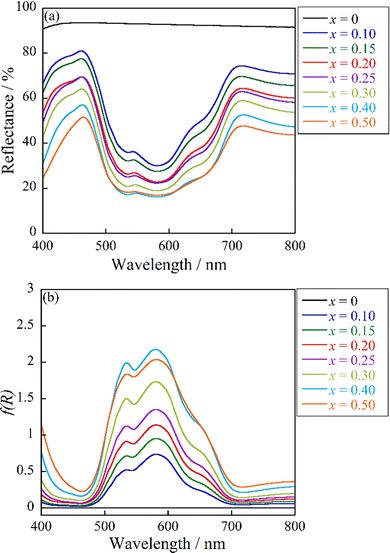 |
| | Fig. 5 UV-vis reflectance (a) and absorbance (b) spectra of the (Zn1−xCox)3Nb2O8 (0 ≤ x ≤ 0.50) pigments. | |
Accordingly, the absorption at 450 nm was attributed to the spin-forbidden transition from 4A2(4F) to 2T1(2P) and the three remaining absorptions at 534, 585, and 654 nm were assigned to the transitions from 4A2(4F) to 2A1(2G), 4T1(4P), and 2E(2G), respectively.29,30 All these assignments are d–d transitions of Co2+ in a tetrahedral coordination, and the contribution of the transition of the octahedral sites was small because of the above-mentioned reasons. The absorption intensity increased with increasing the Co2+ concentration.
Chromatic properties
The L*a*b*Ch° color coordinate data for the (Zn1−xCox)3Nb2O8 (0 ≤ x ≤ 0.50) pigments are summarized in Table 5. When Co2+ was introduced into the host Zn3Nb2O8 lattice, the absolute values of both redness (a*) and blueness (−b*) of the pigment became larger. As seen in Fig. 5, the (Zn1−xCox)3Nb2O8 pigments strongly absorbed the green-orange light (500-600 nm) and reflected the blue and red light. As a result, high redness and blueness were obtained, indicating that the Co2+-doped pigments exhibited a violet color. Among the samples synthesized in a single-phase form, (Zn0.80Co0.20)3Nb2O8 showed the greatest values (a* = +31.4, −b* = 50.1). The photographs of the (Zn1−xCox)3Nb2O8 (0 ≤ x ≤ 0.50) pigments are shown in Fig. 6. The color of the sample changed from white to bright violet with the introduction of Co2+.
Table 5
L*a*b*Ch° color coordinate data for the (Zn1−xCox)3Nb2O8 (0 ≤ x ≤ 0.50) pigments
|
X
|
L* |
a* |
b* |
C
|
h° |
| 0 |
98.7 |
+0.04 |
+0.63 |
0.63 |
86.4 |
| 0.10 |
65.2 |
+23.9 |
−42.5 |
48.8 |
299.4 |
| 0.15 |
59.2 |
+29.4 |
−48.9 |
57.1 |
301.0 |
| 0.20 |
54.3 |
+31.4 |
−50.1 |
59.1 |
302.1 |
| 0.25 |
52.9 |
+32.7 |
−51.6 |
61.1 |
302.4 |
| 0.30 |
48.3 |
+34.8 |
−53.1 |
63.5 |
303.2 |
| 0.40 |
43.3 |
+35.4 |
−53.1 |
63.8 |
303.7 |
| 0.50 |
39.7 |
+31.5 |
−48.6 |
57.9 |
302.9 |
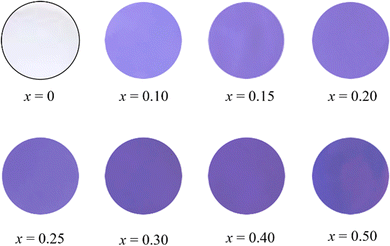 |
| | Fig. 6 Photographs of the (Zn1−xCox)3Nb2O8 (0 ≤ x ≤ 0.50) pigments. | |
Generally, the color tends to be brighter or lighter as the particle size of the pigment decreases.31 However, in this study, almost no change in the particle sizes and morphologies was observed for the Co-doped samples, as already discussed above regarding the results of Fig. 2. Accordingly, the color of the (Zn1−xCox)3Nb2O8 (0 ≤ x ≤ 0.50) samples depended on the Co2+ concentration, directly related to the optical absorption intensity.
Blue color is generally obtained when Co2+ is located in a tetrahedral site (e.g., cobalt blue: CoAl2O4). In contrast, Co2+ at an octahedral site often produces pink or violet (e.g., cobalt violet: Co3(PO4)2). In this study, the d–d transitions of Co2+ at the tetrahedral site were strongly observed, because those at the octahedral and tetrahedral sites were the symmetric forbidden and allowed transitions, respectively, as already discussed in the previous section. Accordingly, the bluish violet color was obtained for the Co2+-doped samples.
The color coordinate data of the (Zn0.80Co0.20)3Nb2O8 sample obtained in a single-phase form were compared with those of the commercially available Co3(PO4)2 and NH4MnP2O7 pigments (Holbein Works, Ltd.), as summarized in Table 6. Although the a* value of (Zn0.80Co0.20)3Nb2O8 was slightly lower than those of commercial pigments, the −b* and the C values were remarkably higher than those of the commercially available ones.
Table 6 The L*a*b*Ch° color coordinates of the (Zn0.80Co0.20)3Nb2O8 pigment and commercially available violet pigments
| Pigment |
L* |
a* |
b* |
C
|
h° |
| (Zn0.80Co0.20)3Nb2O8 |
54.3 |
+31.4 |
−50.1 |
59.1 |
302.1 |
| Co3(PO4)2 |
40.7 |
+42.9 |
−34.0 |
54.7 |
321.6 |
| NH4MnP2O7 |
41.0 |
+41.8 |
−27.5 |
50.0 |
326.7 |
Chemical stability tests
The chemical stability tests of the (Zn0.80Co0.20)3Nb2O8 pigment and the commercially available Co3(PO4)2 and NH4MnP2O7 pigments were evaluated using the powder samples. The acid/base resistance of these pigments was tested in 4% acetic acid and 4% ammonium bicarbonate solutions, and the sample was soaked into the acid/base solutions for 24 h. Then, the sample was washed with deionized water and ethanol, and then dried at room temperature for 24 h. The photographs of the (Zn0.80Co0.20)3Nb2O8 pigment and the commercial Co3(PO4)2 and NH4MnP2O7 pigments before/after the chemical stability tests are shown in Fig. 7. The color coordinate values of them before and after the leaching tests are summarized in Table 7. As seen in the photographs of the (Zn0.80Co0.20)3Nb2O8 pigment, the color was stable, and no change was observed. Since each value was almost the same before and after the test, the chemical stability of this pigment was quantitatively elucidated. On the other hand, the significant color degradation for the commercial Co3(PO4)2 and NH4MnP2O7 pigments was observed after the acidity and basicity tests, respectively. Therefore, the (Zn0.80Co0.20)3Nb2O8 pigment synthesized in this study has good potential to be an alternative to the conventional ones, because the present pigment has higher chroma (C) and chemical stability than them.
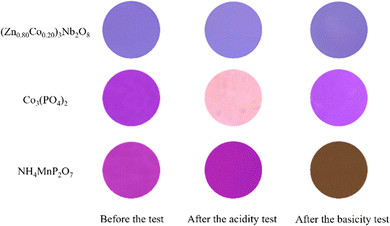 |
| | Fig. 7 Photographs of the (Zn0.80Co0.20)3Nb2O8 pigment and the commercial Co3(PO4)2 and NH4MnP2O7 pigments before/after chemical stability tests. | |
Table 7
L*a*b*Ch° color coordinates of the (Zn0.80Co0.20)3Nb2O8 pigment and the commercial Co3(PO4)2 and NH4MnP2O7 pigments before and after the chemical stability tests
| Pigment |
Treatment |
L* |
a* |
b* |
C
|
h° |
| (Zn0.80Co0.20)3Nb2O8 |
Non-treatment |
54.3 |
+31.4 |
−50.1 |
59.1 |
302.1 |
| 4% CH3COOH |
55.0 |
+31.1 |
−49.8 |
58.7 |
302.0 |
| 4% NH4HCO3 |
55.3 |
+30.5 |
−49.2 |
57.8 |
301.8 |
|
|
| Co3(PO4)2 |
Non-treatment |
40.7 |
+42.9 |
−34.0 |
54.7 |
321.6 |
| 4% CH3COOH |
81.6 |
+15.1 |
−4.05 |
15.6 |
345.0 |
| 4% NH4HCO3 |
46.1 |
+38.1 |
−32.2 |
49.9 |
319.8 |
|
|
| NH4MnP2O7 |
Non-treatment |
41.0 |
+41.8 |
−27.5 |
50.0 |
326.7 |
| 4% CH3COOH |
41.3 |
+43.3 |
−27.1 |
51.1 |
327.9 |
| 4% NH4HCO3 |
33.6 |
+12.5 |
+19.0 |
22.8 |
55.6 |
Conclusions
Novel violet inorganic pigments based on Zn3Nb2O8 were synthesized by a solid-state reaction method. The color of Zn3Nb2O8 changed from white to bright violet when Co2+ was doped. The samples were obtained as a single-phase solid solution in the range of 0 ≤ x ≤ 0.20 in (Zn1−xCox)3Nb2O8, but some impurities were observed in the range of 0.25 ≤ x ≤ 0.50. The Rietveld refinement revealed that the Co atoms occupied both octahedral Zn1 and tetrahedral Zn2 sites, and the amount of the Co atoms at octahedral and tetrahedral sites was almost the same. The Co2+-doped samples strongly absorbed visible light from 530 to 600 nm (green to orange light) due to the d–d transition of Co2+ and reflected blue and red light. These optical absorption bands were mainly attributed to the d–d transitions of Co2+ at the tetrahedral site, considering the Laporte rule and the results of the Rietveld refinement. Among the samples obtained in a single-phase form, (Zn0.80Co0.20)3Nb2O8 showed the most vivid violet color, where the L*a*b*Ch° parameters were L* = 54.3, a* = +31.4, b* = −50.1, C = 59.1, and h° = 302.1. Furthermore, the (Zn0.80Co0.20)3Nb2O8 pigment has higher chemical stability and chroma than the commercial violet pigments. These characteristics indicate that this pigment has good potential to be an alternative to the conventional Co3(PO4)2 and NH4MnP2O7 pigments.
Conflicts of interest
There are no conflicts to declare.
Acknowledgements
This work was supported by JSPS KAKENHI (Grant Numbers JP20H02439 and JP22K04698).
References
-
E. B. Faulkner and R. J. Schwartz, High Performance Pigments, Wiley-VCH, 2nd edn, 2009 Search PubMed.
- K. J. Sreeram, R. Srinivasan, J. M. Devi, B. U. Nair and T. Ramasami, Dyes Pigm., 2007, 75, 687–692 CrossRef CAS.
- S. Chen, M. Cai and X. Ma, J. Alloys Compd., 2016, 689, 36–40 CrossRef CAS.
- M. Kido, J. Intl. Soc. Life Inf. Sci., 2000, 18, 254–268 Search PubMed.
- Y. Chen, Y. Zhang and S. Feng, Dyes Pigm., 2014, 105, 167–173 CrossRef CAS.
- D. A. Corona-Martínez, J. C. Rendón-Angesles, L. A. Gonzalez, Z. Matamoros-Veloza, K. Yanagisawa, A. Tamayo and J. R. Alonso, Adv. Powder Technol., 2019, 30, 1473–1483 CrossRef.
- P. K. Thejus, B. Koley and K. G. Nishanth, Dyes Pigm., 2018, 158, 267–276 CrossRef CAS.
- S. Meseguer, M. A. Tena, C. Gargori, J. A. Badenes, M. Llusar and G. Monrós, Ceram. Int., 2007, 33, 843–849 CrossRef CAS.
- B. Serment, L. Corucho, A. Demourgues, G. HadZiioannou, C. Brochon, E. Cloutet and M. Gaudon, Inorg. Chem., 2019, 58, 7499–7510 CrossRef CAS.
- M. Hunault, J.-L. Robert, M. Newville, L. Galoisy and G. Calas, Spectrochim. Acta, Part A, 2014, 117, 406–412 CrossRef CAS PubMed.
- Y. Begum and A. J. Wright, J. Mater. Chem., 2012, 22, 21110–21116 RSC.
- K. Ullrich, O. Ott, K. Langer and K. D. Becker, Phys. Chem. Miner., 2004, 31, 247–260 CrossRef CAS.
- L. C. K. de Souza, J. R. Zamian, R. G. N. da Filho, L. E. B. Soledade, I. M. G. dos Santos, A. G. Souza, T. Scheller, R. S. Angélica and C. E. F. da Costa, Dyes Pigm., 2009, 81, 187–192 CrossRef CAS.
- J. Merikhi, H. O. Jungk and C. Feldmann, J. Mater. Chem., 2000, 10, 1311–1314 RSC.
- A. Shamirian, M. Edrisi and M. Naderi, J. Mater. Eng. Perform., 2013, 22, 306–311 CrossRef CAS.
- T. Tsukimori, Y. Shobu, R. Oka and T. Masui, RSC Adv., 2018, 8, 9017–9022 RSC.
- S. Tamilarasan, D. Sarma, S. Bhattacharjee, U. V. Waghmare, S. Natarajan and J. Gopalakrishnan, Inorg. Chem., 2013, 52, 5757–5763 CrossRef CAS PubMed.
- T. H. Noh, I.-S. Cho, S. Lee, D. W. Kim, S. Park, S. W. Seo, C. W. Lee and K. S. Hong, J. Am. Ceram. Soc., 2012, 95, 227–231 CrossRef CAS.
- W.-R. Yang, C.-C. Pan and C.-L. Huang, J. Alloys Compd., 2013, 581, 257–262 CrossRef CAS.
- L. Li, H. Sun, X. Lv and S. Li, J. Mater. Sci.: Mater. Electron., 2015, 26, 7026–7031 CrossRef CAS.
- Y. Zhao and P. Zhang, J. Alloys Compd., 2016, 662, 455–460 CrossRef CAS.
- M.-C. Wu, K.-T. Huang and W.-F. Su, Mater. Chem. Phys., 2006, 98, 406–409 CrossRef CAS.
- X. Xiao and B. Yan, Mater. Sci. Eng. B, 2007, 136, 154–158 CrossRef CAS.
- F. Izumi and K. Momma, Solid Sate Phenom., 2007, 130, 15–20 CAS.
- R. D. Shannon, Acta Crystallogr., Sect. A: Cryst. Phys., Diffr., Theor. Gen. Crystallogr., 1976, 32, 751–767 CrossRef.
- K. Momma and F. Izumi, J. Appl. Crystallogr., 2011, 44, 1272–1276 CrossRef CAS.
- P. Kubelka and F. Munk, Z. Tech. Phys., 1931, 12, 593–601 Search PubMed.
- O. Laporte and W. F. Meggers, J. Opt. Soc. Am., 1925, 11, 459–463 CrossRef CAS.
- M. Ardit, G. Cruciani and M. Donbi, Am. Mineral., 2012, 97, 1394–1401 CrossRef CAS.
- L. Lin, Y. Wang, B. Lan, J. Chen, S. Lv, Y. Zhao, H. Yu, J. Hao, Q. Zhang, Z. Yang, H. Zhang, J. Wang, J. Qiu and S. Zhou, J. Phys. Chem. C, 2019, 123, 29343–29352 CrossRef CAS.
- S. Ke, Y. Wang and Z. Pan, Dyes Pigm., 2015, 118, 145–151 CrossRef CAS.
Footnote |
| † R. Oka and T. Masui are co-corresponding authors. |
|
| This journal is © The Royal Society of Chemistry 2023 |
Click here to see how this site uses Cookies. View our privacy policy here.  Open Access Article
 *b,
Yuga
Nomura
a and
Toshiyuki
Masui†
 *c
*c


