 Open Access Article
Construction of a La-ZnIn2S4/MIL-125(Ti) heterojunction for highly efficient photocatalytic degradation of aflatoxin B1
Xiaobing
Yang
 abc,
Junjie
Pan
c,
Bingcong
Xing
d,
Wenjie
Lei
b,
Yingchun
Fu
 *a and
Kejun
Cheng
*cd
aCollege of Biosystems Engineering and Food Science, Zhejiang University, Hangzhou 310058, Zhejiang Province, China. E-mail: ycfu@zju.edu.cn
bFujian Provincial Key Laboratory of Eco-Industrial Green Technology, Wuyi University, Wuyishan 354300, Fujian Province, China
cChemical Biology Center, Lishui Institute of Agriculture and Forestry Sciences, Lishui 323000, Zhejiang Province, China. E-mail: chengkejun@gmail.com
dZhejiang Province Key Laboratory of Resources Protection and Innovation of Traditional Chinese Medicine, Zhejiang A&F University, Hangzhou 311300, Zhejiang Province, China
First published on 13th January 2023
Abstract
Nowadays, aflatoxin B1 (AFB1) contamination is considered as one of the most common food safety issues for humans and animals. As one of the most advanced oxidation techniques, photocatalytic degradation can break down organic contaminants into nontoxic and harmless materials efficiently. In this paper, we explored the degradation efficiency of AFB1 by ZnIn2S4. To promote the photocatalytic degradation efficiency of AFB1, ZnIn2S4 was coupled with MIL-125(Ti) and then doped with La [this hybrid is denoted as La-ZnIn2S4/MIL-125(Ti)] to effectively convert it via photocatalytic generation of superoxide radicals (˙O2− and ˙OH) and achieve much enhanced photocatalytic performance, which is demonstrated by degrading 97.6% of AFB1. According to the transient photocurrent responses, the doping of La and coupling with MIL-125(Ti) can highly improve the efficient separation of the photoinduced electron–hole pairs on ZnIn2S4, leading to the effective conversion of OH− and O2 into ˙O2− and ˙OH, respectively, during the photodegradation process. This strategy of coupling with MOFs and doping with rare earth elements provides a facile and efficient method for degrading food pollutants produced by aflatoxins.
Introduction
In recent years, consumers and producers have drawn much attention to food safety. One of the most common food safety issues comes from mycotoxin contamination, which exists in a variety of products ranging from food to feed.1 Aflatoxins, as one of the most toxic and carcinogenic mycotoxins, are secondary fungal metabolites of Aspergillus flavus and Aspergillus parasiticus, especially aflatoxin B1 (AFB1), which has been listed as a type one carcinogen by the International Agency for Research on Cancer and probably causes serious effects in humans and animals, such as bleeding, chronic toxicity, carcinoma and immunosuppression even when exposed to an extremely low level.2–4 Aflatoxins have high chemical and thermal stability. It is difficult to destroy them and still they possess toxic activity even after being treated with high temperatures.5 Aflatoxins not only are one of the important threats to animal and human health, but also cause great economic losses all over the world.To reduce, eliminate, and prevent the risks in animals and humans, numerous methods have been utilized to remove or/and degrade aflatoxins. For example, Xu and his co-workers developed polydopamine-modified magnetic multi-wall carbon nanotubes for the adsorption and removal of aflatoxins and ochratoxins from vegetable oils.6 Xing and his team adopted roasting with a lemon juice and/or citric acid method to remove aflatoxin B1.7 Xing and his co-workers used a Spin-X centrifuge system to investigate the AFB1 degradation of atoxigenic GZ15 and JZ2.8 Although these strategies can remove or/and reduce aflatoxins to some degree, they are restricted by some factors. For example, the adsorption of aflatoxins can bring secondary contamination, the chemical method will leave some chemicals in the environment, and the gene method is restricted by the technical requirements.9,10 Moreover, with the growing demands for food safety and environmental protection, it is vital to develop newer and greener technologies that can break aflatoxins into nontoxic and harmless materials more efficiently, environment-friendly, and affordably.
As one of the most advanced oxidation techniques, photocatalysis technology can degrade organic contaminants with many benefits, such as efficiency, eco-friendliness, no secondary pollution, easy operation, and low cost.11 Photocatalysts, for example, ZnIn2S4, can break down the organic contaminants into non-toxic and harmless materials under UV or/and visible light irradiation. Hence, this technology holds great promise for detoxifying aflatoxins. However, the photocatalytic degradation efficiency of photocatalysts suffers from the rapid combination of the photoexcited electron–hole pairs.12 Some measures need to be taken to improve its photocatalytic activity. In this paper, we introduced a novel La doped ZnIn2S4 coupled with MIL-125(Ti) to form a unique composite structure of La-ZnIn2S4/MIL-125(Ti). It showed much improved photocatalytic decomposition of AFB1 with UV illumination. The influences of MIL-125(Ti) coupling and La doping on the AFB1 degradation efficiency of ZnIn2S4 were investigated, and the degradation mechanism of AFB1 by La-ZnIn2S4/MIL-125(Ti) was also systematically explored in detail.
Experimental
Materials
N,N-Dimethylformamide (DMF), ethanol, 1,4-dicarboxybenzene (C8H6O4), methanol, and tetrabutyl titanate (C16H36O4Ti) were bought from Sinopharm Chemical Reagent (Shanghai, China). Thioacetamide (CH3CSNH2), lanthanum nitrate [La(NO3)2], and aflatoxin B1 (AFB1) were obtained from Aladdin (Shanghai, China). Indium chloride (InCl3) and zinc chloride (ZnCl2) were supplied by Alfa Aesar (Shanghai, China). The chemicals were used directly since they were of analytical grade.Synthesis of the La-ZnIn2S4/MIL-125(Ti) catalyst
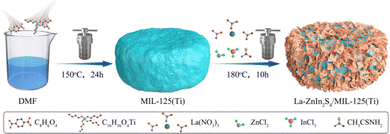
The MOF material of MIL-125(Ti) was synthesized using a method adopted from the previously published solvothermal synthesis.13 Typically, 5 g of C8H6O4 and 30 mL of ethanol were dissolved in 270 mL of DMF, by stirring at room temperature for 0.5 h. Then, 2.6 mL of C16H36O4Ti was mixed with the C8H6O4 solution followed by stirring for 15 min before being moved into a PTFE vessel (500 mL). The vessel was sealed and the solution was reacted for 24 h at 150 °C. White precipitates were collected by centrifugation at room temperature. The obtained MIL-125(Ti) solid sample was purified by washing with ethanol and DMF three times, and then dried at 80 °C.The La-ZnIn2S4/MIL-125(Ti) composite was synthesized using a modified hydrothermal process. 0.05 g of La(NO3)2, 0.677 g of InCl3, 0.455 g of CH3CSNH2, and 0.206 g of ZnCl2 were added to DMF (100 mL) followed by stirring at room temperature for 0.5 h until all the added chemical reagents were fully dissolved before adding 0.9 g of the synthesized MIL-125(Ti) crystallized particles. The mixture was stirred for 10 min before sealing in a 200 mL PTFE container. The sample was heated to 180 °C for 10 h. After reaction, a yellow powder was obtained by centrifugation, washed with ethanol three times, and dried at 80 °C. For comparison, ZnIn2S4 and ZnIn2S4/MIL-125(Ti) were fabricated using the same process without adding La(NO3)2. The synthesis procedure is illustrated in Fig. 1.
Characterization
The crystal structures were studied using a powder X-ray diffractometer (PXRD, D8 Advance, Bruker) using Cu Kα X-ray (λ = 1.54168 Å). The morphology of all samples was investigated by scanning electron microscopy (SEM, S4800, Hitachi, Japan). Infrared vibrational spectra were obtained using a Fourier transform infrared (FT-IR) spectrophotometer (Vector22, Bruker). Brunauer–Emmett–Teller (BET) specific surface areas were measured using the N2 adsorption–desorption isotherms at 77 K obtained using a BET analyzer (ASAP 2000, Micromeritics). The light absorption was recorded on a UV-Vis spectrometer (UV2450) equipped with diffuse reflectance (DRS) attachments. The photoelectrochemical properties, including the electrochemical impedance spectrum (EIS), were investigated on a CHI760E workstation. A scanning transmission electron microscope (TEM, JEM-2100HR, Jeol) was used to study the structure of the samples. Surface element composition and associated oxidation states were measured using an X-ray photoelectron spectrometer (XPS, Escalab 250Xi) equipped with Al Kα emission. Radical intermediates were identified by electron spin resonance (ESR) spectroscopy (A-300, Bruker) using spin trap 5,5-dimethyl-1-pyrroline N-oxide (DMPO) to identify the free radicals.Evaluation of photocatalytic activity
The photocatalytic degradation measurements were carried out in a photochemical reactor (SH-EJE-A, Shanghai EHE Instrument, China). A mercury lamp (500 W) was adopted as the UV light source. During the degradation experiment, the photocatalyst (0.05 g) was dispersed in a freshly prepared AFB1 aqueous solution (100 mL, 5 ppm). To eliminate the adsorption, the adsorption equilibrium was reached by stirring the suspension solution for 30 min without light. During irradiation, a small amount of solution was sampled from the photochemical vessel at certain duration. The solid photocatalyst was removed by centrifugation. The concentrations of AFB1 solution were detected using a UV-vis spectrophotometer. The stability of the photocatalyst was also evaluated by repeating the photodegradation for five recycles. At the end of each degradation reaction, the photocatalyst was collected, washed with water, and dried at 80 °C before the next degradation reaction.Results and discussion
Fig. 2 shows the XRD patterns and the FT-IR spectrum of La-ZnIn2S4/MIL-125(Ti) is compared with that of the ZnIn2S4/MIL-125(Ti) composite, together with those of the ZnIn2S4 and MIL-125(Ti) precursors. As shown in Fig. 2a, ZnIn2S4 exhibits three main peaks at 21.2°, 27.5°, and 47.7°, which are ascribed to the (006), (102), and (110) crystal planes of ZnIn2S4 (JCPDS No. 65-2023), respectively.14 MIL-125(Ti) exhibits six characteristic peaks at 7.10°, 9.86°, 11.99°, 15.35°, 16.89°, and 18.22°, indicating its formation.15,16 With the coupling of MIL-125(Ti) with ZnIn2S4, it shows the representative peaks of both MIL-125(Ti) and ZnIn2S4. Interestingly, the intensity corresponding to MIL-125(Ti) is not as strong as that without the coupling of ZnIn2S4. Thus, the coupling with ZnIn2S4 caused the structure and morphology changes of MIL-125(Ti). Other researchers have reported similar changes in the XRD patterns of the ZnIn2S4/MOF composites in the literature.17,18Fig. 2d shows the XRD spectrum of the La-ZnIn2S4/MIL-125(Ti) composite, which is almost the same as that of the composite without La coupling, indicating that the doping of La has no effects on the crystal structure.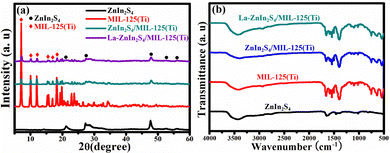 | ||
| Fig. 2 (a) XRD patterns and (b) FT-IR spectra of ZnIn2S4, MIL-125(Ti), ZnIn2S4/MIL-125(Ti) and La-ZnIn2S4/MIL-125(Ti). | ||
FT-IR spectra were recorded to study the functional groups and chemical bonding in different samples. As shown in Fig. 2b, all samples have a broad peak centered at 3470 cm−1 and two distinct absorption bands at 1610 and 1397 cm−1 from the absorbed water molecules.19 ZnIn2S4 exhibits similar characteristic peaks to the previous reports.20 The broad absorption band between 400 and 800 cm−1 for MIL-125(Ti) is assigned to the O–Ti–O vibration. Two clear absorptions at 1406 and 1653 cm−1 are linked to the O–C–O vibrational stretching.21 The C![[double bond, length as m-dash]](https://www.rsc.org/images/entities/char_e001.gif) C stretching in the aromatic ring peak is at 1510 cm−1.22 The feature at 1705 cm−1 is typical for a pristine BDC.23 ZnIn2S4/MIL-125(Ti) shows almost identical absorption bands to the MOF. However, a slight peak shift for the characteristic O–Ti–O peak was observed for ZnIn2S4/MIL-125(Ti), suggesting the chemical coupling between the MOF and ZnIn2S4. La-ZnIn2S4/MIL-125(Ti) has an almost identical IR spectrum to ZnIn2S4/MIL-125(Ti), inferring that the doping of La does not affect the molecular structure and the chemical bonding of ZnIn2S4/MIL-125(Ti).
C stretching in the aromatic ring peak is at 1510 cm−1.22 The feature at 1705 cm−1 is typical for a pristine BDC.23 ZnIn2S4/MIL-125(Ti) shows almost identical absorption bands to the MOF. However, a slight peak shift for the characteristic O–Ti–O peak was observed for ZnIn2S4/MIL-125(Ti), suggesting the chemical coupling between the MOF and ZnIn2S4. La-ZnIn2S4/MIL-125(Ti) has an almost identical IR spectrum to ZnIn2S4/MIL-125(Ti), inferring that the doping of La does not affect the molecular structure and the chemical bonding of ZnIn2S4/MIL-125(Ti).
The SEM images were used to analyze the morphologies of the precursors and composites. As shown in Fig. 3a, the MIL-125(Ti) MOF exhibited a plate-like crystallized morphology with a smooth surface, and its particle size is 350–600 nm. Fig. 3b shows the SEM image of ZnIn2S4, which shows a flower-like microsphere morphology with an average diameter of about 2 μm and the flower-like microsphere is assembled by numerous cross-linked nanosheets. As shown in the SEM image of ZnIn2S4/MIL-125(Ti) in Fig. 3c, many ZnIn2S4 nanosheets were attached on the surface facets of the MOF. According to Yuan's report, coating ZnIn2S4 nanosheets on MOFs can weaken the characteristic peaks,24 which is in agreement with the XRD patterns. No significant change of the morphology was observed in La-ZnIn2S4/MIL-125(Ti) (Fig. 3d) with respect to ZnIn2S4/MIL-125(Ti) (Fig. 3c). Hence, the structure of the ZnIn2S4/MIL-125(Ti) composite did not change after the La doping. TEM and HRTEM images were used to investigate further the morphology and internal structure of La-ZnIn2S4/MIL-125(Ti). As shown in Fig. 3b, ZnIn2S4 exhibits a flower-like spherical morphology with numerous aggregated nanosheets. However, when ZnIn2S4 is coupled with MIL-125(Ti) (Fig. 3e), its cross-linked nanosheets are disconnected and evenly distributed on the crystal planes of MIL-125(Ti). The high-magnification image in Fig. 3f shows the surface unfolded nanosheets. The high-magnification image of these unfolded nanosheets displays a clear lattice fringe of 0.32 nm, assigned to the ZnIn2S4 (102) crystal plane,25 indicating the successful coupling of ZnIn2S4 on the MIL-125(Ti) crystal surfaces. There are no signals for the La element in the unfolded nanosheets of ZnIn2S4, possibly due to low content.
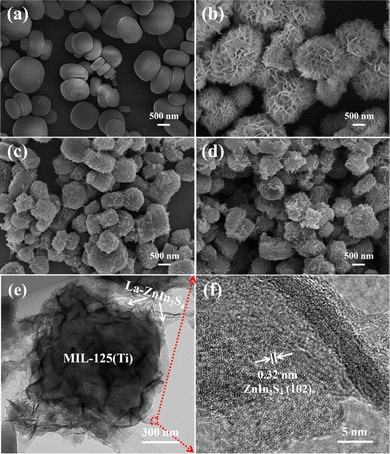 | ||
| Fig. 3 SEM images of (a) MIL-125(Ti), (b) ZnIn2S4, (c) ZnIn2S4/MIL-125(Ti), and (d) La-ZnIn2S4/MIL-125(Ti), and (e) TEM and (f) HRTEM images of La-ZnIn2S4/MIL-125(Ti). | ||
Fig. 4 shows the BET measurement results, summarized in Table 1, with the specific surface area (SBET, m2 g−1), total volume of the pore (Vtotal, cm3 g−1), total volume of the micropore (Vmicro, cm3 g−1), and pore diameter (D, nm). As displayed in Fig. 4a, ZnIn2S4 shows the type-IV isotherm with a distinct H3 hysteresis loop in the range from 0.47 to 1.00 (P/P0), confirming its mesoporous structure.26 The corresponding BET surface area is 45.14 m2 g−1. MIL-125(Ti) showed initial high adsorption of N2 at a relative pressure of 0–0.1 (P/P0), which belongs to the type-I isotherm and indicates its microporous structure.27Fig. 4c shows the adsorption–desorption curves of ZnIn2S4/MIL-125(Ti). It shows a high uptake at a relative pressure of 0–0.1 (P/P0) and the H3 hysteresis loop in the range from 0.47 to 1.00 (P/P0), illustrating that ZnIn2S4/MIL-125(Ti) has both the microporous and mesoporous structures. La-ZnIn2S4/MIL-125(Ti) (Fig. 4d) has a similar adsorption–desorption behavior to ZnIn2S4/MIL-125(Ti). The SBET of La-ZnIn2S4/MIL-125(Ti) is 650.65 m2 g−1 while the corresponding D is 2.91 nm, as shown in Table 1, which are almost the same as those of ZnIn2S4/MIL-125(Ti), confirming that the doping of La does not change the textural properties of ZnIn2S4/MIL-125(Ti).
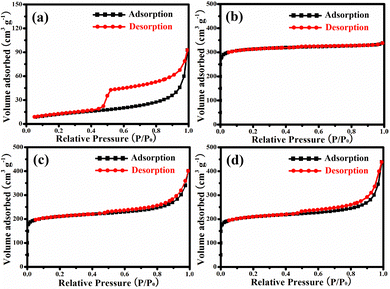 | ||
| Fig. 4 N2 adsorption–desorption isotherms of (a) ZnIn2S4, (b) MIL-125(Ti), (c) ZnIn2S4/MIL-125(Ti) and (d) La-ZnIn2S4/MIL-125(Ti). | ||
| Sample | S BET | V total | V micro | D |
|---|---|---|---|---|
| a Specific surface area (m2 g−1). b Total pore volume (cm3 g−1). c T-plot micropore volume (cm3 g−1). d Average pore diameter (nm). | ||||
| ZnIn2S4 | 45.14 | 0.144 | 0.004 | 6.49 |
| MIL-125(Ti) | 959.93 | 0.512 | 0.430 | 2.13 |
| ZnIn2S4/MIL-125(Ti) | 653.05 | 0.469 | 0.258 | 2.87 |
| La-ZnIn2S4/MIL-125(Ti) | 650.65 | 0.473 | 0.253 | 2.91 |
The optical absorption of the powder was analyzed using a UV-Vis DRS spectrophotometer. The following equation can be used to calculate the band gap energy (Eg): Eg = 1240/λ (λ is the absorption edge).28 MIL-125(Ti) displays a strong absorption between 300 and 350 nm, as shown in Fig. 5, which is assigned to the intrinsic band gap. ZnIn2S4 shows a visible light absorption edge near 494 nm with the corresponding band gap energy of 2.51 eV. When ZnIn2S4 is combined with MIL-125(Ti), its absorption edge is slightly broadened to 498 nm (Eg = 2.49 eV). More interestingly, the doping of La on ZnIn2S4/MIL-125(Ti) can further broaden its absorption edge from 498 to 504 nm (Eg = 2.46 eV). According to Table 1, MIL-125(Ti) recombining on ZnIn2S4 can improve its BET surface area. The doping of La and MIL-125(Ti) recombining on ZnIn2S4 can raise its adsorption capacity of contaminants and promote it to excite more photoexcited electrons and holes during the photocatalysis.
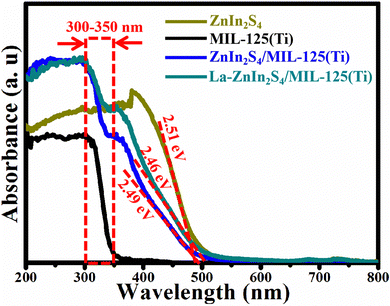 | ||
| Fig. 5 The UV-vis absorbance spectra of ZnIn2S4, MIL-125(Ti), ZnIn2S4/MIL-125(Ti) and La-ZnIn2S4/MIL-125(Ti). | ||
Generally, the excellent photoactivity of a photocatalyst is associated with the good charge separation efficiency. The photoelectrochemical technique was used to analyze the interfacial charge separation of photocatalysts. Fig. 6a shows the photocurrent response with the light on and off from different photoanodes under UV illumination for seven on–off cycles. With UV light, the photocurrents from the samples without La doping decreased rapidly to zero, attributed to the fast combination of photoinduced electron–hole pairs. The photocurrent density of ZnIn2S4/MIL-125(Ti) (1.48 μA cm−2) is higher than that of ZnIn2S4 (1.02 μA cm−2), indicating that the coupling of MIL-125(Ti) enhanced the photoactivity of ZnIn2S4. The photocurrent of La-ZnIn2S4/MIL-125(Ti) is 1.87 μA cm−2 and La-ZnIn2S4/MIL-125(Ti) exhibits the highest photocurrent density. Noticeably, when the UV light is switched on, the photocurrent of La-ZnIn2S4/MIL-125(Ti) decreases to a certain value and then slows down to zero, confirming that La-ZnIn2S4/MIL-125(Ti) has the best charge separation efficiency. The results verify that the doping of La and the coupling with MIL-125(Ti) can effectively enhance the efficiency of charge separation due to the transfer of photoinduced electrons from ZnIn2S4 to La and MIL-125(Ti). To explore the enhancement mechanism, the EIS measurements were carried out for different photoanodes. The semicircle size in the Nyquist plot for La-ZnIn2S4/MIL-125(Ti) is the smallest among all the samples, representing the lowest interface resistance of La-ZnIn2S4/MIL-125(Ti). Thus, La doping and MIL-125(Ti) coupling have improved the charge separation in ZnIn2S4 in the photoexcitation process.
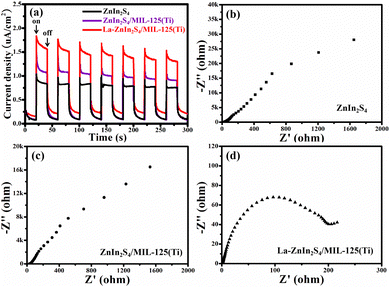 | ||
| Fig. 6 (a) Transient photocurrent responses and electrochemical impedance spectra of (b) ZnIn2S4, (c) ZnIn2S4/MIL-125(Ti) and (d) La-ZnIn2S4/MIL-125(Ti). | ||
The elemental composition and the chemical state of La-ZnIn2S4/MIL-125(Ti) were established by XPS. Fig. 7a shows the XPS survey spectrum of La-ZnIn2S4/MIL-125(Ti), in which the elements La, Zn, In, S, Ti, Ti, N, and O with sharp photoelectron peaks can be identified. However, the N intensity is relatively low, indicating low content of N, which may have come from the adsorbed N2. Fig. 7b shows the high-resolution La 3d XPS spectrum, which depicts four peaks with their binding energies centered at 834.7, 838.1, 852.5, and 854.9 eV, revealing the existence of La3+ ions.29 Compared with the standard XPS peaks of La 3d in pure La2O3, the La 3d spectrum of La-ZnIn2S4/MIL-125(Ti) shows a slight shift to a lower binding energy direction, indicating that La3+ ions are dissolved into the ZnIn2S4 lattice.30 The Zn 2p high resolution XPS spectrum in Fig. 7c shows two distinctive signals at 1021.8 and 1044.9 eV, associated with the spin orbit coupling. The high resolution In 3d XPS spectrum in Fig. 7d shows the In spin orbit coupling signals at 444.7 and 451.5 eV. As for the S 2p spectrum (Fig. 7e), its 2p3/2 and 2p1/2 signals were observed at 161.4 and 162.7 eV. As shown in Fig. 7f the C 1s spectrum has four components. The two peaks at lower energies of 284.4 and 285.1 eV are assigned to the C![[double bond, length as m-dash]](https://www.rsc.org/images/entities/char_e001.gif) C and C–C bonds, while the other two peaks at higher energies of 286.2 and 288.9 eV are associated with the carbon atoms bonded with oxygen in the C–O, and C
C and C–C bonds, while the other two peaks at higher energies of 286.2 and 288.9 eV are associated with the carbon atoms bonded with oxygen in the C–O, and C![[double bond, length as m-dash]](https://www.rsc.org/images/entities/char_e001.gif) O structures in BDC. Our XPS results verify the successful doping of La3+ in the La-ZnIn2S4/MIL-125(Ti) composite.
O structures in BDC. Our XPS results verify the successful doping of La3+ in the La-ZnIn2S4/MIL-125(Ti) composite.
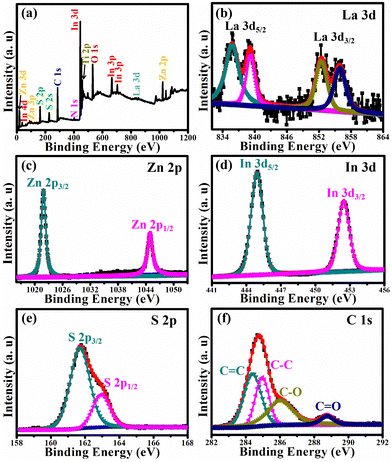 | ||
| Fig. 7 The XPS spectra of La-ZnIn2S4/MIL-125(Ti) with (a) survey spectrum, (b) La 3d, (c) Zn 2p, (d) In 3d, (e) S 2p, and (f) C 1s. | ||
The experiment for the degradation of AFB1 solution by photocatalysts was performed under UV light irradiation. Before the photocatalytic degradation, the photocatalysts were dispersed in the AFB1 solution by stirring for 30 min without light to achieve the adsorption equilibrium. Then, the solution was exposed to UV light. As shown in Fig. 8a, the concentration of AFB1 exhibits a slight decrease (the black line) without adding the catalyst under UV light irradiation, indicating the negligible self-degradation of AFB1. After 28 min of illumination, the photodegradation efficiencies of MIL-125(Ti) (51.4%), ZnIn2S4 (85.5%), ZnIn2S4/MIL-125(Ti) (89.5%), and La-ZnIn2S4/MIL-125(Ti) (97.6%) were achieved. The best photocatalytic performance was achieved by La-ZnIn2S4/MIL-125(Ti). Besides that, stability is also very important for the photocatalyst.
The experimental cycling runs of La-ZnIn2S4/MIL-125(Ti) are used to evaluate its stability. As displayed in Fig. 8b, after five times repetition, the degradation efficiency of La-ZnIn2S4/MIL-125(Ti) reduces by 3.1%, without changes in XRD patterns (Fig. 8c). Hence La-ZnIn2S4/MIL-125(Ti) offers excellent photocatalytic performance stability, in addition to its good structural stability.
The photoinduced reactive species (RS) are essential as the active intermediates produced during photocatalysis. ESR spectroscopy was used to examine the generated RS by La-ZnIn2S4/MIL-125(Ti) under UV light irradiation with DMPO as the radical trapper. As shown in Fig. 9, no ESR peak was visible without UV illumination. However, the four-line characteristic peak of DMPO-˙O2− and the 1![[thin space (1/6-em)]](https://www.rsc.org/images/entities/char_2009.gif) :
:![[thin space (1/6-em)]](https://www.rsc.org/images/entities/char_2009.gif) 1
1![[thin space (1/6-em)]](https://www.rsc.org/images/entities/char_2009.gif) :
:![[thin space (1/6-em)]](https://www.rsc.org/images/entities/char_2009.gif) 1 triplet characteristic peak of DMPO-˙OH are detected under UV light irradiation for 5 min, indicating that both ˙O2− and ˙OH are generated by La-ZnIn2S4/MIL-125(Ti) during the photocatalysis.
1 triplet characteristic peak of DMPO-˙OH are detected under UV light irradiation for 5 min, indicating that both ˙O2− and ˙OH are generated by La-ZnIn2S4/MIL-125(Ti) during the photocatalysis.
The photocatalysis performance of ZnIn2S4 was improved by the doping of La and the coupling of MIL-125(Ti), with improved charge separation. Herein, the enhanced photocatalytic performance of AFB1 degradation on the La-ZnIn2S4/MIL-125(Ti) photocatalyst with UV excitation is explored, and the possible schematic diagram is shown in Fig. 10. With UV illumination, valence electrons in ZnIn2S4 are excited to the conduction band. The excited electrons are easily moved to La and MIL-125(Ti), resulting in an effective charge separation. Then, the photoinduced electron can combine with O2 to form ˙O2− and the photoinduced hole can capture the electron from OH− to generate ˙OH. These generated ˙O2− and ˙OH have high oxidation. AFB1 can be oxidized by superoxide radicals (˙O2− and ˙OH). Furthermore, MIL-125(Ti) and ZnIn2S4 exhibit excellent adsorption properties for AFB1. They can adsorb AFB1 molecules on their surface or/and in their pores to form a layer of high concentration AFB1 molecules. It is also beneficial for superoxide radicals (˙O2− and ˙OH) to degrade AFB1 molecules. The elementary reaction equations are shown as follows:
| La-ZnIn2S4/MIL-125(Ti) + AFB1 MIL-125(Ti2S4/MIL-125(Ti) + AFB1)adsorption | (1) |
| La-ZnIn2S4/MIL-125(Ti) + hv → La-ZnIn2S4/MIL-125(Ti)(e−/h+) → (e− + h+) | (2) |
| e− + O2 + ˙O2− | (3) |
| e− + OH− + ˙OH | (4) |
| ˙O2− + (La-ZnIn2S4/MIL-125(Ti) + AFB1)adsorption dsoxidant products | (5) |
| ˙OH + (La-ZnIn2S4/MIL-125(Ti) + AFB1)adsorption dsoxidant products | (6) |
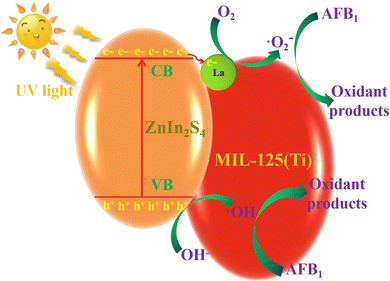 | ||
| Fig. 10 Illustration of the photocatalytic mechanism of AFB1 degradation on the La-ZnIn2S4/MIL-125(Ti) photocatalyst under UV light irradiation. | ||
Conclusions
In conclusion, we successfully fabricated the La doped ZnIn2S4/MIL-125(Ti) composite via a solvothermal method, which exhibits the best photocatalytic performance in the AFB1 degradation with UV excitation. After 28 min of UV light irradiation, La-ZnIn2S4/MIL-125(Ti) can degrade 97.6% of AFB1, the highest among all samples. It was demonstrated that the doping of La and the coupling with MIL-125(Ti) could narrow the band gap energy, improve the BET surface area and enhance the charge separation and electron transfer of ZnIn2S4, resulting in the drastic enhancement of photocatalysis. The electron spin resonance (ESR) technique also verified that ˙OH and ˙O2− are the reactive radicals for the decomposition of AFB1 during the photodegradation process. This study provided a novel strategy to fabricate semiconductor-based photocatalysts with enhanced photocatalytic performance to eliminate and prevent the AFB1 contamination in the food security areas.Author contributions
Xiaobing Yang: formal analysis, preparation and characterization of the samples, and writing – original draft preparation. Junjie Pan, Bingcong Xing and Wenjie Lei: preparation and characterization of the samples and carrying out the photocatalytic degradation testing. Yingchun Fu and Kejun Cheng: providing the idea of this work and designing relevant experiments, writing – review and editing, and funding acquisition.Conflicts of interest
There are no conflicts to declare.Acknowledgements
The authors wish to acknowledge financial support from the Postdoctoral Science Fund of Lishui City (20201030-Y), the Natural Science Foundation of Fujian Province (2022J011201), the Program for Outstanding Young Scientific Research Talents in Fujian Province University (MinKeJiao, 2018, No 47) and the Shiyanjia Lab (http://www.shiyanjia.com) for the XPS analysis.Notes and references
- M. S. Samuel, K. Mohanraj, N. Chandrasekar, R. Balaji and E. Selvarajan, Synthesis of recyclable GO/Cu3(BTC)2/Fe3O4 hybrid nanocomposites with enhanced photocatalytic degradation of aflatoxin B1, Chemosphere, 2022, 291, 132684 CrossRef CAS PubMed.
- O. A. Adebo, P. B. Njobeh and V. Mavumengwana, Degradation and detoxification of AFB1 by Staphylocococcus warneri, Sporosarcina sp. and Lysinibacillus fusiformis, Food Control, 2016, 68, 92–96 CrossRef CAS.
- P. B. Mathur, S. Sunkara, M. B. Panwar, F. Waliyar and F. W. K. K. Sharma, Biotechnological advances for combating Aspergillus flavus and aflatoxin contamination in crops, Plant Sci., 2015, 234, 119–132 CrossRef PubMed.
- S. Marin, A. J. Ramos, G. C. Sancho and V. Sanchis, Mycotoxins: occurrence, toxicology, and exposure assessment, Food Chem. Toxicol., 2013, 60, 218–237 CrossRef CAS PubMed.
- L. Mao, H. Liu, L. Yao, W. Wen, M. M. Chen, X. Zhang and S. Wang, Construction of a dual-functional CuO/BiOCl heterojunction for high-efficiently photoelectrochemical biosensing and photoelectrocatalytic degradation of aflatoxin B1, Chem. Eng. J., 2022, 429, 132297 CrossRef CAS.
- H. Xu, J. Sun, H. Wang, Y. Zhang and X. Sun, Adsorption of aflatoxins and ochratoxins in edible vegetable oils with dopamine-coated magnetic multi-walled carbon nanotubes, Food Chem., 2021, 365, 130409 CrossRef CAS PubMed.
- H. Rastegar, S. Shoeibi, H. Yazdanpanah, M. Amirahmadi, A. M. Khaneghah, F. B. Campagnollo and A. S. Sant’Ana, Removal of aflatoxin B1 by roasting with lemon juice and/or citric acid in contaminated pistachio nuts, Food Control, 2017, 71, 279–284 CrossRef CAS.
- F. Xing, L. Wang, X. Liu, J. N. Selvaraj, Y. Wang, Y. Zhao and Y. Liu, Aflatoxin B1 inhibition in Aspergillus flavus by Aspergillus niger through downregulating expression of major biosynthetic genes and AFB1 degradation by atoxigenic A. flavus, Int. J. Food Microbiol., 2017, 256, 1–10 CrossRef CAS PubMed.
- P. Yang, S. Lu, W. Xiao, Z. Zheng, S. Jiang, S. Jiang, S. Jiang, J. Cheng and D. Zhang, Activity enhancement of Trametes versicoloraflatoxin B1-degrading enzyme (TV-AFB1D) by molecular docking and site-directed mutagenesis techniques, Food Bioprod. Process., 2021, 129, 168–175 CrossRef CAS.
- P. Udomkun, A. N. Wiredu, M. Nagle, J. Müller, B. Vanlauwe and R. Bandyopadhyay, Innovative technologies to manage aflatoxins in foods and feeds and the profitability of application-A review, Food Control, 2017, 76, 127–138 CrossRef CAS PubMed.
- D. S. Bhatkhande, V. G. Pangarkar and A. A. C. M. Beenackers, Photocatalytic degradation for environmental applications-a review, J. Chem. Technol. Biotechnol., 2002, 77, 102–116 CrossRef CAS.
- Y. Kumar, P. Kumar, P. Raizada, A. A. P. Khan, Q. V. Le, P. Singh and V. H. Nguyen, Novel Z-Scheme ZnIn2S4-based photocatalysts for solar-driven environmental and energy applications: Progress and perspectives, J. Mater. Sci. Technol., 2021, 87, 234–257 CrossRef CAS.
- W. Jiang, Z. Li, C. Liu, D. Wang, G. Yan, B. Liu and G. Che, Enhanced visible-light-induced photocatalytic degradation of tetracycline using BiOI/MIL-125(Ti) composite photocatalyst, J. Alloys Compd., 2021, 854, 157166 CrossRef CAS.
- F. Mu, Q. Cai, H. Hu, J. Wang, Y. Wang, S. Zhou and Y. Kong, Construction of 3D hierarchical microarchitectures of Z-scheme UiO-66-(COOH)2/ZnIn2S4 hybrid decorated with non-noble MoS2 cocatalyst: A highly efficient photocatalyst for hydrogen evolution and Cr(VI) reduction, Chem. Eng. J., 2020, 384, 123352 CrossRef CAS.
- X. Yuan, H. Wang, Y. Wu, G. Zeng, X. Chen, L. Leng, Z. Wu and H. Li, One-pot self-assembly and photoreductionsynthesis of silver nanoparticle-decoratedreduced graphene oxide/MIL-125(Ti) photocatalyst with improved visible light photocatalytic activity, Appl. Organomet. Chem., 2016, 30, 289–296 CrossRef CAS.
- H. Wang, X. Yuan, Y. Wu, G. Zeng, H. Dong, X. Chen, L. Leng, Z. Wu and L. Peng, In situ synthesis of In2S3@MIL-125(Ti) core-shell microparticle for the removal of tetracycline from wastewater by integrated adsorption and visible-light-driven photocatalysis, Appl. Catal., B, 2016, 186, 19–29 CrossRef CAS.
- S. Mao, J. W. Shi, G. Sun, D. Ma, C. He, Z. Pu, K. Song and Y. Cheng, Au nanodots@thiol-UiO66@ZnIn2S4 nanosheets with significantly enhanced visible-light photocatalytic H2 evolution: The effect of different Au positions on the transfer of electron-hole pairs, Appl. Catal., B, 2021, 282, 119550 CrossRef CAS.
- M. Cao, F. Yang, Q. Zhang, J. Zhang, L. Zhang, L. Li, X. Wang and W. L. Dai, Facile construction of highly efficient MOF-based Pd@UiO-66-NH2@ZnIn2S4 flower-like nanocomposites for visible-light-driven photocatalytic hydrogen production, J. Mater. Sci. Technol., 2021, 76, 189–199 CrossRef CAS.
- B. Gao, L. F. Liu, J. D. Liu and F. L. Yang, Photocatalytic degradation of 2,4,6-tribromophenol over Fe-doped ZnIn2S4: Stable activity and enhanced debromination, Appl. Catal., B, 2013, 129, 89–97 CrossRef CAS.
- Q. Zhu, Y. Sun, S. Xu, Y. Li, X. Lin and Y. Qin, Rational design of 3D/2D In2O3 nanocube/ZnIn2S4 nanosheet heterojunction photocatalyst with large-area “high-speed channels” for photocatalytic oxidation of 2,4-dichlorophenol under visible light, J. Hazard. Mater., 2020, 382, 121098 CrossRef CAS PubMed.
- J. Ding, Z. Q. Yang, C. He, X. W. Tong, Y. Li, X. J. Niu and H. G. Zhang, UiO-66(Zr) coupled with Bi2MoO6 as photocatalyst for visible-light promoted dye degradation, J. Colloid Interface Sci., 2017, 497, 126–133 CrossRef CAS PubMed.
- H. Fakhri, M. Farzadkia, V. Srivastava and M. Sillanpää, Designed synthesis of perylene diimide-based supramolecular heterojunction with g-C3N4@MIL-125(Ti): insight into photocatalytic performance and mechanism, J. Mater. Sci.: Mater. Electron., 2021, 32, 19–32 CrossRef CAS.
- S. Yin, Y. Chen, C. Gao, Q. Hu, M. Li, Y. Ding, J. Di, J. Xia and H. Li, In-situ preparation of MIL-125(Ti)/Bi2WO6 photocatalyst with accelerating charge carriers for the photodegradation of tetracycline hydrochloride, J. Photochem. Photobiol., A, 2020, 387, 112149 CrossRef CAS.
- R. Yuan, J. Qiu, C. Yue, C. Shen, D. Li, C. Zhu, F. Liu and A. Li, Self-assembled hierarchical and bifunctional MIL-88A(Fe)@ZnIn2S4 heterostructure as a reusable sunlight-driven photocatalyst for highly efficient water purification, Chem. Eng. J., 2020, 401, 126020 CrossRef CAS.
- Z. Zhang, L. Huang, J. Zhang, F. Wang, Y. Xie, X. Shang, Y. Gu, H. Zhao and X. Wang, In situ constructing interfacial contact MoS2/ZnIn2S4 heterostructure for enhancing solar photocatalytic hydrogen evolution, Appl. Catal., B, 2018, 233, 112–119 CrossRef CAS.
- Y. Zhao, Y. Chen, L. Du, Q. Wang, X. Liu, L. Li and G. Tian, Fabrication of size-controlled hierarchical ZnS@ZnIn2S4 heterostructured cages for enhanced gas-phase CO2 photoreduction, J. Colloid Interface Sci., 2022, 605, 253–262 CrossRef CAS PubMed.
- X. B. Yang, Z. Yang, S. Zhao, J. Hu and X. Luo, Synthesis of mesoporous Si/SiC with three-dimensional structure derived from C/silicalite-1 via magnesiothermic reduction, J. Porous Mater., 2018, 25, 713–717 CrossRef CAS.
- J. J. Ding, W. H. Yan, S. Sun, J. Bao and C. Gao, Hydrothermal synthesis of CaIn2S4-reduced graphene oxide, nanocomposites with increased photocatalytic performance, ACS Appl. Mater. Interfaces, 2014, 6, 12877–12884 CrossRef CAS PubMed.
- R. Shwetharani, A. Poojashree, R. B. Geetha and M. S. Jyothi, La activated high surface area titania float for the adsorption of Pb(ii) from aqueous media, New J. Chem., 2018, 42, 1067–1077 RSC.
- T. Jia, W. Wang, F. Long, Z. Fu, H. Wang and Q. Zhang, Fabrication, characterization and photocatalytic activity of La-doped ZnO nanowires, J. Alloys Compd., 2009, 484, 410–415 CrossRef CAS.
| This journal is © The Royal Society of Chemistry 2023 |

