 Open Access Article
Schiff bases as analytical tools: synthesis, chemo-sensor, and computational studies of 2-aminophenol Schiff bases†
Felicia Ndidi
Ejiah
 *,
Mujeeb Olarewaju
Rofiu
 ,
Oluwakemi Adekunbi
Oloba-Whenu
 and
Tolulope Mojisola
Fasina

Department of Chemistry, University of Lagos, Akoka, Lagos, Nigeria. E-mail: fejiah@unilag.edu.ng
First published on 2nd May 2023
Abstract
Schiff bases of 2-((2-hydroxybenzylidene)amino)phenol (MJ1) and 4-bromo-2-(((2-hydroxyphenyl)imino)methyl)phenol (MJ2) were synthesized from 2-aminophenol and screened for the detection of some biologically important metal ions. UV-vis spectroscopy screening, electrochemical studies, and theoretical calculations of the ligands (MJ1 and MJ2) revealed the sensing properties of the probes. The binding interactions of probes MJ1 and MJ2 with Cu2+, Zn2+, and Ni2+ resulted in redshifts in the absorption maxima. MJ1 exhibited reversibility of its metal complexes with Cu2+ and Zn2+ in an EDTA solution. The electrochemical behavior of both probes with Cu2+, Zn2+, Ni2+, Cr3+ resembled voltammograms with one or two quasi-reversible redox processes, indicating complex formation between the probes and metal ions. The electrochemical screening showed none or insignificant binding interactions between the probes with Cr3+. The change in electro-activeness of ligands MJ1 and MJ2 upon complexation with metal ions (Cu2+, Zn2+, and Ni2+) suggested a metal-to-ligand charge transfer (MLCT) and intramolecular charge transfer binding mechanism. The complex formed between the sensor and ligand was determined using density functional theory employing the B3LYP functional and the LANL2DZ and 6-311+G(d,p) basis sets. Atomic charge and molecular orbital analyses of the frontier molecular orbitals also support the MLCT mechanism. The global reactivity descriptor parameters show that MJ2 may be a better electron acceptor than MJ1.
Introduction
The development of chemo-sensors has attracted increasing interest in the scientific world in recent years due to interdisciplinary applications across chemistry, chemical engineering, biology, biochemistry, medicine, and environmental sciences.1–3 Chemo-sensors are molecules that can detect changes in one or more physicochemical properties.4,5 The simplicity, low detection limits, high selectivity and sensitivity, cost-effectiveness, real-time monitoring with short response time, and versatility in most chemo-sensor design and applications contribute to the special attention in this area of research.6–9 The vital role of metal ions in biological systems comes from the uncontrolled amount of these ions and their recommended amount in food, water, and biological fluids. Special need for simple and highly effective analytical methods for probing and monitoring biologically and environmentally essential transition metal ions is imminent.6 Previous methods demand well-trained personnel, high-cost and sophisticated analytical instruments, and time-consuming sample preparation processes.10–19Among the biologically and environmentally essential transition metals ions, zinc is the second-most abundant metal in the brain.20 A zinc ion is a divalent cation that helps in regulating intracellular signal transduction and gene expression through transcription factor activity.21 About 10% of the total Zn(II) in the brain is co-located and co-released from synaptic vesicles with glutamate, and therefore, it plays a vital role as a metal neurotransmitter by regulating the synaptic and neuronal activity.22 Zinc ions have been linked to neurological diseases such as Parkinson's disease and Alzheimer's disease. Extracellular Zn(II) concentrations have been displayed in epilepsy and can also lead to excitotoxicity.23
The use of mass spectrometry to detect Zn(II) in the brain prohibits the dynamic tracking of extracellular signaling.24 Further, on rapid timescales, fluorescence imaging in the detection of Zn2+ poses a difficulty in the quantitative determination of concentration levels.25 Recently, an electrochemical technique called fast-scan cyclic voltammetry at carbon-fiber microelectrodes (FSCV-CFM) has enabled the rapid detection of electroactive neurochemicals in tissue.26
An important metal with the foremost role in the nervous system is copper. It functions as a co-factor of many metalloenzymes by taking an active part, including superoxide dismutase, cytochrome c oxidase, and tyrosinase.27 Its occurrence along with its distinct use as a thermo-electric material makes it very crucial for use in different industries.28 Copper also functions in the regulation of metabolism, build-up of connective tissues by fixing calcium in bones, as well as having antifungal and antiyeast characteristics. It plays an important role in maintaining estrogen metabolism and the production of cellular energy.29 Due to the antimicrobial potency of most copper compounds, copper is used as an active ingredient in many drugs, particularly during copper deficiency.30 However, unregulated or disrupted copper-ion homeostasis is related to many neurogenerative diseases such as Menkes, Alzheimer's, Wilson's, amyotrophic lateral sclerosis, and Parkinson's diseases.31 Excessive loading of copper may also be potentially toxic with various body deregulations.32
Nickel is another essential trace element in biological systems and is involved in respiration, biosynthesis, and metabolism.33,34 Nickel actively functions in various enzymatic activities such as acetyl co-enzyme, catalytic processes, superoxide dismutase, carbon monoxide dehydrogenases, and acireductone dioxygenases.35,36 Loss or deficiency of nickel homoeostasis is harmful to prokaryotic and eukaryotic organisms.37 Excessive exposure of the body system to nickel can lead to asthma, respiratory system cancer, cardiovascular diseases, nasopharyngeal carcinoma, kidney diseases, and other serious central nervous system disorders.38 Considering the importance of these metal ions in the body, there arises a need for the rational design of efficient sensors to detect Zn2+, Cu2+, and Ni2+ at environmental and biological levels. Some physicochemical properties such as color, fluorescence, or redox potentials upon host–guest interactions have established the use of some molecules as a chemo-sensor.39
A variety of sensing mechanisms have been reported for chemo-sensors designed for Cu2+, Zn2+, and Ni2+.40–44 There have been reports of Schiff bases of 2-aminophenols as chemo-sensors due to their ability to coordinate to some metal ions in solutions,45–49 but none of them have been used in the evaluation of 2-aminophenol with salicylaldehyde MJ1 and 5-bromosalicylaldehyde MJ2 as a chemo-sensor in the detection of Cu2+ and Zn2+ in solution.
Based on this, our aim is to synthesize and characterize 2-aminophenol Schiff bases as chemo-sensors for Cu2+, Zn2+, and Ni2+ in aqueous solutions. We also report a density functional theory (DFT) study of the copper complexes obtained and the mechanism of interaction between the ligands and metal ions.
Results and discussion
Synthesis and characterization of Schiff-base chemo-sensors
The general synthesis scheme for MJ1 and MJ2 is provided in Scheme 1.FTIR, ESI-MS, and 1H NMR spectra of MJ1 and MJ2
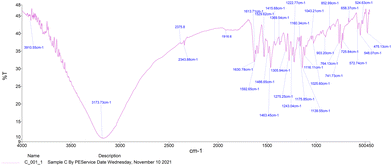
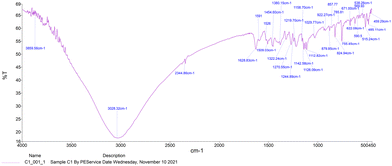
The IR spectra of Schiff bases MJ1 and MJ2 (summarized in Table 1) show bands in the regions expected for the ligands. Both compounds displayed bands at 1630–1629 cm−1, 3052–3431 cm−1, and 1275–1219 cm−1, characteristic of the imine C![[double bond, length as m-dash]](https://www.rsc.org/images/entities/char_e001.gif) N, –OH and C–O groups, respectively. The absence of a band at 1720–1740 cm−1 due to C
N, –OH and C–O groups, respectively. The absence of a band at 1720–1740 cm−1 due to C![[double bond, length as m-dash]](https://www.rsc.org/images/entities/char_e001.gif) O carbonyl indicates the formation of a Schiff base (Fig. 1 and 2).
O carbonyl indicates the formation of a Schiff base (Fig. 1 and 2).
| Compound | R1 | R2 | v(O–H) |
v(C![[double bond, length as m-dash]](https://www.rsc.org/images/entities/char_e001.gif) N) N) |
v(C–O) |
|---|---|---|---|---|---|
| MJ1 | H | H | 3173 | 1630 | 1275 1222 |
| MJ2 | H | Br | 3028 | 1628 | 1270 1219 |
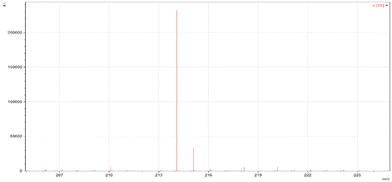
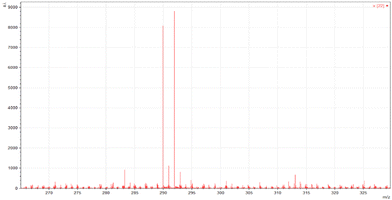
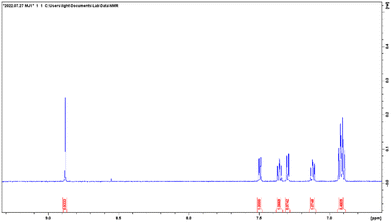
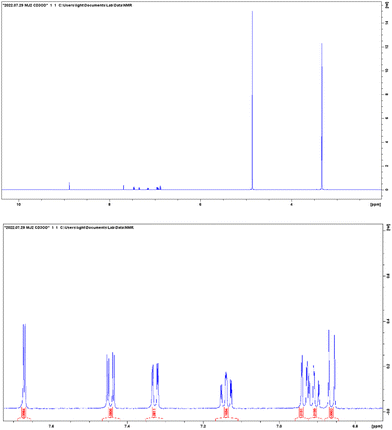
ESI-MS spectra confirmed the exact mass of ligands MJ1 C13H11NO2 [M + 1H]+1m/z = 214.08, found 214.09 and MJ2 C13H10BrNO2 [M − 1H]−1m/z = 289.99, found 289.98, whereas the 1H NMR spectra revealed resonated protons at the expected values, confirming the purity and structure of MJ1 and MJ2 ligands (Fig. 3–6).
Absorption spectroscopy
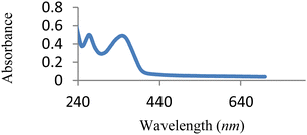
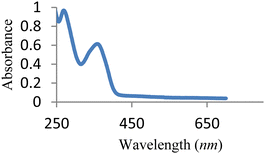
The UV-vis spectrum of free MJ1 and MJ2 are shown in Fig. 7 and 8. Both Schiff bases displayed a high-energy absorption band in the UV region, namely, 271–274 nm and 352–363 nm. The first band could be attributed to the π → π* transition of the aromatic ring, while the second band is assigned to the n → π* transition of the imine group of the Schiff base moiety.UV-vis titration studies
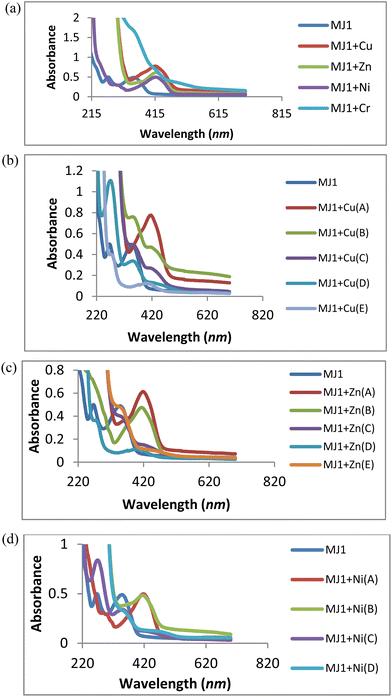
The absorption wavelength was observed at 352 nm for MJ1. Upon the addition of Cu2+, Zn2+, and Ni2+, redshifts were observed for MJ1 from 352 nm to 415 nm, 426 nm, and 435 nm, respectively. These redshifts depict the association of sensor MJ1 with Cu2+, Zn2+, and Ni2+, as shown in Fig. 9a. Further, the absorption wavelength at 271 nm for the receptor exhibited different responses upon the addition of metals. A redshift at 271 nm was observed upon the addition of Cu2+ and Zn2+ at low concentrations followed by the disappearance of the new redshift band on increase in the concentration of Cu2+ and Zn2+, as depicted in Fig. 9b and c. This suggests ligand-to-metal charge transfer (LMCT) from the imine group to the metal ion. Further, on the addition of Ni2+ (Fig. 9d), the band at 271 nm displayed a bathochromic shift (redshift) and an increase in intensity at 294 nm with an increase in concentration. This may imply the contribution of the imine group to the association of receptor MJ1 with Ni2+. This dissimilar observations of Cu2+, Zn2+, and Ni2+ with MJ1 at 271 nm may also be due to their Lewis acid nature and chelation effect. On the basis of this binding mode on addition of a metal ion, the bathochromic shift in the absorption spectra can be explained by intramolecular charge transfer (ICT). Here, Cu2+, being a paramagnetic metal, is highly unstable and more reactive probably due to its d9 system. Therefore, Zn2+ exhibits stronger Lewis acidic nature than Cu2+, which explains the increased tendency of Zn2+ to be involved in chelation with a ligand/probe than Cu2+. Similarly, Ni2+ exhibits a weaker Lewis acidic nature and is more unstable than Zn2+, and it chelates less readily compared with Zn2+ with sensor MJ1 through both imine and phenolic groups on the receptor.The association of a metallic ion to the oxygen atom of the phenolic group and nitrogen atom of the Schiff base moiety (C![[double bond, length as m-dash]](https://www.rsc.org/images/entities/char_e001.gif) N) increases its electron-withdrawing feature, leading to a stronger ICT from the electron-donating hydroxyl group to the metal complex. Furthermore, the absorption bands of receptor–metal for MJ1–Cu2+, MJ1–Zn2+, and MJ1–Ni2+ complexes shifted to a higher intensity in the spectra of the new complexes, indicating the involvement of the phenolic group in coordination with the central metal atom. In addition, the interaction of the donor site of chemo-sensor ligand MJ1 rapidly chelates to Cu2+, Zn2+, and Ni2+. Due to this rapid formation of chelation with ligand MJ1, the respective absorption bands at 415, 426, and 435 nm underwent a decrease in their intensity and total disappearance in MJ1–Cu2+ and MJ1–Zn2+ complexes as the concentrations are reduced. Chelate formation may be due to ICT and LMCT.50–53
N) increases its electron-withdrawing feature, leading to a stronger ICT from the electron-donating hydroxyl group to the metal complex. Furthermore, the absorption bands of receptor–metal for MJ1–Cu2+, MJ1–Zn2+, and MJ1–Ni2+ complexes shifted to a higher intensity in the spectra of the new complexes, indicating the involvement of the phenolic group in coordination with the central metal atom. In addition, the interaction of the donor site of chemo-sensor ligand MJ1 rapidly chelates to Cu2+, Zn2+, and Ni2+. Due to this rapid formation of chelation with ligand MJ1, the respective absorption bands at 415, 426, and 435 nm underwent a decrease in their intensity and total disappearance in MJ1–Cu2+ and MJ1–Zn2+ complexes as the concentrations are reduced. Chelate formation may be due to ICT and LMCT.50–53
Moreover, the spectra shown in Fig. 9a exhibits poor or no binding interaction on the addition of Cr3+ to sensor MJ1 as there appears to be no band shift or the appearance of a new band.
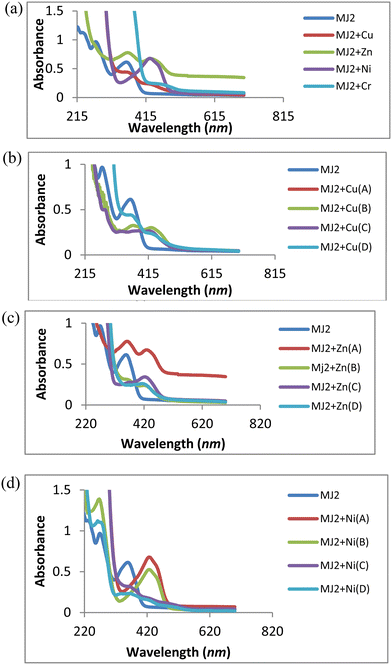
A similar trend of interaction was observed for MJ2 (Fig. 10a–d). The absorption band at 363 nm shifted to 434, 440, and 438 nm upon the addition of Cu2+, Zn2+, and Ni2+, respectively, confirming complex formation. These redshifts depict the association of sensor MJ2 with Cu2+, Zn2+, and Ni2+. Further, the absorption wavelength at 274 nm for the receptor exhibited different responses upon the addition of metals. On addition of Cu2+ and Zn2+, the band at 274 nm displayed a bathochromic shift with an increase in intensity of the new band as the concentration of metal ions increased (Fig. 10b and c). This may imply a contribution of the imine group to the association of receptor MJ2 with Cu2+ and Zn2+. Furthermore, the interaction of Ni2+ with MJ2 exhibited an immediate disappearance of the band at 274 nm and appearance of a new band at 431 nm with an increase in the absorption intensity upon an increase in concentration (Fig. 10d). This also suggests LMCT of the imine group in complexation. As discussed in the interaction of the metal ions with ligand MJ1, these similar observations of Cu2+, Zn2+, and Ni2+ with MJ2 at 274 nm may also be due to their Lewis acid nature and chelation effect.
Furthermore, the absorption bands of receptor–metal for MJ2–Cu2+, MJ2–Zn2+, and MJ2–Ni2+ complexes shifted to low intensity in the spectra of the new complexes, indicating the involvement of phenolic and imine groups in coordination with the central metal atom. As described in the chelation with ligand MJ1, the respective bathochromic shift in the absorption band at 363 nm ascribed to the n → π* transition in the imine group of the Schiff base moiety to 434, 440, and 438 nm in the formation of complexes results in the low intensity of the free-ligand band at 363 nm as the metallic-ion concentration increases, as revealed by the spectra. This response can also be attributed to ICT and LMCT.
Limit of detection of MJ1 and MJ2 probes
The response on addition of the varied concentrations of metal ions ranging from 2.5 mM to 9.77 μM (A–E) with a dilution factor of 4 to both sensors MJ1 and MJ2 suggested the possible limit of detection of the ligands. This indicates sensing at a concentration below the recommended Cu2+, Zn2+, and Ni2+ limits in drinking water and the environment. The World Health Organization (WHO) or Environmental Protection Agency (EPA) recommended the maximum acceptable concentration (MAC) of copper, zinc, and nickel in drinking water as 1.5, 3.0, and 0.1 mg L−1, respectively.54,55Reversibility studies of MJ1 and MJ2
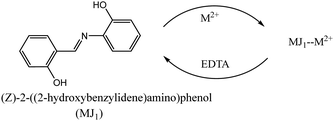
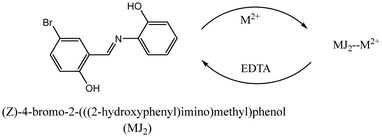
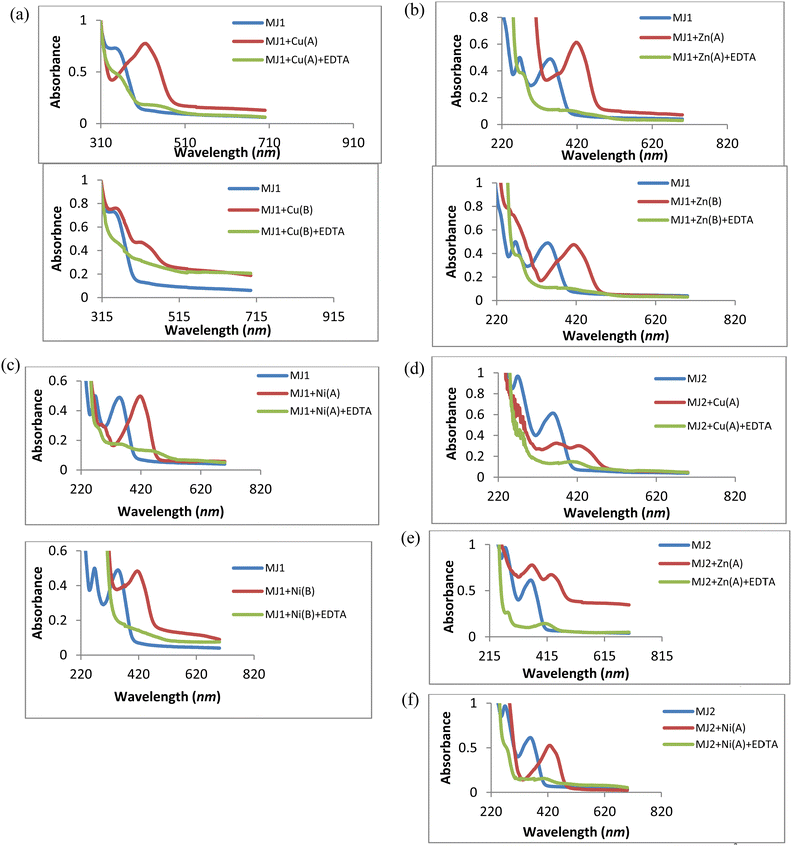
A reversibility study of the ligands is depicted in Schemes 2 and 3. The UV spectra (Fig. 11a–f) represent the reversibility of ligands MJ1 and MJ2 using 0.01 M EDTA solution. The spectra show the disappearance of bathochromic-shift bands after complex formation and the resurfacing of n → π* and π → π* transitions of the free ligands. The ligands with varied concentrations of metals were selected and spiked with 0.01 M EDTA solutions and all of them proved to be reversible.Electrochemical studies
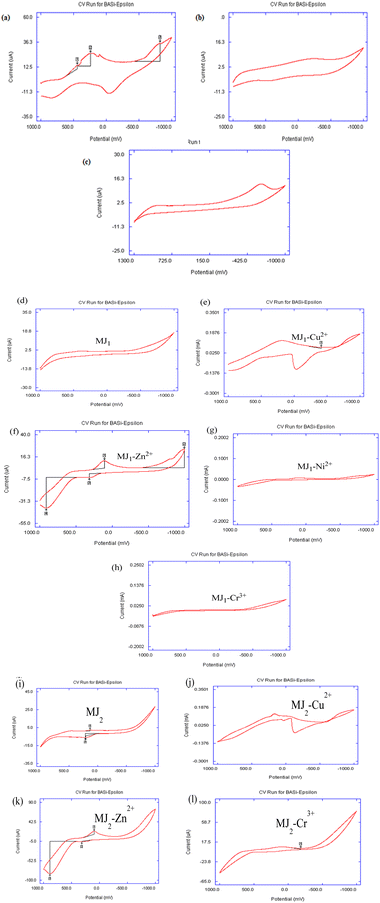
The voltammogram of MJ1 (Fig. 12d) showed that MJ1 is not electroactive as there appeared to be no redox process in both forward and backward scans. The cyclic voltammogram shown in Fig. 12e revealed two pairs of peaks as two distinct steps of reduction in the forward scan and oxidation in the reverse scan representing Cu2+/Cu+ and Cu+/Cu redox couples. The steps and potential values determined are as follows: step I corresponds to the Cu2+/Cu+ redox pair with cathodic and anodic peak potentials of Epc(I) = +200 mV and Epa(I) = +850 mV, respectively; the peak separation ΔEp(I) = 650 mV indicates a quasi-reversible behaviour;56,57 step II corresponds to the Cu+/Cu redox couple with cathodic and anodic peak potentials of Epc(II) = –900 mV and Epa(II) = –50 mV, respectively, with ΔEp(II) = 850 mV. The latter process is metallic copper deposition during a cathodic scan with a characteristic stripping response on the anodic scan for copper dissolution. The shift in oxidation and reduction peaks indicated the complexation interaction of Cu2+ to MJ1.
Fig. 12f also shows two pairs of peaks as two separate steps of reduction in the forward scan and oxidation in the reverse scan, representing Zn2+/Zn+ and Zn+/Zn redox couples. The steps and potential values displayed are as follows: step I corresponds to the Zn2+/Zn+ redox pair with cathodic and anodic peak potentials of Epc(I) = +100 mV and Epa(I) = +850 mV, respectively; the peak separation ΔEp(I) = 750 mV indicates a quasi-reversible behavior; step II corresponds to the Zn+/Zn redox couple with cathodic and anodic peak potentials of Epc(II) = –950 mV and Epa(II) = 250 mV, respectively, with ΔEp(II) = 1200 mV. The latter step results in zinc deposition during a slow forward cathodic scan with a characteristic half-resolved peak response on the cathodic scan and subsequent fast dissolution exhibited by the well-resolved anodic peak. The slow dissolution from Zn/Zn+ and Zn+/Zn2+ redox processes was highly indicative of the good binding ability of MJ1 to Zn2+. The shift in oxidation and reduction peaks is also indicative of the complexation of Zn2+ to MJ1.58,59
With regard to the interaction of Cr3+ with MJ1 (Fig. 12g), the voltammogram showed no significant photophysical changes. This revealed a poor binding relationship between Cr3+ and MJ1. The poorly resolved voltammogram shown in Fig. 12h also depicts a less noticeable binding interaction between Ni and MJ1. The colorimetric feature of MJ1 in its binding with Cu, Zn, and Ni is also a revealing fact for the good probing feature of MJ1 for metals, while the observable non-change in the color noticed in the interaction of MJ1 with Cr3+ is supportive of the observed results, that is, the absence of the electro-activeness of MJ1 on the addition of Cr3+.
In the voltammogram of MJ2–Zn2+, the forward scan exhibited a fast zinc-deposition reduction process involving Zn2+/Zn. Here, Fig. 12k shows a pair of well-resolved quasi-reversible process. This cathodic peak and its anodic peak are indicative of a Zn2+/Zn redox couple. The appearance of a slightly resolved irreversible anodic peak might indicate the slow formation of Zn+ during its dissolution after Zn deposition from the forward reduction scan. The steps and potential values displayed were as follows: step I corresponds to the Zn2+/Zn redox pair with cathodic and anodic peak potentials of Epc(I) = +100 mV and Epa(I) = +880 mV, respectively, and the peak separation ΔEp(I) = 780 mV indicates a quasi-reversible behaviour;56,57 step II corresponds to the Zn/Zn+ oxidation with anodic peak potentials of Epa(II) = +325 mV. The shift in oxidation and reduction peaks is also indicative of the complexation of Zn2+ to MJ2.
There appears to be a similarity in the binding characteristics between MJ1–Cr3+ and MJ1–Ni2+, which was also observed for MJ2–Cr3+ and MJ2–Ni2+. The voltammogram of MJ2–Cr3+ (Fig. 12l) exhibited a reversible one-redox process, as also shown by MJ2 except for the change in peak current and resolution of peaks. This might indicate little or no binding interaction between Cr3+ and MJ2.
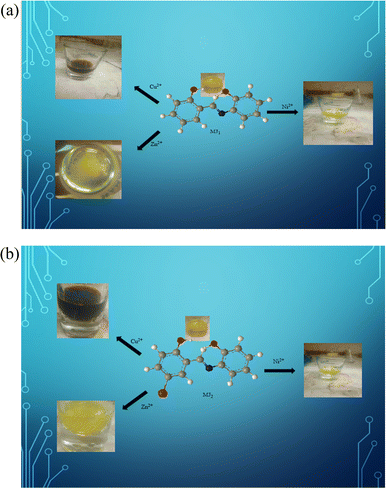 | ||
| Fig. 13 (a) Colorimetric response of MJ1 upon the addition of Cu2+, Zn2+, and Ni2+. (b) Colorimetric response of MJ2 upon the addition of Cu2+, Zn2+, and Ni2+. | ||
Furthermore, the optical sensing of MJ2 solutions on the addition of Cu2+, Zn2+, and Ni2+ salts also showed significant color changes. The solution mixtures gradually changed from orange to reddish brown, deep yellow, and yellow, respectively (Fig. 13b). This change was detected by the naked eye. The color intensity also gradually decreased with a lower concentration of metal ions.
Computational studies
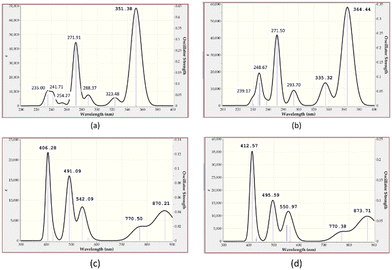 | ||
| Fig. 15 Computed UV-vis absorption spectrum of (a) MJ1, (b) MJ2, (c) MJ1–Cu2+, and (d) MJ2–Cu2+ complexes. | ||
| Transitions | MJ1 | MJ2 | MJ1–Cu2+ | MJ2–Cu2+ | ||
|---|---|---|---|---|---|---|
| Computed (nm) | Expt. (nm) | Computed (nm) | Expt. (nm) | |||
| π → π* | 271.91 | 271 | 271.50 | 274 | ||
| n → π* | 351.36 | 352 | 364.44 | 363 | ||
| 406.28 | 412.57 | |||||
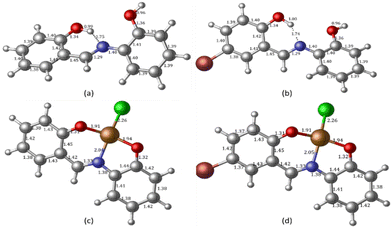
The two predominant peaks of 271.91 and 351.38 nm for MJ1 and 271.50 and 364.44 nm for MJ2 that can be attributed to the π → π* and n → π* transitions, respectively, in the experimental absorption spectra are at about 271, 352, 274, and 363 nm in both MJ1 and MJ2 and a corresponding result is obtained from the computational studies. The calculated UV-vis spectra of the metal complexes are also reported in the range of 400–900 nm and compared with the experimental values. The peaks at about 406.28 nm for the MJ1–Cu2+ complex and 412.57 nm for MJ2–Cu2+ complex are close to the experimental values of around 415–434 nm for both complexes (Fig. 9a and 10a; vide supra). The line obtained at around 870 nm is also closely related to a copper complex of a similar ligand reported in the literature,60 which further confirms the square planar structure predicted for the complex.
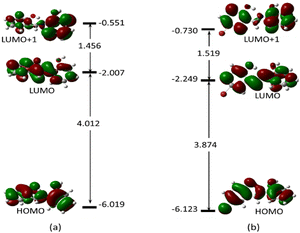 | ||
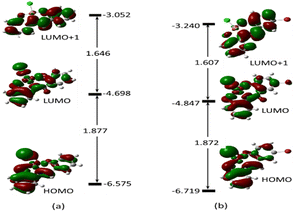
| Fig. 16 Electron density map of the frontier orbitals of (a) MJ1 and (b) MJ2 showing their energy eigenvalues in eV and the energy gap between them. | ||
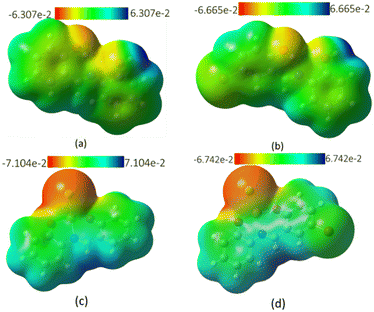
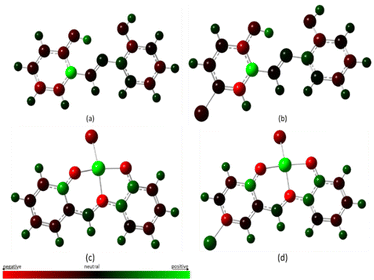
The energy difference between the HOMO and LUMO, ELUMO–EHOMO and between the LUMO and LUMO+1 is 4.012 and 1.456 eV (MJ1) and 3.874 and 1.519 eV (MJ2), respectively. These energy gaps have been significantly quenched by complex formation with Cu2+ where the HOMO–LUMO energy gaps of MJ1–Cu2+ and MJ2–Cu2+ complexes have been reduced to 1.877 and 1.872 eV, respectively. The decrease in the energy gap clearly confirms the strong ligand–metal interaction between sensors MJ1 and MJ2 and the Cu2+ cation. It is also noted that the electron density is evenly distributed over the whole molecule for both free Schiff bases at both HOMO and LUMO and localized on the aminophenol moiety at LUMO+1 for MJ1. Upon complexation, the electronic distribution is mostly localized on the metal and hydroxyl benzylidene moiety of the ligand at both HOMO and LUMO, with a reduced orbital coefficient on the aminophenol moiety. However, LUMO+1 has a negligible orbital coefficient on the Cu atom in both complexes and is mostly a ligand orbital and can be referred to as non-bonding. From TDDFT analysis, the prominent bands at 406.28 eV (MJ1–CuCl) and 412.51 eV (MJ2–CuCl) is majorly a transition from HOMO to LUMO+1, which represents a metal-to-ligand charge transfer. Other transitions are intramolecular charge transfer within the ligand as well as metal-to-ligand charge transfer (Fig. S2–S6 and S8–S12, ESI†). Therefore, the sensing mechanism of MJ1 and MJ2 to Cu2+ might be explained by metal-to-ligand charge transfer and LMCT mechanisms between the orbitals of the ligands and metal. The push–pull effect of the electron-donating and electron-withdrawing groups leading to a redshift, that is, binding metal ions to the electron-withdrawing moieties, indicates a decrease in the energy gap.66
The energy values of HOMO and LUMO were also used to describe the global reactivity descriptors of the sensors (MJ1 and MJ2) as defined within the DFT framework by Parr and additional works from Gázquez et al.66 and Chattaraj et al.67 These are global hardness (η), global softness (S), chemical potential (μ), electronegativity (X), electrophilicity index (ω) (electron-donating power (ω−), electron-accepting power (ω+) and net electrophilicity (Δω±)), and ionization potential (I) and are given along with their dipole moment (μD) (Table 3). With these, we can discuss the effect of bromine atom on the salicylaldehyde moiety. A wider HOMO–LUMO gap often indicates a more stable molecule. It is noted that the Br atom on the salicylaldehyde moiety in MJ2 narrows the HOMO–LUMO gap by lowering ELUMO more than EHOMO, and maybe less stable compared to MJ1 and may be more reactive.
| Ligand | MJ1 | MJ2 |
|---|---|---|
| E LUMO (eV) | −2.007 | −2.249 |
| E HOMO (eV) | −6.019 | −6.123 |
| ΔEgap (eV) | 4.012 | 3.874 |
| I (eV) | 6.019 | 6.123 |
| A (ev) | 2.007 | 2.249 |
| η (eV) | 2.006 | 1.937 |
| S (eV) | 0.499 | 0.516 |
| μ (eV) | −4.013 | −4.186 |
| χ (eV) | 4.013 | 4.186 |
| ω − (eV) | 8.026 | 8.385 |
| ω + (eV) | 4.517 | 5.345 |
| Δω+(eV) | 12.5431 | 13.729 |
| μ D (D) | 2.59 | 3.66 |
| I (eV) | 6.019 | 6.123 |
It is also noted that MJ1 is chemically softer than MJ2. A larger value of ω+ corresponds to a larger capability of accepting charges, whereas a smaller value of ω− implies a larger capability of donating charges. We note that MJ2 has more electron-accepting abilities and net electrophilicity than MJ1 from their net electrophilicity values, i.e., the electron-accepting power relative to the electron-donating power as defined in eqn (1).67
| Δω± = ω+ + ω− | (1) |
| MJ1 | MJ1–Cu2+ | MJ2 | MJ2–Cu2+ | ||
|---|---|---|---|---|---|
| a X1 is H in the ligand and Cu in the complex. b X2 is H in the ligand and Cl in the complex. c R is H in MJ1 and Br in MJ2. | |||||
| 1 | C | −0.5415 | −0.1292 | −0.8913 | −0.0682 |
| 2 | C | −0.5824 | −0.1692 | −0.0989 | −0.4338 |
| 3 | C | −0.2180 | −0.0902 | −0.1263 | −0.0362 |
| 4 | C | 1.1278 | −0.0837 | 1.1420 | −0.0759 |
| 5 | C | −0.3727 | 0.3925 | −0.6189 | 0.4024 |
| 6 | C | −0.1915 | −0.1729 | −0.0928 | −0.1643 |
| 7 | C | −0.1381 | 0.1028 | −0.0408 | 0.1025 |
| 8 | N | 0.0685 | −0.6758 | 0.0737 | −0.6727 |
| 9 | C | 0.2008 | 0.2344 | 0.2352 | 0.2341 |
| 10 | C | 0.0589 | −0.0355 | 0.0461 | −0.0347 |
| 11 | C | −0.2888 | −0.1710 | −0.2686 | −0.1697 |
| 12 | C | −0.3778 | 0.2519 | −0.3915 | 0.2525 |
| 13 | C | −0.3180 | −0.1103 | −0.3243 | −0.1093 |
| 14 | C | −0.0538 | −0.1415 | −0.0568 | −0.1401 |
| 15 | H | 0.1188 | 0.2009 | 0.1113 | 0.2028 |
| 16 | H | 0.1516 | 0.1668 | 0.2249 | 0.1877 |
| 17 | H | 0.1687 | 0.1701 | 0.2225 | 0.1906 |
| 18 | H | 0.1796 | 0.1985 | 0.1884 | 0.2040 |
| 19 | H | 0.1494 | 0.1801 | 0.1489 | 0.1819 |
| 20 | H | 0.1369 | 0.1956 | 0.1390 | 0.1974 |
| 21 | H | 0.1730 | 0.1663 | 0.1757 | 0.1684 |
| 22 | H | 0.1569 | 0.1711 | 0.1591 | 0.1730 |
| 23 | O | −0.2953 | −0.5454 | −0.2932 | −0.5422 |
| 24 | O | −0.2083 | −0.5099 | −0.2080 | −0.5081 |
| 25 | X1a | 0.4755 | 0.4791 | 0.4750 | 0.6442 |
| 26 | X2b | 0.2614 | −0.4070 | 0.2630 | −0.4020 |
| 27 | Rc | 0.1584 | 0.1655 | −0.1975 | 0.2157 |
Conclusions
We have successfully developed 2-aminophenol-based Schiff base chemo-sensors MJ1 and MJ2 for the detection of Cu2+ and Zn2+. MJ1 and MJ2 could be employed as a low cost and ultrasensitive colorimetric sensor to detect and determine Cu2+ and Zn2+ in the range from 9.75 × 10⁻⁶ to 2.5 × 10⁻³ mol dm−3, which is considered to be a low detection limit; this is lower than the WHO-recommended amount in drinking water. The observed photochemical and electrochemical results showed that the chemo-sensors MJ1 and MJ2 have good binding interaction with Cu2+ and Zn2+ and suggests an ICT (LMCT) binding association. DFT calculations were used to determine the geometry of the complex formed with copper (based on the UV-vis screening of the complex formed), which is a square planar complex. TDDFT analysis and charge analysis showed LMCT and back-donation to ligand. The bromine atom on MJ2 lowers both HOMO and LUMO energy levels, making it more electron accepting to the metal complex.Experimental
Reagents
The chemicals and reagents used were purchased from Sigma-Aldrich Chemical Co. Ltd and used without further purification. They include ethanol, 2-aminophenol, salicylaldehyde, 5-bromosalicylaldehyde, copper(II) chloride dehydrate (CuCl2·2H2O), zinc nitrate hexahydrate (Zn(NO3)2·6H2O), nickel chloride hexahydrate (NiCl2·6H2O), chromium chloride hexahydrate (CrCl3·6H2O), iron(III) chloride hexahydrate (FeCl3·6H2O), TEAP, acetonitrile, and acetone.Apparatus
The melting points of all the synthesized compounds were determined using the Stuart melting point apparatus model in the Chemistry Department of the University of Lagos, Nigeria. Infrared (FTIR) spectra of the compounds were recorded on the spectrum in the range of 4000 to 400 cm−1 using a Bruker FTIR model alpha spectrophotometer at the Chemistry Department of the University of Ibadan, Nigeria. The electronic absorption data were recorded on a Shimadzu PGT80/T80+ UV-vis spectrophotometer using 1 × 10⁻⁵ M acetonitrile solution in a 1 cm quartz cell at room temperature. The synthesis reactions were monitored by a TLC instrument. The 1H NMR spectra were collected in deuterated methanol and referenced to the residual protonated solvent peak of 3.31 ppm using a Bruker 600 MHz Avance III HD spectrometer, and electrospray ionization (ESI) mass spectrometry was completed in the positive or negative mode as indicated with methanol as the eluent using a Bruker Impact LC-MS at the Department of Chemistry and Biochemistry, Ohio State University, Columbus, USA. The electrochemical studies were performed using a platinum electrode as the auxiliary electrode, glassy carbon electrode (GCE) as the working electrode, and Ag/AgCl electrode as the reference electrode using Epsilon Ec. Vet. 213.77 Xp voltammetry machine at the Chemistry Department of the University of Lagos. Electrochemical parameters: Epsilon Ec. Vet. 213.77 Xp, Scan rate (mV s−1): 100 mV; number of segments: 2; quiet time (s): 2; scale: 100 mA and 1 mA; reference electrode (Ag/AgCl electrode), working electrode (GCE), counter electrode (platinum electrode), supporting electrolyte (TEAP); solvent, acetonitrile.Synthesis
![[thin space (1/6-em)]](https://www.rsc.org/images/entities/char_2009.gif) :
:![[thin space (1/6-em)]](https://www.rsc.org/images/entities/char_2009.gif) 1) n-hexane and ethyl acetate solvent system. The mixture was cooled to room temperature and the red product obtained was collected by filtration and recrystallized using ethanol. This afforded a red crystalline compound MJ1. Yield: 63.18%; melting point: 188–190 °C; IR (cm−1): 3173, 2343, 1630, 1613, 1592, 1529, 1463, 1222, 1139, 725; 1H NMR (600 MHz, CD3OD): d 8.88 (s, 1H, −
1) n-hexane and ethyl acetate solvent system. The mixture was cooled to room temperature and the red product obtained was collected by filtration and recrystallized using ethanol. This afforded a red crystalline compound MJ1. Yield: 63.18%; melting point: 188–190 °C; IR (cm−1): 3173, 2343, 1630, 1613, 1592, 1529, 1463, 1222, 1139, 725; 1H NMR (600 MHz, CD3OD): d 8.88 (s, 1H, −![[H with combining low line]](https://www.rsc.org/images/entities/char_0048_0332.gif) C = N), 7.50 (dd, 1H, J = 7.7, 1.6, −Ar
C = N), 7.50 (dd, 1H, J = 7.7, 1.6, −Ar![[H with combining low line]](https://www.rsc.org/images/entities/char_0048_0332.gif) ), 7.36 (td, 1H, J = 7.9, 1.8, −Ar
), 7.36 (td, 1H, J = 7.9, 1.8, −Ar![[H with combining low line]](https://www.rsc.org/images/entities/char_0048_0332.gif) ), 7.30 (dd, 1H, J = 7.9, 1.5, −Ar
), 7.30 (dd, 1H, J = 7.9, 1.5, −Ar![[H with combining low line]](https://www.rsc.org/images/entities/char_0048_0332.gif) ), 7.12 (td, 1H, J = 7.6, 1.6, −Ar
), 7.12 (td, 1H, J = 7.6, 1.6, −Ar![[H with combining low line]](https://www.rsc.org/images/entities/char_0048_0332.gif) ), 6.92 (q, 1H, J = 8.6, −Ar
), 6.92 (q, 1H, J = 8.6, −Ar![[H with combining low line]](https://www.rsc.org/images/entities/char_0048_0332.gif) ); ESI-MS calculated for C13H11NO2 [M + 1H]+1m/z = 214.08, found 214.09.
); ESI-MS calculated for C13H11NO2 [M + 1H]+1m/z = 214.08, found 214.09.
![[thin space (1/6-em)]](https://www.rsc.org/images/entities/char_2009.gif) :
:![[thin space (1/6-em)]](https://www.rsc.org/images/entities/char_2009.gif) 1) n-hexane and ethyl acetate solvent system. The mixture was cooled to room temperature and the yellow product obtained was collected by filtration and recrystallized using ethanol. This afforded a yellow crystalline compound MJ2. Yield: 67.10%; melting point: 190–192 °C; IR (cm−1): 3028, 2344, 1628, 1591, 1526, 1509, 1128, 755; 1H NMR (600 MHz, CD3OD): d 8.87 (s, 1H, −
1) n-hexane and ethyl acetate solvent system. The mixture was cooled to room temperature and the yellow product obtained was collected by filtration and recrystallized using ethanol. This afforded a yellow crystalline compound MJ2. Yield: 67.10%; melting point: 190–192 °C; IR (cm−1): 3028, 2344, 1628, 1591, 1526, 1509, 1128, 755; 1H NMR (600 MHz, CD3OD): d 8.87 (s, 1H, −![[H with combining low line]](https://www.rsc.org/images/entities/char_0048_0332.gif) C = N), 7.67 (d, 1H, J = 2.5, −Ar
C = N), 7.67 (d, 1H, J = 2.5, −Ar![[H with combining low line]](https://www.rsc.org/images/entities/char_0048_0332.gif) ), 7.44 (dd, 1H, J = 8.9, 2.6, −Ar
), 7.44 (dd, 1H, J = 8.9, 2.6, −Ar![[H with combining low line]](https://www.rsc.org/images/entities/char_0048_0332.gif) ), 7.33 (dd, 1H, J = 8.0, 1.6, −Ar
), 7.33 (dd, 1H, J = 8.0, 1.6, −Ar![[H with combining low line]](https://www.rsc.org/images/entities/char_0048_0332.gif) ), 7.14 (td, 1H, J = 7.8, 1.5, −Ar
), 7.14 (td, 1H, J = 7.8, 1.5, −Ar![[H with combining low line]](https://www.rsc.org/images/entities/char_0048_0332.gif) ), 6.94 (dd, 1H, J = 8.2, 1.2, −Ar
), 6.94 (dd, 1H, J = 8.2, 1.2, −Ar![[H with combining low line]](https://www.rsc.org/images/entities/char_0048_0332.gif) ), 6.91 (td, 1H, J = 7.5, 1.3, −Ar
), 6.91 (td, 1H, J = 7.5, 1.3, −Ar![[H with combining low line]](https://www.rsc.org/images/entities/char_0048_0332.gif) ), 6.86 (d, 1H, J = 8.9, −Ar
), 6.86 (d, 1H, J = 8.9, −Ar![[H with combining low line]](https://www.rsc.org/images/entities/char_0048_0332.gif) ); ESI-MS calculated for C13H10BrNO2 [M – 1H]−1m/z 289.99, found 289.98.
); ESI-MS calculated for C13H10BrNO2 [M – 1H]−1m/z 289.99, found 289.98.
UV-vis absorption spectroscopy study
The same procedure was repeated for each of zinc nitrate hexahydrate (Zn(NO3)2·6H2O), nickel chloride hexahydrate (NiCl2·6H2O), chromium chloride hexahydrate (CrCl3·6H2O), and iron(III) chloride hexahydrate (FeCl3·6H2O) salts.
Reversibility test of MJ1–Cu2+ and MJ1–Zn2+ to MJ1 using EDTA receptor
MJ1 (1.06 mg, 0.005 mmol) was dissolved in acetonitrile (2 mL) and 15 μL (2.5 μM) of it was diluted with 2.985 mL acetonitrile buffer solution (1![[thin space (1/6-em)]](https://www.rsc.org/images/entities/char_2009.gif) :
:![[thin space (1/6-em)]](https://www.rsc.org/images/entities/char_2009.gif) 5, v/v, 10 mM, bis–tris, pH 7.0) to make a final concentration of 12.5 μM. CuCl2.2H2O (1.70 mg, 0.01 mmol) was dissolved in acetonitrile (2 mL) and 3.2 mL of the Cu2+ solution (5 mM) was added to the solution of MJ1 (12.5 μM) prepared above. The solutions were mixed for 30 s, and the UV-vis spectrum was taken at room temperature. Ethylenediaminetetraacetic acid (EDTA, 0.04 mmol) was dissolved in a buffer solution (2 mL) and 0.2 mL of the EDTA solution (20 mM) was added to the solution of MJ1–Cu2+ complex. After mixing for 1 min, the UV-vis spectrum was taken. The addition of 0.2 mL EDTA solution (20 mM) was done in duplicate.
5, v/v, 10 mM, bis–tris, pH 7.0) to make a final concentration of 12.5 μM. CuCl2.2H2O (1.70 mg, 0.01 mmol) was dissolved in acetonitrile (2 mL) and 3.2 mL of the Cu2+ solution (5 mM) was added to the solution of MJ1 (12.5 μM) prepared above. The solutions were mixed for 30 s, and the UV-vis spectrum was taken at room temperature. Ethylenediaminetetraacetic acid (EDTA, 0.04 mmol) was dissolved in a buffer solution (2 mL) and 0.2 mL of the EDTA solution (20 mM) was added to the solution of MJ1–Cu2+ complex. After mixing for 1 min, the UV-vis spectrum was taken. The addition of 0.2 mL EDTA solution (20 mM) was done in duplicate.
Electrochemical studies
Optical sensing test
The optical sensing test of the solutions of receptors MJ1 and MJ2 (0.01 mmol) in 2 mL MeCN after the addition of Cu2+, Zn2+, and Ni2+ salts (0.02 mmol) showed significant colour changes.Theoretical studies of MJ1, MJ2, and their complexes
Global reactivity descriptors like chemical hardness (η), electronic chemical potential (μ), electronegativity (χ), global softness (S), and electrophilicity index (ω) were derived from the energy of HOMO and LUMO, namely, EHOMO and ELUMO, respectively. Within the framework of finite-differences approximation, the global reactivity descriptors were calculated as follows.75–78
| I = −EHOMO | (2) |
| A = −ELUMO | (3) |
 | (4) |
 | (5) |
 | (6) |
 | (7) |
| S = 1/2η | (8) |
 | (9) |
| Δω± = ω+ + ω− | (10) |
Author contributions
Felicia N. Ejiah, Mujeeb O. Rofiu and Tolulope M. Fasina designed the experiments and carried out the analysis. Oluwakemi A. Oloba-Whenu and Mujeeb O. Rofiu carried out the computational studies and analysis. Felicia N. Ejiah, Mujeeb O. Rofiu, Oluwakemi A. Oloba-Whenu and Tolulope M. Fasina interpreted the results and wrote the manuscript. All authors have read and approved the final manuscript.Conflicts of interest
There are no conflicts of interest to declare.Acknowledgements
Thanks are due to Prof. Claudia Turro and Jessie Vandevord of the Department of Chemistry and Biochemistry, Ohio State University who assisted in analysis of the ligands using ESI-MS and NMR.References
- R. Pandey, A. Kumar, Q. Xu and D. S. Pandey, Dalton Trans., 2020, 49, 542 RSC.
- F. Wang, L. Wang, X. Chen and J. Yoon, Chem. Soc. Rev., 2014, 43, 4312 RSC.
- K. Kaur, R. Saini, A. Kumar, V. Luxami, N. Kaur, P. Singh and S. Kumar, Coord. Chem. Rev., 2012, 256, 1992 CrossRef CAS.
- L. H. Abdel-Rahman, A. M. Abu-Dief and A. A. H. Abdel-Mawgoud, Ann. Chem. Sci. Res., 2019, 1, 1 Search PubMed.
- L. H. Abdel-Rahman, A. M. Abu-Dief and A. A. H. Abdel-Mawgoud, Int. J. Nano. Chem., 2019, 5, 1 Search PubMed.
- J. M. V. Ngororabanga, C. Moyo, E. Hosten, N. Mama and Z. R. Tshentu, Anal. Methods, 2019, 11, 3857 RSC.
- X. Chen, X. Tian, I. Shin and J. Yoon, Chem. Soc. Rev., 2011, 40, 4783 RSC.
- E. Persch, O. Dumele and F. Diederich, Angew. Chem., Int. Ed., 2015, 54, 3290 CrossRef CAS PubMed.
- H. Xiang, J. Cheng, X. Ma, X. Zhou and J. J. Chruma, Chem. Soc. Rev., 2013, 42, 6128 RSC.
- Y. V. Tcherkas and A. D. Denisenko, J. Chromatogr. A, 2001, 913, 309 CrossRef CAS PubMed.
- J. S. Becker, A. Matusch, C. Depboylu, J. Dobrowolska and M. V. Zoriy, Anal. Chem., 2007, 79, 6074 CrossRef CAS PubMed.
- M. M. Sanagi, A. A. Naim, W. A. Wan Ibrahim and U. Baig, Anal. Methods, 2015, 7, 3215 RSC.
- M. Faraji, Y. Yamini and S. Shariati, J. Hazard. Mater., 2009, 166, 1383 CrossRef CAS PubMed.
- Y. Liu, P. Liang and L. Guo, Talanta, 2005, 68, 25 CrossRef CAS PubMed.
- O. Nekrassova, N. S. Lawrence and R. G. Compton, Talanta, 2003, 60, 1085 CrossRef CAS PubMed.
- N. Pourreza and R. Hoveizavi, Anal. Chim. Acta, 2005, 549, 124 CrossRef CAS.
- L. M. Laglera and D. Monticelli, Curr. Opin. Electrochem., 2017, 3, 123 CrossRef CAS.
- A. A. Ensafi, T. Khayamian, A. Benvidi and E. Mirmomtaz, Anal. Chim. Acta, 2006, 561, 225 CrossRef CAS.
- S. Omarova, S. Demir and M. Andac, J. Taibah Univ. Med. Sci., 2018, 12, 820 CrossRef.
- S. D. Gower-Winter and C. W. Levenson, BioFactors, 2012, 38, 186 CrossRef CAS PubMed.
- C. J. Frederickson, J. Y. Koh and A. I. Bush, Nat. Rev. Neurosci., 2005, 6, 449 CrossRef CAS PubMed.
- S. Gol, R. N. Pena, M. F. Rothschild, M. Tor and J. Estany, Sci. Rep., 2018, 8, 1 CAS.
- P. Paoletti, A. M. Vergnano, B. Barbour and M. Casado, Neuroscience, 2009, 158, 126 CrossRef CAS PubMed.
- S. D. Portbury and P. A. Adlard, Int. J. Mol. Sci., 2017, 18, 2506 CrossRef PubMed.
- J. M. Goldberg, F. Wang, C. D. Sessler, N. W. Vogler, D. Y. Zhang, W. H. Loucks and S. J. Lippard, J. Am. Chem. Soc., 2018, 140, 2020 CrossRef CAS PubMed.
- E. Castagnola, E. M. Robbins, K. M. Woeppel, M. McGuier, A. Golabchi, I. M. Taylor and X. T. Cui, Front. Bioeng. Biotechnol., 2020, 8, 602216 CrossRef PubMed.
- Y. S. Kim, G. J. Park, S. A. Lee and C. Kim, RSC Adv., 2015, 5, 31179 RSC.
- S. K. Shinde, D. P. Dubal, G. S. Ghodake, D. Y. Kim and V. J. Fulari, Nano-Struct. Nano-Objects, 2016, 6, 5 CrossRef CAS.
- Federal Register, Rules and Regulations, 2000, 65, http://www.govinfo.gov/content/pkg/FR-2000-01-12/pdf/00-3.pdf#page=50.
- B. R. Stern, J. Toxicol. Environ. Health, Part A, 2010, 73, 114 CrossRef CAS PubMed.
- H. S. Jung, P. S. Kwon, J. W. Lee, J. I. Kim, C. S. Hong, J. W. Kim and J. S. Kim, J. Am. Chem. Soc., 2009, 131, 2008 CrossRef CAS PubMed.
- K. J. Barnham, C. L. Masters and A. I. Bush, Nat. Rev. Drug Discovery, 2004, 3, 205 CrossRef CAS PubMed.
- G. Zhou, Y. Cheng, L. Wang, X. Jing and F. Wang, Macromolecules, 2005, 38, 2148 CrossRef CAS.
- Y. Zhang, C. B. Murphy and W. E. Jones, Macromolecules, 2002, 35, 630 CrossRef CAS.
- B. Zambelli, F. Musiani, S. Benini and S. Ciurli, Acc. Chem. Res., 2011, 44, 520 CrossRef CAS PubMed.
- S. W. Ragsdale, J. Biol. Chem., 2009, 284, 18571 CrossRef CAS PubMed.
- A. Sigel, H. Sigel and R. K. Sigel, Nickel and Its Surprising Impact in Nature, John Wiley & Sons, 2007, p. 728 Search PubMed.
- S. C. Dodani, Q. He and C. J. Chang, J. Am. Chem. Soc., 2009, 131, 18020 CrossRef CAS PubMed.
- Z. Kowser, U. Rayhan, T. Akther, C. Redshaw and T. Yamato, Mater. Chem. Front., 2021, 5, 2173 RSC.
- B. Daly, J. Ling and A. P. De Silva, Chem. Soc. Rev., 2015, 44, 4203 RSC.
- C. Kar, M. D. Adhikari, A. Ramesh and G. Das, Inorg. Chem., 2013, 52, 743 CrossRef CAS PubMed.
- N. P. Junager, J. Kongsted and K. Astakhova, Sensors, 2016, 16, 1173 CrossRef PubMed.
- R. Pandey, A. Kumar, Q. Xu and D. S. Pandey, Dalton Trans., 2020, 49, 542 RSC.
- F. V. Englich, T. C. Foo, A. C. Richardson, H. Ebendorff-Heidepriem, C. J. Sumby and T. M. Monro, Sensors, 2011, 11, 9560 CrossRef CAS PubMed.
- P. Torawane, K. Tayade, S. Bothra, S. K. Sahoo, N. Singh, A. Borse and A. Kuwar, Sens. Actuators, B, 2016, 222, 562 CrossRef CAS.
- T. M. Asha, E. Shiju, C. Keloth and M. R. P. Kurup, Appl. Organomet. Chem., 2020, 34, e5520 CAS.
- K. Poongodi, P. Saravana Kumar, R. Shanmugapriya, C. Nandhini and K. P. Elango, Spectrochim. Acta, Part A, 2021, 249, 119288 CrossRef CAS PubMed.
- D. Y. Patil, N. B. Khadke, A. A. Patil and A. V. Borhade, Results Chem., 2022, 4, 100658 CrossRef CAS.
- S. Santhi and K. Abinaya, Indian Pat. Appl., 2022, 29 Search PubMed.
- E. T. Aljohani, M. R. Shehata, F. Alkhatib, S. O. Alzahrani and A. M. Abu-Dief, Appl. Organomet. Chem., 2021, 35, e6154 CAS.
- E. T. Aljohani, M. R. Shehata and A. M. Abu-Dief, Appl. Organomet. Chem., 2021, 35, e6169 CAS.
- H. M. A. El-Lateef, T. El-Dabea, M. M. Khalaf and A. M. Abu-Dief, Int. J. Mol. Sci., 2022, 23, 6418 CrossRef CAS PubMed.
- F. S. Aljohani, O. A. Omran, E. A. Ahmed, E. S. Al-Farraj, E. F. Elkady, A. Alharbi, N. M. El-Metwaly, I. O. Barnawi and A. M. Abu-Dief, Inorg. Chem. Commun., 2023, 148, 110331 CrossRef CAS.
- Z. Shamsollahi and A. Partovinia, J. Environ. Manage., 2019, 246, 314 CrossRef CAS PubMed.
- S. J. Cobbina, A. B. Duwiejuah, R. Quansah, S. Obiri and N. Bakobie, Int. J. Environ. Res. Public Health, 2015, 12, 10620 CrossRef CAS PubMed.
- K. Shakeela, A. S. Dithya, C. J. Rao and G. R. Rao, J. Chem. Sci., 2015, 127, 133 CrossRef CAS.
- M. Kuate, M. A. Conde, E. Ngandung Mainsah, A. G. Paboudam, F. M. M. Tchieno, K. I. Ketchemen and P. T. Ndifon, J. Chem., 2020, 2020, 5238501 Search PubMed.
- V. S. Vasantha and V. S. Muralidharan, Proc. Natl. Acad. Sci. U. S. A., 1994, 106, 825 CAS.
- R. Sekar, S. Jayakrishnan and V. S. Muralidharan, Trans. Inst. Met. Finish., 2005, 83, 300 CrossRef CAS.
- E. T. Shamkhy, J. Al-NahrainUniv. Sci., 2015, 18, 39 Search PubMed.
- A. P. Gulya, V. I. Tsapkov, D. Poirier, K. Aruksandei and E. Pakhontsu, Russ. J. Gen. Chem., 2010, 80, 1351 CrossRef CAS.
- T. Tunç, M. Sarı, M. Sadıkoğlu and O. Büyükgüngör, J. Chem. Crystallogr., 2009, 39, 672 CrossRef.
- Y. Huang, C. Rong, R. Zhang and S. Liu, J. Mol. Model., 2017, 23, 3 CrossRef PubMed.
- J. Yu, N. Q. Su and W. Yang, J. Am. Chem. Soc., 2022, 2, 1383 CAS.
- M. U. Khan, M. Khalid, I. Shafiq, R. A. Khera, Z. Shafiq, R. Jawaria, M. Shafiq, M. M. Alam, A. A. C. Braga, M. Imran, F. Kanwal, Z. Xu and C. Lu, J. Saudi Chem. Soc., 2021, 25, 101339 CrossRef CAS.
- J. L. Gázquez, A. Cedillo and A. Vela, J. Phys. Chem. A, 2007, 111, 1966 CrossRef PubMed.
- P. K. Chattaraj, A. Chakraborty and S. Giri, J. Phys. Chem. A, 2009, 113, 10068 CrossRef CAS PubMed.
- J. J. Philips, M. A. Hudspeth, P. M. Browne and J. E. Peralta, Chem. Phys. Lett., 2010, 495, 146 CrossRef CAS.
- A. D. Becke, Phys. Rev. A: At., Mol., Opt. Phys., 1988, 38, 3098 CrossRef CAS PubMed.
- M. J. Frisch, et al., Gaussian 09, Revision D.01, 2009 Search PubMed.
- R. Ditchfield, W. J. Hehre and J. A. Pople, J. Chem. Phys., 1971, 54, 724 CrossRef CAS.
- P. Y. Hay and W. R. Wadt, J. Chem. Phys., 1985, 82, 299 CrossRef CAS.
- R. Dennington, T. Keith and J. Millam, GaussView, Version 5, Shawnee Mission, KS Semichem Inc., 2009 Search PubMed.
- C. Legault, CYLview.
- R. G. Pearson, Proc. Natl. Acad. Sci. U. S. A., 1986, 83, 8440 CrossRef CAS PubMed.
- R. G. Pearson, J. Chem. Educ., 1987, 64, 561 CrossRef CAS.
- J. L. Reed, J. Phys. Chem. A, 1997, 101, 7396 CrossRef CAS.
- R. G. Parr, L. V. Szentpály and S. Liu, J. Am. Chem. Soc., 1999, 121, 1922 CrossRef CAS.
Footnote |
| † Electronic supplementary information (ESI) available. See DOI: https://doi.org/10.1039/d3ma00097d |
| This journal is © The Royal Society of Chemistry 2023 |


