 Open Access Article
Creative Commons Attribution 3.0 Unported Licence
Synchrotron macro ATR-FTIR micro-spectroscopy to unlock silver ion-induced biochemical alterations in bacteria†
Tien Thanh
Nguyen‡
 ab,
Ngoc Huu
Nguyen‡
 bc,
Giang Tuyet
Pham
b,
Jitraporn
Vongsvivut
 d,
Melissa H.
Brown
 e,
Vi Khanh
Truong
 *b and
Krasimir
Vasilev
 *b
*b
aCollege of Medicine and Pharmacy, Tra Vinh University, Tra Vinh 87000, Vietnam
bBiomedical Nanoengineering Laboratory, College of Medicine and Public Health, Flinders University, Bedford Park, SA 5042, Australia. E-mail: Krasimir.vasilev@flinders.edu.au; vikhanh.truong@flinders.edu.au
cSchool of Biomedical Engineering, University of Sydney, Darlington, NSW 2006, Australia
dInfrared Microspectroscopy Beamline, ANSTO Australian Synchrotron, Clayton, VIC 3168, Australia
eCollege of Science and Engineering, Flinders University, Bedford Park, SA 5042, Australia
First published on 1st November 2023
Abstract
Bacterial infections are recognized as the leading cause of death for millions of individuals worldwide. There has been a growing research focused on antimicrobial materials that can provide alternatives to antibiotics. Among these, silver has emerged as a promising antibacterial agent, owing to its remarkable antimicrobial properties. However, the antimicrobial mechanisms of silver ions are still being debated. This study aimed to investigate biochemical and morphological changes that occur in two prevalent pathogenic bacterial cell types following treatment with silver ions. Using synchrotron macro-attenuated total reflection-Fourier transform infrared (ATR-FTIR) micro-spectroscopy and high-resolution microscopy, significant alterations in the protein (amide I and amide II) and phospholipid structural components of both bacterial species after silver treatment could be observed. More subtle modifications of Staphylococcus aureus were observed in the polysaccharide and nucleic acid regions than Pseudomonas aeruginosa. These structural variations can be attributed to the potent chemical interactions between silver ions and the thick cell wall of S. aureus. The findings of this research shed light on the antibacterial mechanisms induced by silver ions, offering a fresh perspective through the utilization of synchrotron ATR-FTIR for the identification of these mechanisms. This study contributes to our understanding of the applications of silver ions in combating infections and provides a foundation for further investigations towards developing more effective antibacterial agents and treatments.
Introduction
In 2019, a staggering 7.7 million deaths worldwide were recorded as a result of infections caused by 33 distinct types of pathogenic bacteria.1 Among these, antibiotic-resistant strains significantly contributed to the severity of the situation, with approximately 4.95 million fatalities linked to antimicrobial resistance.2 This constitutes a pressing global challenge that demands immediate attention. Currently, antibiotic treatment remains the most efficient, safe, and widely practiced approach for combating infections. Nevertheless, the excessive use of antibiotics has engendered the emergence and proliferation of antibiotic-resistant bacteria, while the development of novel antibiotics has struggled to keep up with the rate of development of resistant variants.1,3 Consequently, there is a heightened focus among the scientific and medical communities on researching novel antimicrobial agents.4–7Silver ions are a promising candidate which have garnered increasing attention as a potential antimicrobial agent.8–10 These ions possess the ability to effectively combat various types of microorganisms, even at low concentrations.8,11,12 Previous studies utilizing diverse analytical techniques have revealed that silver ions exert their antimicrobial effects through multiple mechanisms, including disruption of cell membranes, damage to genetic material, generation of intracellular reactive oxygen species, and more.13–15 Despite considerable research, the intricate biochemical interactions between silver ions and microbial cell membranes have not been comprehensively elucidated.13,16 This indicates a significant knowledge gap that warrants thorough investigation, especially with respect to the interaction of Ag+ at the bio-interface.
Quantifying chemical interactions occurring at the biological interface between bacterial cells and silver ions is challenging, especially in the context of living organisms. The Fourier transform infrared spectroscopy (FTIR) technique is a powerful spectroscopic method employed to identify variations in the complete composition of microorganisms. It enables the detection and analysis of molecular signatures present in bacterial composition through the absorption of infrared energy. By revealing changes in the functional groups of biomolecules, FTIR enables precise analysis of microorganisms and their constituents17–19 through identifying the rotational degree and characteristic movement of biochemical bonds, including those in proteins, phospholipids, polysaccharides, and nucleic acids.18–20 Nonetheless, traditional FTIR instruments have inherent limitations in terms of their resolution, preventing them from effectively investigating subcellular events within smaller biological systems like bacteria.
In this pioneering research, we employed the cutting-edge synchrotron macro-attenuated total reflection (ATR)-FTIR micro-spectroscopy to probe the intricate biochemical alterations instigated by silver ions within two pathogenic bacteria, Gram-positive Staphylococcus aureus and Gram-negative Pseudomonas aeruginosa. We chose silver ions for this study due to their renowned efficacy and broad-spectrum antimicrobial activity, even at low concentrations, which is a significant advantage over other antimicrobial agents. Their unique ability to target multiple cellular components simultaneously minimizes the potential for the development of bacterial resistance, distinguishing them as a superior choice in antimicrobial research. The advanced synchrotron macro ATR-FTIR micro-spectroscopy enables a more comprehensive and detailed understanding of these changes at the sub-cellular level, which is impossible with conventional FTIR instruments. Furthermore, it offers unparalleled insights into the multifaceted interactions between silver ions and microbial cell membranes and detailed mappings of biochemical interfaces within cell substructures. This method stands out concerning traditional techniques by enabling us to investigate multiple mechanisms of action concurrently rather than exploring each one sequentially.21
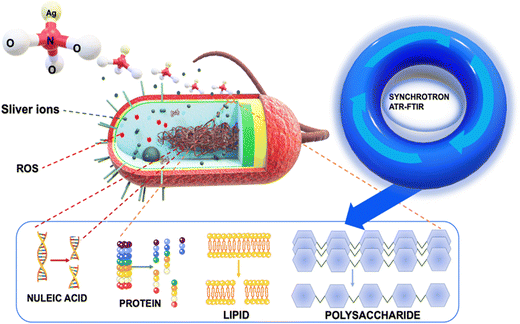
Our innovative approach provided us with an unprecedented view of cellular deformations, protein denaturation, and modifications to the structures of polysaccharides and nucleic acids, all triggered by the interaction with silver ions (Fig. 1). To achieve this, we employed a combination of optical techniques and macro ATR-FTIR micro-spectroscopy. The visualization of bacterial structures post-treatment with silver ions was carried out using scanning electron microscopy (SEM) and confocal laser scanning microscopy (CLSM). By employing high-resolution ATR-FTIR spatial hyperspectral imaging, we successfully mapped the biochemical interfaces within the cell substructures of both control and treated bacterial cell samples. This highlighted discernible variations when comparing the two systems.21,22 To analyze the changes in cellular components, we focused on specific spectral regions. These regions involved the analysis of methylene groups (3000–2800 cm−1), amide I and II (1705–1500 cm−1), as well as regions associated with nucleic acids and polysaccharides (1200–950 cm−1).22–24 Vibrational peaks observed in the methylene regions are frequently linked to the phospholipid membrane of cellular structures. The amide I and II bands are utilized for the identification of microbial cells, as these vibration patterns correspond to proteins.20,21,23 In the specific region, there are two specific ranges of significant importance. The nucleic acid region (1200–1075 cm−1) is closely associated with the DNA and RNA of cells, whereas the polysaccharide bands (1150–900 cm−1) can be attributed to structural polysaccharides, such as peptidoglycan, found throughout the cell and its wall.22–25 Then, principal component analysis (PCA) was used to determine the resemblances and fluctuations in the comparing process between treated and untreated samples related to cell spectral maps. We employed the extended multiplicative scatter correction (EMSC) method to analyze the chemical composition changes in cells when exposed to silver ions, thereby highlighting the important alterations that occur during sample processing with silver ions. The obtained results offer valuable insights into the impact of silver ions on the modification and disruption of bacterial structures, including the cell membrane, phospholipids, proteins, and nucleic acids. The novel insights garnered from the unique application of synchrotron macro ATR-FTIR micro-spectroscopy not only illuminate the multifaceted antimicrobial activity of silver ions but also set the stage for crafting more sophisticated and effective antibacterial strategies in the future.
Methods
Bacterial preparation
The bacterial strains S. aureus ATCC 25923 and P. aeruginosa ATCC 15692 were chosen to represent pathogenic Gram-positive and Gram-negative bacteria, respectively. Prior to each experiment, the bacterial cultures were cultivated on tryptone soy agar (TSA) (Sigma-Aldrich, Australia). Cultures were allowed to grow overnight at a temperature of 37 °C. Subsequently, a single bacterial colony was carefully selected from each culture and cultured in TSB under static conditions overnight at 37 °C. The density of the cultures was collected during the logarithmic growth phase.Minimum inhibitory concentration and minimum bactericidal concentration determination
The MIC of AgNO3 against the test bacteria was determined using a 96-well microplate. A dilution series was created, starting at 1 mg, of AgNO3 in a sterile medium, and going all the way down to 0.015 mg. The wells were then seeded with 20 microliters of a bacterial culture of P. aeruginosa and S. aureus at a density of 106 CFU mL−1. A control group was maintained without AgNO3. Inoculated cultures were incubated at 37 °C in 24 hours before being measured by using plate reading.Following identifying the minimum inhibitory concentration (MIC) of the silver ions, we extracted 50 μL portions from all tubes that showed no signs of bacterial development. These aliquots were then cultured on TSA plates and left to incubate at 37 °C for a 24 hour period. Bactericidal activity of samples is represented by the minimum effective concentration (MBC), which is the concentration at which all bacterial cells are killed.
Live/dead staining
SYTO® 9 and propidium iodide (PI) (Live/dead™ BacLight™, L7007 USA) were mixed at a 1![[thin space (1/6-em)]](https://www.rsc.org/images/entities/char_2009.gif) :
:![[thin space (1/6-em)]](https://www.rsc.org/images/entities/char_2009.gif) 1 ratio, and used to stain the 106 CFU mL−1 bacterial solutions (treated and untreated with silver ions) for 10 minutes. Confocal laser scanning microscopy (Zeiss LSM880, Oberkochen, Germany) was used to determine the percentage of dead bacteria. Zen Blue and Fiji were used for the quantification of the data. All experiment was triplicated.
1 ratio, and used to stain the 106 CFU mL−1 bacterial solutions (treated and untreated with silver ions) for 10 minutes. Confocal laser scanning microscopy (Zeiss LSM880, Oberkochen, Germany) was used to determine the percentage of dead bacteria. Zen Blue and Fiji were used for the quantification of the data. All experiment was triplicated.
Antibacterial percentage was calculated as: (number of dead bacteria)/(total number of bacteria) × 100%.
Scanning electron microscopy characterisation
After incubation with the silver ions, the bacteria cells were preserved in 4% glutaraldehyde for 1 hour at room temperature. Subsequent dehydration was accomplished by immersing the samples in ethanol solutions ranging in concentration from 30% to 100%. The samples were then coated with 2 nm of platinum. The FEI Inspect F50 (FEI Company, Oregon, USA) was used to make the observations at 5 kV and a working distance of 5 mm.Reactive oxygen species determination
To conduct the assay, 100 mL of a diluted solution of 2′,7′-dichlorofluorescin diacetate (DCF-DA) (Abcam, Australia), was added to each well (containing untreated and treated bacterial solutions) and incubated at 37 °C in the dark for 45 minutes. As a positive control, untreated samples of bacteria were exposed to tert-butyl hydroperoxide (TBHP). By monitoring the fluorescence intensity (FI) at 485/535 nm using a confocal laser scanning microscope (CLSM), the relative ROS quantity was determined.Synchrotron ATR-FTIR operation and data analysis
ATR-FTIR mapping was used to examine the spatial distribution of chemical functional groups in untreated samples and those treated with AgNO3. This investigation was performed at the Infrared Micro-spectroscopy (IRM) beamline at the Australian Synchrotron, using a Bruker Hyperion 3000 FTIR microscope connected to a VERTEX V80v FTIR spectrometer (Bruker Optik GmbH, Ettlingen, Germany).26 We incorporated a specialized macro ATR-FTIR device that featured a germanium (Ge) ATR crystal with a 250 μm diameter (nGe = 4.0) and a 20× IR objective (NA = 0.60). The bacterial samples were meticulously mounted on CaF2 surface and subsequently air-dried to ensure the absence of water, which could interfere with the analysis. Following this, the CaF2 surface bearing the samples was positioned on aluminum discs to perform the ATR-FTIR analysis. We managed spectral parameters, such as a spectral range of 3900–950 cm−1 and a spectral resolution of 4 cm−1, using Bruker's OPUS 8.0 software suite. The spectrum of water vapor was subtracted from the sample spectra to minimize the influence of residual water. A background spectrum was collected under the same conditions to ensure the accuracy of the subtraction. The software also facilitated the generation of chemical maps by integrating the area beneath the appropriate peaks in the spectra. We used CytoSpec v. 1.4.02 (Cytospec Inc., Boston, MA, USA) and the UnscramblerX 11.1 software package (CAMO Software AS, Oslo, Norway) to conduct advanced multivariate data analysis.Results and discussion
Antibacterial properties of silver ions against Gram-positive and Gram-negative pathogenic bacteria
The antimicrobial efficacy of the suspension of silver nitrate against two model microbial species was conducted using S. aureus (ATCC 25923) and P. aeruginosa (ATCC 15692). The bactericidal and bacteriostatic activity of silver ion against pathogenic bacteria was determined using minimum inhibitory concentration (MIC) and minimum bactericidal concentration (MBC) assay. As shown in Table 1, silver ion was effective against both S. aureus and P. aeruginosa, with MIC values of 1.5 mM and 0.09 mM, respectively, and MBC values of 3 mM and 0.18 mM, respectively. This result is consistent with previous studies.27–30| Bacterial strains | MIC (mM) | MBC (mM) |
|---|---|---|
| Pseudomonas aeruginosa ATCC 15692 | 0.09 | 0.18 |
| Staphylococcus aureus ATCC 25923 | 0.74 | 1.5 |
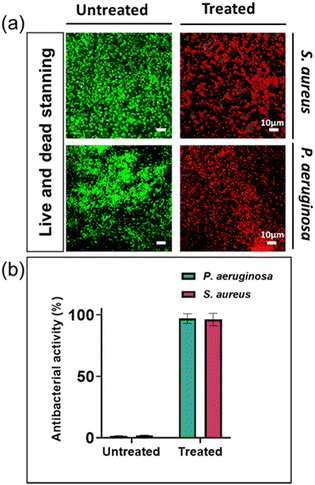
By utilizing live and dead fluorescent staining and employing the determined MIC concentrations, we could effectively evaluate the antibacterial resistance capacity of two specific disease-causing bacterial strains against silver ions. The differentiation between living and deceased cells was established through the application of a staining method alongside confocal laser scanning microscopy (CLSM). The staining process involved using SYTO® 9, which imparted a green hue to the bacterial cells, and propidium iodide (PI), which caused the cells to appear red. The SYTO® 9 stain is typically used to label living bacteria and can passively diffuse into bacterial cells, whereas PI is only able to enter bacteria with permeabilized membranes and is commonly associated with dead or dying cells.31,32
The percentage of bacterial cells that died in untreated bacterial samples was 1.6% and 1.3% for S. aureus and P. aeruginosa, respectively. In contrast, bacterial samples treated with silver nitrate at their MIC had a mortality rate of approximately 99.9% for both types of bacteria (Fig. 2). These findings are consistent with previous research reports.13
Silver ions promoting intracellular reactive oxygen species (ROS) production and inducing morphological alterations in bacterial cells
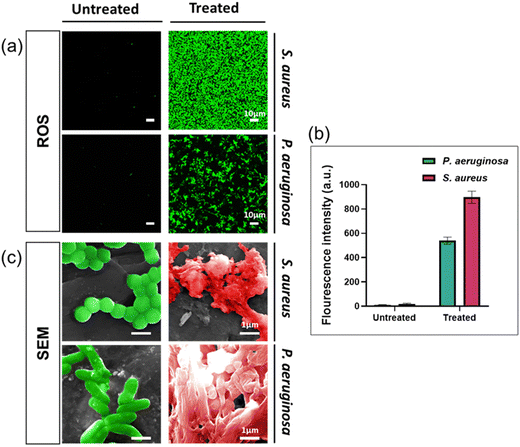
To enhance our comprehension of the antibacterial properties of silver ions, we undertook further studies by examining the presence of reactive oxygen species (ROS) and bacterial morphologies with scanning electron microscopy. ROS generation in bacteria indicates the antimicrobial activity of silver ions.33,34 ROS were detected by using a fluorescent dye (DCFDA/H2DCFDA-Cellular ROS Assay Kit). As shown in Fig. 3a, green fluorescence signals were observed in both bacterial species cultured in solution containing silver ion, with higher fluorescence intensity indicating higher concentrations of intracellular ROS. Based on Fig. 3b, the fluorescence signal intensity detected in S. aureus treated with Ag+ is significantly higher than in P. aeruginosa. These findings demonstrate that silver ions have triggered the generation of intracellular ROS in the bacterial cells.We used SEM to study morphology of these two bacterial species after being exposed for 24 hours to AgNO3 at the MIC concentration. The results indicated significant alterations in the bacterial structure and shape compared to healthy (control) cells, as both the cell membrane structure and the overall bacterial architecture appeared almost entirely disrupted (Fig. 3c). Observations of the bacterial cell membrane integrity indicated that it was completely compromised, leading to the extrusion of the bacterial cytoplasm. This suggests that silver ions trigger the formation of ROS, resulting in disrupting the cell membrane, leading to bacterial cell death through several pathways, including damage to the cell membrane, interaction with nucleic acids, and disruption of bacterial proteins, consistent with findings in multiple published studies.13,35,36
Analysis of the interaction between silver ions and bacteria using macro ATR-FTIR micro-spectroscopy
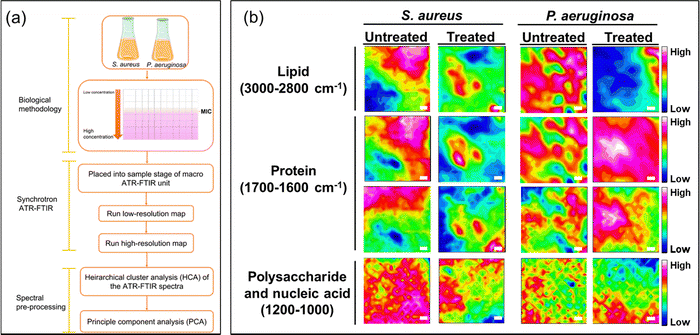
To elucidate the antibacterial mechanisms of silver ions, we employed an advanced analytical technique known as ATR-FTIR micro-spectroscopy. This technique allowed us to capture changes in bacterial structural molecules, as reflected in the spectra obtained from the synchrotron macro ATR-FTIR micro-spectroscopy system, thus providing comparative analyses of their alterations.High-resolution ATR-FTIR micro-spectroscopy synchrotron maps were collected to investigate the biochemical interactions of silver ions with both Gram-negative and Gram-positive bacterial cells. Specifically, to delve into the structural changes of the molecules within the cell membrane and bacterial nucleus, we selected key spectral regions, including the methylene region (3000–2800 cm−1) for lipids, the amide region (1705–1600 cm−1) for proteins, and a specific area (1200–950 cm−1) for polysaccharides and nucleic acids changes.
From the obtained spectral data, we constructed tables representing these spectral regions. In Fig. 4, they are represented as a function of the FTIR absorption intensity, estimated by integrating data across the designated spectral region.25,37,38 These provide a direct and accurate visualization of spectral data in actual space.
In Fig. 4, the overlapping regions with high intensity identified in the spectral ranges of 3000–2800 cm−1 and 1705–1600 cm−1, respectively, represent points indicating the presence of abundant lipid and protein content.20,39 In the lower wavenumber range of 1200–1000 cm−1, polysaccharides, which constitute the structural components of bacterial cells, are indicated. In the FTIR maps, the intense mixed signals of lipids and proteins are considered as the accumulation sites in bacterial cells. This holds significance as it underscores the impressive resolution of the technique while firmly establishing the feasibility of attaining subcellular spectral analysis.
The images of spectral maps provide crucial information about the spectral distribution of functional groups belonging to bacteria of interest. Identifying the differences in the spectra representing these groups can help determine the structural changes in bacteria after they have been exposed to silver ions.
For the untreated sample, the spectral overlap of the –CH and amide functional groups is relatively similar. The spectra of polysaccharides are more broadly distributed, but overlapping locations still reside at points of high-intensity amides and lipids. These spectra are concentrated in the same areas that can be identified on the spectral maps. Conversely, the spectral maps present a different distribution of the functional groups for samples treated with silver ions when compared with untreated samples. The treated samples exhibit a reduction in overlapping points and an increase in more distinct signals in the –CH and amide spectral regions. This supports the idea that exposure to silver ions results in bacterial cell degradation, exposing intracellular components in bacteria such as lipids and proteins. This is supported by the changes in bacterial structure observed in the SEM images (Fig. 3c).
To gain a statistical perspective on the differences in spectral maps, we conducted hierarchical cluster analysis (HCA) to group regions with similar spectra. The selected spectral ranges for analysis included protein–polysaccharide-nucleic acid (1810–1000 cm−1) and lipid (3004–2810 cm−1) spectra. The second derivative was utilized to highlight the prominent spectral regions as it represents the overall rate of spectral change.40,41
Subsequently, five spectral plots were generated based on the average spectral values of clusters exhibiting similar spectral patterns. To determine the dominant average spectra for use in PCA, we compared and selected the cluster(s) with the largest area coverage in the spectral map. Additionally, the selected cluster's average spectrum should exhibit the highest peak intensities and lowest noise levels among functional groups, including amide I and –CH stretching. They were chosen because they have the highest distinct peaks for determining the presence of cells. These standards were employed to choose a cluster that comprised cells, enabling comparisons between the untreated and treated samples.20,21,37
To analyze and identify significant changes in the recorded spectral system observed by the synchrotron macro ATR-FTIR system between untreated and treated samples, we performed HCA as mentioned earlier. Before processing the spectra by EMSC, all spectra belonging to the spectral cluster were first subjected to a second-derivative transformation. Subsequently, the combined set of spectra underwent PCA to explore the similarities and distinctions among the cell groups.20,21 The PCA scores for the principal components, namely PC-1, PC-2, and PC-3, were calculated and displayed in Fig. 5a and 6a. These scores were utilized to elucidate the differences between the untreated and silver ion-treated cell samples.
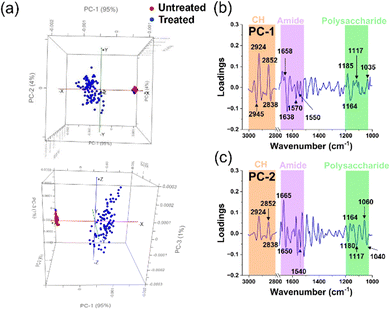 | ||
| Fig. 5 Principal component analysis (PCA) of untreated and treated S. aureus cells. (a) Comparative PCA score plots for untreated and treated S. aureus cells. (b) and (c) PCA loading spectra correlations between PC-1 and PC-2 scores for untreated and treated groups in each microbial cell population. The peaks of interest and their corresponding assignments are summarised in Table 2. | ||
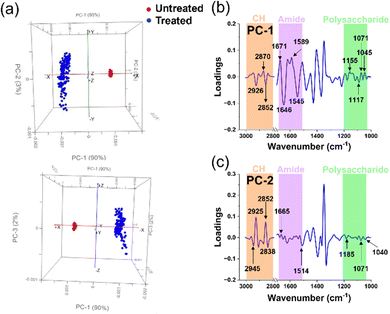 | ||
| Fig. 6 Principal Component Analysis of untreated and treated P. aeruginosa cells. (a) Comparative PCA score plots for untreated and treated P. aeruginosa cells. (b) and (c) PCA loading spectra correlations between PC-1 and PC-2 scores for untreated and treated groups in each microbial cell population. The peaks of interest and their corresponding assignments are summarised in Table 2. | ||
Fig. 5a demonstrates a notable dissimilarity between the two samples, with PC-1 and PC-2 accounting for 95% and 4% of the observed variation, respectively. This indicates a significant change when the Gram-positive bacterium S. aureus was subjected to silver ion treatment. The PCA score plot reveals a clustered distribution of scores for the untreated samples along PC-1 and PC-2, while the scores representing the treated samples appear more scattered. Based on the PCA characteristics, it can be inferred that the tight clustering of PCA scores in the untreated samples results from the similarity in the biochemical structural composition of the cellular constituents. In contrast, the scattered distribution suggests a lack of similarity in the biochemical structures among the cells, indicating that the cells have undergone transformation or degradation.20,21 Additionally, we observed minimal overlap between the treated and untreated samples. However, these few instances do not diminish the noteworthy changes in the chemical components of bacterial cell functional groups caused by silver ions. To further explore the changes in the chemical structure of functional groups between the untreated and treated samples, we further utilized the PCA loadings, particularly PC-1 and PC-2. The magnitude of the load peaks can signal the extent of disparity, where greater magnitudes indicate apparent variations. The significant peaks are emphasized in Fig. 5b, c, and the related biochemical substances have been identified in the ESI† tables. A summary of these findings can be found in Table 2.
| Bacterial species | PC | Wavenumber (cm−1) | Assignment | Ref. |
|---|---|---|---|---|
| S. aureus | 1 | 2945–2836 | C–H stretching from methylene (–CH2) groups, acyl chains and aliphatic alkanes in the lipids | 22, 24 and 25 |
| 1673–1638 | Amide I: anti-parallel β-sheet and α-helical structure of amide I | 22, 23 and 25 | ||
v(C![[double bond, length as m-dash]](https://www.rsc.org/images/entities/char_e001.gif) O) of carboxylate and ν(C O) of carboxylate and ν(C![[double bond, length as m-dash]](https://www.rsc.org/images/entities/char_e001.gif) C) of aromatic compounds C) of aromatic compounds |
||||
| 1570–1550 | Amide II: perpendicular modes of the α-helix and antiparallel β-sheet | 22 and 25 | ||
| 1185–1060 | CH2 | 24 and 25 | ||
| C–O propionates and higher esters, formats | ||||
| v(CO) stretching coupled with C–O mainly from the C–O stretching mode of C–OH groups | ||||
| 1035 | Skeletal trans conformation (CC) of DNA | 25 | ||
| 2 | 2924–2852 | C–H stretching from methylene (–CH2) groups, acyl chains and aliphatic alkanes in the lipids | 22, 24 and 25 | |
| 1666–1650 | Amide I: disordered structure-solvated | 23 and 25 | ||
| 1571–1540 | Protein amide II absorption-predominately | 23 and 25 | ||
| β-sheet of amide II | ||||
| 1180 | Amide III band region | 25 | ||
| 1164 | C–O stretching ribose | 25 | ||
| 1117–1040 | C–O stretching vibration of C–OH group of ribose (RNA) | 23 and 25 | ||
| Stretching C–O deoxyribose | ||||
| Symmetric PO2− stretching in RNA and DNA | ||||
| P. aeruginosa | 1 | 2925–2852 | ν as(C–H) from methylene (–CH2) groups of lipids | 22, 24 and 25 |
| ν sCH3 | ||||
| Stretching C–H, N–H | ||||
| Symmetric stretching vibration of CH3 of acyl chains (lipids) | ||||
| 1671–1648 | Amide I: anti-parallel β-sheet C![[double bond, length as m-dash]](https://www.rsc.org/images/entities/char_e001.gif) O, C–N and N–H bond O, C–N and N–H bond |
22, 23, 25 and 42 | ||
| 1545–1509 | Amide II protein structures: α-helix and β-sheet | 23, 25 and 43 | ||
| 1155 | ν as(CO–O–C) of glycogen and nucleic acids (DNA and RNA) | 22 and 25 | ||
| C–O stretching vibration | ||||
| 1117–1045 | C–O stretching vibration of C–OH group of ribose (RNA) | 23 and 25 | ||
| νC–O of proteins and carbohydrates | ||||
| Phosphate I band for two different C–O vibrations of deoxyribose in DNA in disordering structure | ||||
| 2 | 2945–2836 | ν as(C–H) stretching from methylene (–CH2) groups of lipids | 22, 24 and 25 | |
| ν s CH3 | ||||
| Stretching C–H, N–H | ||||
| Symmetric stretching vibration of CH3 of acyl chains (lipids) | ||||
| 1665 | Amide I: α-helix | 22, 24 and 25 | ||
| 1514 | Amide II: parallel mode of the α-helix | 22 | ||
| 1184 | CH2 | 25 | ||
| 1071–1040 | Phosphate I band for two different C–O vibrations of deoxyribose in DNA in disordering structure. | 25 |
The interaction between S. aureus cells and silver ions is elucidated through the PCA loadings in PC-1. The loading plot highlights that most of the peaks with significant intensity are concentrated within the lipid region. Specifically, two peaks of high intensity are observed in the lipid region, suggesting possible alterations in the methylene groups within the phospholipid structure that constitutes the cell membrane.22,25 Subsequently, peaks with elevated intensity are predominantly located in the amide I and amide II regions, indicating structural modifications in proteins within the treated samples.24,25,38 Noteworthy, changes in the cell membrane can also be discerned by peaks within the polysaccharide and nucleic acid region.25
In contrast to the high intensity of peaks in the lipid region of the PC-1 loading, the PC-2 loading spectra of S. aureus showed greater intensity peaks located at amide I and amid II regions.20,22,24 The latter suggests that changes of protein in bacterial cells occurred.
The alterations in the lipid functional groups within the cellular membrane continue to be loaded in the PC-2 spectra through discernible peaks in the lipid region (Fig. 5c). The prominent escalation of peaks within the amide I, amide II, and lipid regions, observed in both PC-1 and PC-2 spectra, signifies the influence of silver ions on the protein and lipid structures within the bacterial cell membrane. Furthermore, the emergence of bends is also evident through peaks in the polysaccharide and nucleic acid region.23,25 The polysaccharides are known to be allocated to the capsule layer and thick cell wall (peptidoglycan layer) of Gram-positive S. aureus.44 Therefore, the variations in the spectral properties within this polysaccharide range provide compelling evidence of significant changes occurring in the bacterial cell membrane following silver ion treatment. These changes suggest a potential loss of structural integrity in the cell membrane, as clearly observed through the utilization of SEM images in Fig. 3c. Additionally, we observed prominent peaks in the PC-2 loading, indicating alterations in the nucleic acid structure of the cells.23,25 These changes could potentially arise from the integration process involving Ag+ (and O2˙− radicals), leading to the generation of highly reactive hydroxyl radicals (OH˙).45,46 ROS possess the capability to selectively affect cellular biomolecules, thereby giving rise to oxidative stress. This consequential process can instigate detrimental consequences, such as DNA damage, inhibition of replication, and disruption of RNA functionality.15,45 Indeed, ROS were detected in the S. aureus cells using fluorescence staining and quantified through CLMS imaging (Fig. 3a). The intensity of ROS was found to be significantly higher than the control, registering at levels above 850 a.u.
The PCA score plots of the untreated and treated groups for P. aeruginosa (Fig. 6a) unveiled distinct differences between the two groups, as evidenced by the respective 90% and 3% contributions of PC-1 and PC-2. These significant alterations within the cellular structure ensued following exposure to Ag+ solution, an observation closely mirroring that made in the Gram-positive bacterium S. aureus. This similarity is likely due to the congruent cellular architecture of these two bacterial strains.47,48
In the PCA score distribution (Fig. 6a), untreated cell samples exhibited clustered PCA points. Conversely, PCA points of treated cell samples presented a broad scatter between PC-1 and PC-2. This disparity may be attributed to the structural disarray instigated by the silver ions’ intervention, leading to cell destruction and diverse variation. Further, to elucidate the precise alterations in the cellular functional groups, we extended the use of PC-1 and PC-2 loadings (Fig. 6b and c) to investigate the characteristic disparities between the Ag+ treated and untreated samples.
The interaction between P. aeruginosa cells and silver ions was elucidated via the PCA loads in PC-1. The load plot accentuated several prominent peaks within the amide I and II regions, alluding to modifications in cellular proteins.22–25 Specifically, two pronounced peaks in the protein region signified alterations in the β-sheet bonds of amide I and δN–H, νC–N bonds of amide II, integral to the protein cellular structure. Lipids were the subsequent focus, with CH2 stretching bonds apparent, suggesting lipid bond degradation in the cell membrane and protein alteration upon silver ion interaction.22,25 The alterations indicate a possible compromise in the stability of the cellular membrane, which is clearly shown in Fig. 3c through the application of SEM images. Interestingly, P. aeruginosa displayed a more vigorous transformation in the amide I and II regions compared to S. aureus, as shown by the spectral intensity of these functional groups in PC-1, which may be due to the structural differences between the Gram-positive and Gram-negative bacterial envelops.48
Another notable change was discerned from the spectral peaks in the polysaccharide region, derived from C–O bonds in the polysaccharide structures.22,25 This peptidoglycan layer, part of the bacterial cell membrane, exhibited lower spectral peak intensities in P. aeruginosa compared to S. aureus, likely owing to the comparatively thinner peptidoglycan layer in Gram-negative bacteria.48 Concurrently, we observed changes in the PO2 stretching bonds in nucleic acids, possibly due to silver ion induced nucleic acid structure destruction via the formation of intracellular ROS groups in bacteria.36 Indeed, fluorescence staining was employed to identify ROS within P. aeruginosa, and their quantity was determined using CLMS imaging (Fig. 3a). The analysis revealed that the ROS levels were notably elevated compared to the control group (untreated), surpassing the threshold of around 500 a.u. Additionally, In PC-2 loading, we observed prominent peaks indicating alterations in the lipid structure of the cells.23,25 The spectral intensities found within key regions of interest, specifically those related to proteins and polysaccharides, are discernible, albeit with notably low intensity. These findings, which highlight the structural modifications in cells upon treatment with silver ions, corroborate those of prior studies that employed various analytical methods.13,33,49,50 This not only validates our results but also extends our collective understanding of the multifaceted influence exerted by silver ions on bacterial cells, thereby adding to a growing body of research.13,14,51
To illuminate the considerable transformations in the chemical constituents of bacterial cells subsequent to the silver ion treatment, we conducted an analysis on individual spectra extrapolated from second derivatives for both types of bacteria (as illustrated in Fig. 7 and 8). Pertaining to Fig. 7, distinct variances at spectral peaks, representative of lipid groups in S. aureus, are most prominently exhibited. This is evidenced by the heightened peak intensity in the system subjected to treatment, as contrasted with the untreated system. In the realm of proteins, disparities were similarly observed. The spectral peaks of amide I demonstrated a subtle shift towards a larger numerical value, whereas the amide II band underwent morphological alteration and showed an increase in spectral intensity exceeding that of the untreated sample. Within the lipid domain, we observe a subtle transition towards an increased wavenumber, which may hint at intrinsic variations in the interactions occurring between silver ions and S. aureus. When considering the nucleic acid region, it is evident that there is a marked shift post-silver ion treatment. The spectral peak located at 1035 cm−1 presents an enhanced intensity, progressing towards a higher wavenumber subsequent to treatment.
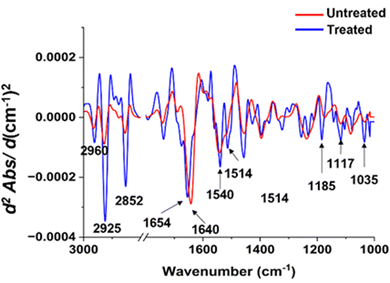 | ||
| Fig. 7 Comparisons of the average EMSC-corrected second derivative spectra of the untreated and treated S. aureus with Ag ions. | ||
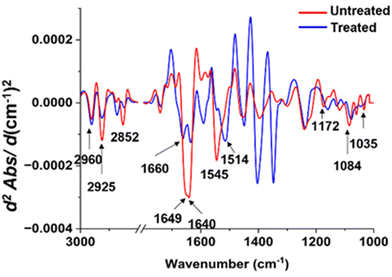 | ||
| Fig. 8 Comparisons of the average EMSC-corrected 2nd derivative spectra of the untreated and treated P. aeruginosa with Ag ions. | ||
In contrast to the distinct spectral variations observed in the lipid region of S. aureus, the protein region displayed the most noteworthy alterations in the P. aeruginosa sample exposed to silver ions (Fig. 7). The spectral peaks corresponding to the amide I region exhibited a significant reduction in intensity following the treatment. Moreover, these peaks appeared more pronounced and demonstrated a slight shift towards higher wavenumbers. It is worth noting that the amide II region underwent substantial changes, characterized by a decrease in intensity and a spectral peak shift towards lower wavenumbers.
Regarding the lipid regions, a majority of the peaks experienced a decrease in intensity, with the exception of the peak at 2852 cm−1, which shifted towards higher wavenumbers. The alterations were also evident in the polysaccharide regions, where the peaks exhibited a subtle increase in intensity and shifted towards lower wavenumbers compared to the untreated sample. Furthermore, the peaks within the nucleic acid region displayed a considerable decrease in intensity, notably the peak at 1084 cm−1, which shifted towards lower wavenumbers. The combined findings from these spectra shed light on the specific cellular transformations that occur upon exposure to silver ions, offering valuable insights into the underlying antimicrobial mechanism of this chemical.
Silver ions have emerged as promising antibacterial agents in various medical material applications. Despite existing studies on the impact of silver ions on bacterial cells, many mechanisms are still under discussion. This study employed synchrotron macro ATR-FTIR and microscopy techniques to investigate the intricate biochemical interactions between silver ions and two prevalent pathogenic bacteria: S. aureus and P. aeruginosa.
Microscopic SEM and CLSM examinations revealed remarkable deformations in bacterial cells following exposure to silver ions. We generated ATR-FTIR spectral maps to elucidate the underlying biochemical transformations using the synchrotron as the primary light source. Comparing treated and untreated samples through principal component analysis targeting specific wavenumber regions associated with lipids, proteins, polysaccharides, and nucleic acids, our analysis unveiled the disruptive effect of silver ions on the cell membrane structure, corroborated by SEM and CLSM imaging. Furthermore, chemical changes in the amide I and amide II regions indicated protein denaturation in the treated bacterial samples. The impact of silver ions extended to polysaccharide and nucleic acid structures, manifested by subtle variations in spectral intensity and shifts in wavenumbers. Notably, the generation of intracellular ROS, resulting from the interaction with silver ions, was identified as one of the factors contributing to protein and nucleic acid degradation. These findings contribute to our understanding of the antimicrobial mechanism of silver ions and hold implications for the development of effective antibacterial treatments in the future.
Conclusions
In conclusion, the utilization of high-resolution ATR-FTIR with a synchrotron source has provided significant elucidation on the complex biochemical interaction between silver ions and bacterial cells. This valuable understanding has the potential to significantly impact the advancement of antimicrobial treatments centered around silver ions, fostering the development of more effective and targeted therapeutic approaches.Conflicts of interest
There are no conflicts to declare.Acknowledgements
K. V. thanks NHMRC for Fellowship GNT1194466. V. K. T. thanks for the support from Flinders Foundation Health Seed Grant. Facilities and technical support from the Flinders Microscopy and Microanalysis Facility, a node of Microscopy Australia, is acknowledged. This research was undertaken in part on the Infrared microscopy beamline at the Australian Synchrotron, part of ANSTO. T. T. N. acknowledges the support of time and facilities from Tra Vinh University (TVU) for this study.Notes and references
- K. S. Ikuta, L. R. Swetschinski, G. Robles Aguilar, F. Sharara, T. Mestrovic, A. P. Gray, N. Davis Weaver, E. E. Wool, C. Han, A. Gershberg Hayoon, A. Aali and S. M. E. A. Abate, Lancet, 2022, 400(10369), 2221–2248 CrossRef PubMed.
- C. J. L. Murray, K. S. Ikuta, F. Sharara, L. Swetschinski, G. Robles Aguilar, A. Gray, C. Han, C. Bisignano, P. Rao, E. Wool, S. C. Johnson and A. J. E. A. Browne, Lancet, 2022, 399(10325), 629–655 CrossRef CAS PubMed.
- M. S. Butler, V. Gigante, H. Sati, S. Paulin, L. Al-Sulaiman, J. H. Rex, P. Fernandes, C. A. Arias, M. Paul, G. E. Thwaites, L. Czaplewski, R. A. Alm, C. Lienhardt, M. Spigelman, L. L. Silver, N. Ohmagari, R. Kozlov, S. Harbarth and P. Beyer, Antimicrob. Agents Chemother., 2022, 66(3), e01991 CrossRef CAS PubMed.
- I. Banerjee, R. C. Pangule and R. S. Kane, Adv. Mater., 2011, 23(6), 690–718 CrossRef CAS PubMed.
- Z. Geng, R. Wang, X. Zhuo, Z. Li, Y. Huang, L. Ma, Z. Cui, S. Zhu, Y. Liang, Y. Liu, H. Bao, X. Li, Q. Huo, Z. Liu and X. Yang, Mater. Sci. Eng., C, 2017, 71, 852–861 CrossRef CAS PubMed.
- A. Elbourne, S. Cheeseman, P. Atkin, N. P. Truong, N. Syed, A. Zavabeti, M. Mohiuddin, D. Esrafilzadeh, D. Cozzolino, C. F. McConville, M. D. Dickey, R. J. Crawford, K. Kalantar-Zadeh, J. Chapman, T. Daeneke and V. K. Truong, ACS Nano, 2020, 14(1), 802–817 CrossRef CAS PubMed.
- K. Y. Kwon, S. Cheeseman, A. Frias-De-Diego, H. Hong, J. Yang, W. Jung, H. Yin, B. J. Murdoch, F. Scholle, N. Crook, E. Crisci, M. D. Dickey, V. K. Truong and T.-I. Kim, Adv. Mater., 2021, 33(45), 2104298 CrossRef CAS PubMed.
- A. Hamad, K. S. Khashan and A. Hadi, J. Inorg. Organomet. Polym. Mater., 2020, 30(12), 4811–4828 CrossRef CAS.
- S. Taheri, A. Cavallaro, S. N. Christo, L. E. Smith, P. Majewski, M. Barton, J. D. Hayball and K. Vasilev, Biomaterials, 2014, 35(16), 4601–4609 CrossRef CAS PubMed.
- K. Prasad, G. S. Lekshmi, K. Ostrikov, V. Lussini, J. Blinco, M. Mohandas, K. Vasilev, S. Bottle, K. Bazaka and K. Ostrikov, Sci. Rep., 2017, 7(1), 1591 CrossRef PubMed.
- A. Panáček, M. Kolář, R. Večeřová, R. Prucek, J. Soukupová, V. Kryštof, P. Hamal, R. Zbořil and L. Kvítek, Biomaterials, 2009, 30(31), 6333–6340 CrossRef PubMed.
- A. Panáček, L. Kvítek, R. Prucek, M. Kolář, R. Večeřová, N. Pizúrová, V. K. Sharma, T. J. Nevěčná and R. Zbořil, J. Phys. Chem. B, 2006, 110(33), 16248–16253 CrossRef PubMed.
- W. K. Jung, H. C. Koo, K. W. Kim, S. Shin, S. H. Kim and Y. H. Park, Appl. Environ. Microbiol., 2008, 74(7), 2171 CrossRef CAS PubMed.
- T. C. Dakal, A. Kumar, R. S. Majumdar and V. Yadav, Front. Microbiol., 2016, 7 Search PubMed.
- A. Kędziora, M. Speruda, E. Krzyżewska, J. Rybka, A. Łukowiak and G. Bugla-Płoskońska, Int. J. Mol. Sci., 2018, 19, 444 CrossRef PubMed.
- I. X. Yin, J. Zhang, I. S. Zhao, M. L. Mei, Q. Li and C. H. Chu, Int. J. Nanomed., 2020, 15, 2555–2562 CrossRef CAS PubMed.
- F. Faghihzadeh, N. M. Anaya, L. A. Schifman and V. Oyanedel-Craver, Nanotechnol. Environ. Eng., 2016, 1(1), 1 CrossRef.
- I. Saraeva, E. Tolordava, S. Sheligyna, A. Nastulyavichus, R. Khmelnitskii, N. Pokryshkin, D. Khmelenin, S. Kudryashov, A. Ionin and A. Akhmatkhanov, Int. J. Mol. Sci., 2023, 24, 5119 CrossRef CAS PubMed.
- D. Bajrami, S. Fischer, H. Barth, M. A. Sarquis, V. M. Ladero, M. Fernández, M. C. Sportelli, N. Cioffi, C. Kranz and B. Mizaikoff, npj Biofilms Microbiomes, 2022, 8(1), 92 CrossRef PubMed.
- S. Cheeseman, Z. L. Shaw, J. Vongsvivut, R. J. Crawford, M. F. Dupont, K. J. Boyce, S. Gangadoo, S. J. Bryant, G. Bryant, D. Cozzolino, J. Chapman, A. Elbourne and V. K. Truong, Molecules, 2021, 26, 3890 CrossRef CAS PubMed.
- J. Vongsvivut, D. Pérez-Guaita, B. R. Wood, P. Heraud, K. Khambatta, D. Hartnell, M. J. Hackett and M. J. Tobin, Analyst, 2019, 144(10), 3226–3238 RSC.
- J. Vongsvivut, P. Heraud, A. Gupta, M. Puri, D. McNaughton and C. J. Barrow, Analyst, 2013, 138(20), 6016–6031 RSC.
- S. J. Parikh and J. Chorover, Langmuir, 2006, 22(20), 8492–8500 CrossRef CAS PubMed.
- J. Oberle, J. Dighton and G. Arbuckle-Keil, Fungal Biol., 2015, 119(11), 1100–1114 CrossRef CAS PubMed.
- Z. Movasaghi, S. Rehman and D. I. ur Rehman, Appl. Spectrosc. Rev., 2008, 43(2), 134–179 CrossRef CAS.
- J. Vongsvivut, D. Pérez-Guaita, B. R. Wood, P. Heraud, K. Khambatta, D. Hartnell, M. J. Hackett and M. J. Tobin, Analyst, 2019, 144(10), 3226–3238 RSC.
- P. Singh, S. Pandit, V. Mokkapati, J. Garnæs and I. Mijakovic, Molecules, 2020, 25, 2783 CrossRef CAS PubMed.
- A. Pormohammad and R. J. Turner, Antibiotics, 2020, 9, 853 CrossRef CAS PubMed.
- A. Pormohammad, A. Firrincieli, A. Salazar-Alemán Daniel, M. Mohammadi, D. Hansen, M. Cappelletti, D. Zannoni, M. Zarei and J. Turner Raymond, Microbiol. Spectrum, 2023, e00628 Search PubMed.
- H. D. Salman, J. Global Pharma Technol., 2017, 9, 238–248 Search PubMed.
- L. Boulos, M. Prévost, B. Barbeau, J. Coallier and R. Desjardins, J. Microbiol. Methods, 1999, 37(1), 77–86 CrossRef CAS PubMed.
- S. M. Stocks, Cytometry, Part A, 2004, 61A(2), 189–195 CrossRef CAS PubMed.
- A. Kędziora, R. Wieczorek, M. Speruda, I. Matolínová, T. M. Goszczyński, I. Litwin, V. Matolín and G. Bugla-Płoskońska, Front. Microbiol., 2021, 12 Search PubMed.
- H.-J. Park, J. Y. Kim, J. Kim, J.-H. Lee, J.-S. Hahn, M. B. Gu and J. Yoon, Water Res., 2009, 43(4), 1027–1032 CrossRef CAS PubMed.
- Y. Yakabe, T. Sano, H. Ushio and T. Yasunaga, Chem. Lett., 1980,(4), 373–376 CrossRef CAS.
- O. McNeilly, R. Mann, M. Hamidian and C. Gunawan, Front. Microbiol., 2021, 12 Search PubMed.
- D. Q. Pham, S. J. Bryant, S. Cheeseman, L. Z. Y. Huang, G. Bryant, M. F. Dupont, J. Chapman, C. C. Berndt, J. Vongsvivut, R. J. Crawford, V. K. Truong, A. S. M. Ang and A. Elbourne, Nanoscale, 2020, 12(38), 19888–19904 RSC.
- W. Jiang, A. Saxena, B. Song, B. B. Ward, T. J. Beveridge and S. C. B. Myneni, Langmuir, 2004, 20(26), 11433–11442 CrossRef CAS PubMed.
- M. D. Guillén and N. Cabo, J. Am. Oil Chem. Soc., 1997, 74(10), 1281–1286 CrossRef.
- Y. Y. Wang, J. Q. Li, H. G. Liu and Y. Z. Wang, Molecules, 2019, 24(12), 2210 CrossRef CAS PubMed.
- J. Kong and S. Yu, Acta Biochim. Biophys. Sin., 2007, 39(8), 549–559 CrossRef CAS PubMed.
- A. D. Meade, C. Clarke, F. Draux, G. D. Sockalingum, M. Manfait, F. M. Lyng and H. J. Byrne, Anal. Bioanal. Chem., 2010, 396(5), 1781–1791 CrossRef CAS PubMed.
- S. Kalmodia, S. Parameswaran, W. Yang, C. J. Barrow and S. Krishnakumar, Sci. Rep., 2015, 5, 16649 CrossRef CAS PubMed.
- C. Weidenmaier and J. C. Lee, in Structure and Function of Surface Polysaccharides of Staphylococcus aureus, Staphylococcus aureus: Microbiology, Pathology, Immunology, Therapy and Prophylaxis, ed. F. Bagnoli, R. Rappuoli, G. Grandi, Springer International Publishing, Cham, 2017, pp. 57–93 Search PubMed.
- H. Xu, F. Qu, H. Xu, W. Lai, Y. Andrew Wang, Z. P. Aguilar and H. Wei, BioMetals, 2012, 25(1), 45–53 CrossRef CAS PubMed.
- B. Ezraty, A. Gennaris, F. Barras and J.-F. Collet, Nat. Rev. Microbiol., 2017, 15(7), 385–396 CrossRef CAS PubMed.
- W. Vollmer, D. Blanot and M. A. De Pedro, FEMS Microbiol. Rev., 2008, 32(2), 149–167 CrossRef CAS PubMed.
- T. J. Silhavy, D. Kahne and S. Walker, Cold Spring Harbor Perspect. Biol., 2010, 2(5), a000414 Search PubMed.
- Q. L. Feng, J. Wu, G. Q. Chen, F. Z. Cui, T. N. Kim and J. O. Kim, J. Biomed. Mater. Res., 2000, 52(4), 662–668 CrossRef CAS PubMed.
- D. Inbakandan, C. Kumar, M. Bavanilatha, D. N. Ravindra, R. Kirubagaran and S. A. Khan, Microb. Pathog., 2016, 99, 135–141 CrossRef CAS PubMed.
- Z. Xu, C. Zhang, X. Wang and D. Liu, ACS Appl. Bio Mater., 2021, 4(5), 3985–3999 CrossRef CAS PubMed.
Footnotes |
| † Electronic supplementary information (ESI) available. See DOI: https://doi.org/10.1039/d3ma00598d |
| ‡ Equal contribution. |
| This journal is © The Royal Society of Chemistry 2023 |

