 Open Access Article
A nanostructured lateral flow immunoassay strip combined with Au@SiO2 SERS nanotags for multiplex biomarker detection
Geng
Zhu†
abc,
Yuanbao
Zhan†
abc,
Yu
Lu
abc,
Fei
Zheng
 d,
Yu
Wan
ae,
Bing
Liu
f,
Xi
Yang
abc,
Yanhui
Wan
g,
Qingjiang
Sun
 a,
Jingjie
Sha
d,
Yan
Huang
*abc and
Xiangwei
Zhao
 *abc
*abc
aState Key Laboratory of Bioelectronics, School of Biological Science and Medical Engineering, Southeast University, Nanjing 210096, China
bInstitute of Biomaterials and Medical Devices, Southeast University, Suzhou 215163, China
cSoutheast University Shenzhen Research Institute, Shenzhen 518000, China
dJiangsu Key Laboratory for Design and Manufacture of Micro-Nano Biomedical Instruments, School of Mechanical Engineering, Southeast University, Nanjing, China
eJiangsu Simcere Pharmaceutical Co., Ltd, Nanjing 210042, China
fNantong Univ, Inst Reprod Med, Med Sch, Nantong 226001, China
gDepartment of Health Medicine, General Hospital of Eastern Theater Command, PLA, Nanjing 210002, China
First published on 9th November 2023
Abstract
Blood biomarker detection can conveniently and non-invasively realize early diagnosis in asymptomatic people with Alzheimer's disease (AD). However, disease biomarkers have extremely low abundance; therefore, ultrahigh sensitive detection techniques are required, which are still a challenge. This research proposes a nanostructured lateral flow immunoassay strip combined with Au@SiO2 surface-enhanced Raman scattering (SERS) nanotags (nanostructured SERS-LFIA) for rapid and low-cost detection and to improve the sensitivity, replacing the conventional test line (T line) with inverse opal nitrocellulose. The nanostructured SERS-LFIA is used to detect AD biomarkers as a possible application in early diagnosis. Two AD biomarkers, Aβ42 and Aβ40, encoded by SERS nanotags are simultaneously detected on the same nanostructured T line, with a limit of detection (LOD) of 15.3 and 16.8 fg mL−1, respectively, about 10 times lower than that of SERS-LFIA. The nanostructured SERS-LFIA has great potential in the non-invasive detection of AD biomarkers and early diagnosis.
1. Introduction
Early diagnosis and timely intervention are vital for disease screening and treatment.1,2 However, existing medical tests cannot meet the rapid and convenient clinical requirements. Point-of-care testing (POCT) is a convenient but inexpensive technology that reduces the analysis and processing time, allowing physicians to take timely actions for optimal patient care,3,4 which is highly in demand for early diagnosis and treatments.Among many POCT methods, lateral flow immunoassay (LFIA) is the fastest-growing technology due to its rapid response, simplicity, low cost, and low sample consumption.5,6 However, its low sensitivity and poor quantification hampers its applications in POCT for disease diagnosis.7,8 Recently, a highly sensitive LFIA technique has been proposed based on surface-enhanced Raman scattering (SERS) nanotags with unique advantages of ultra-high sensitivity and multi-target detection, broadening the application of traditional LFIA to multiplex and ultrasensitive detection.9–11
The nitrocellulose (NC) membrane in SERS-LFIA greatly impacts the detection performance. Its microporous structure determines the sample expansion speed and the capture antibody immobilization on the T line, ultimately affecting the repeatability, sensitivity, and detection performance.12 However, irregular porous structures at the micron scale lead to scattering and nonuniform distribution of nanoparticles on its surface, thus, affecting optical signal detection.13,14
Therefore, a paper with a micropillar scaffold has been synthesized from off-stoichiometry-thiol–ene (OSTE) by lithography to prepare ordered microstructures, improving the detection performance.15 Compared with state-of-the-art glass and nitrocellulose substrates, the synthetic paper exhibits a stronger fluorescence and lower limit of detection (LOD) in detecting enrofloxacin in milk. In addition, the synthetic paper provides better reproducibility and needs less immunoreagent. However, the aperture of synthetic paper is about 100 μm, which is too large for SERS-LFIA. Chen et al. proposed a vertical flow immunoassay system with anodic aluminum oxide (AAO) and SERS nanotags.16 In contrast to the NC membrane, the AAO membrane is an ordered porous structure membrane at the nanometer scale. It not only facilitates the possibility of the antibody–antigen interaction but also promotes the coupling of excitation light and plasmonic particles, thus improving the SERS nanotag signals. Therefore, the detection limit for four inflammatory biomarkers reaches the femoral level. Since the fluid can only flow vertically in the AAO membrane, it cannot be used for SERS-LFIA.
Inverse opal nitrocellulose, an ordered micro-nano structure formed by periodic medium arrangement, provides new strategies to overcome these challenges.17,18 Therefore potential advantages are realized by inverse opal nitrocellulose with SERS-LFIA. First, it interconnects nanopores in the nanoscale, increasing the chance in antigen–antibody interaction by nanoconfinement, thus improving detection sensitivity. Second, the pore sizes are more uniform with a larger surface-to-volume ratio, favored by higher detection performance.
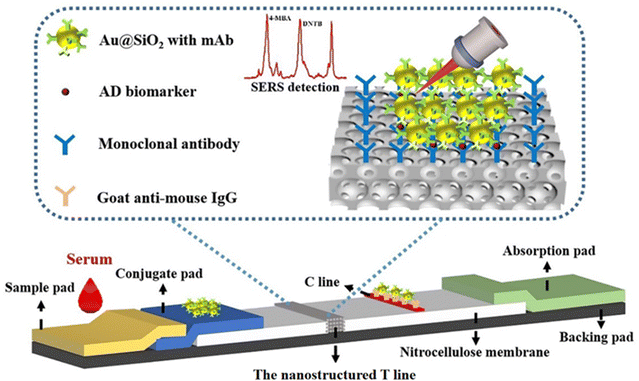
Therefore, in this proof of concept work, an LFIA strip is fabricated with a T line of inverse opal nitrocellulose combined with SERS nanotags and the so-called nanostructured SERS-LFIA for the multiplex detection of biomarkers with ultra-high sensitivity (Fig. 1). Alzheimer's disease (AD) is selected as a model disease to evaluate the nanostructured SERS-LFIAs’ performance. When the sample is dropped onto the sample pad and flows laterally to the absorption pad, the biomarkers conjugate with SERS nanotags correspondingly. Then they are captured at the nanostructured T line, where the signal of SERS nanotags quantitatively detects them. Compared with previously reported SERS-LFIA,19 the nanostructured SERS-LFIA enhances the sensitivity, offering great potential for the early non-invasive detection of AD biomarkers in blood.
2. Experimental section
2.1. Experimental materials and instruments
All reagents were of analytical grade and used without further purification. Nitric acid (HNO3), hydrochloric acid, tetrachloroaurate(III) trihydrate (HAuCl4·3H2O), silver nitrate (AgNO3), trisodium citrate (Na3C6H5O7), bovine serum albumin (BSA), ascorbic acid (AA), ammonia solution, tetraethyl orthosilicate (TEOS), and Tween-20 were purchased from Sinopharm Chemical Reagent Co., Ltd. 3-Glycidyloxypropyltrimethoxysilane (GPTMES), N,N-dimethylformamide (DMF) and 2-hydroxy-1-ethanethiol were supplied by Tianjin C&S Biochemical Technology Co., Ltd. 4-Mercaptobenzoic acid (4-MBA) and 5,5′-dithio bis-(2-nitrobenzoic acid) (DNTB) were obtained from Alfa Aesar. Phosphate buffered saline (PBS) and tri(hydroxymethyl)aminomethane hydrochloride (Tris-HCl) were provided by Sangon Biotech (Shanghai) Co., Ltd.Human Aβ42 peptide, human Aβ40 peptide, human tau441 protein, a pair of mouse anti-Aβ42 monoclonal antibodies, anti-tau monoclonal antibodies, and anti-Aβ40 monoclonal antibodies were provided by BioLegend, Inc. Human Neurofilament light chain (NFL) protein and a pair of mouse anti-human NFL antibodies were purchased from Abcam, Inc. Goat anti-mouse IgG antibody was supplied by Beijing Key-Bio Biotech Co., Ltd. The glassware used in these experiments was purchased from Nanjing WANQING chemical Glass ware and Instrument Co., Ltd. Water used to wash glassware and configure reagents was distilled water obtained from the Milli-Q system. All glassware was soaked in a freshly prepared aqua regia solution (HCl/HNO3, v/v, 3![[thin space (1/6-em)]](https://www.rsc.org/images/entities/char_2009.gif) :
:![[thin space (1/6-em)]](https://www.rsc.org/images/entities/char_2009.gif) 1) for 2 h and then rinsed thoroughly with distilled water before use. Nylon filters were purchased from Nanjing WANQING chemical Glass ware and Instrument Co., Ltd. Silica particles were obtained from NanJing Nanorainbow Biotechnology Co., Ltd.
1) for 2 h and then rinsed thoroughly with distilled water before use. Nylon filters were purchased from Nanjing WANQING chemical Glass ware and Instrument Co., Ltd. Silica particles were obtained from NanJing Nanorainbow Biotechnology Co., Ltd.
Scanning electron microscopy (SEM; Zeiss, Ultra Plus) was used to characterize the morphology of SERS nanotags and inverse opal nitrocellulose. A Raman spectroscopy system (British Renishaw Company) was used to measure the Raman spectra using a 785 nm laser with a power of 3 mW. A 20× objective lens was selected, and the integration time was 10 s.
2.2. Preparation of bio-functioned SERS nanotags
GPTMES functionalized Au4-MBA@SiO2 and AuDNTB@SiO2 were prepared using a previously reported method.19 The conjugation of SERS nanotags and antibodies was done as follows: first, the above 1 mL GPTMES functionalized Au4-MBA@SiO2 and AuDNTB@SiO2 SERS nanotags were mixed with 50 μL of 0.5 mg mL−1 Aβ42 and Aβ40 antibodies, respectively, and incubated for 3 h. The unbound antibodies were removed by centrifugation. Next, the antibody-conjugated SERS nanotags were redispersed in 1 mL of 5% BSA solution and incubated for another 1.5 h. Finally, the blocking solution was removed, and bio-functioned Au@SiO2 SERS nanotags were redissolved in 100 μL of re-suspending solution.2.3. Fabrication of inverse opal nitrocellulose
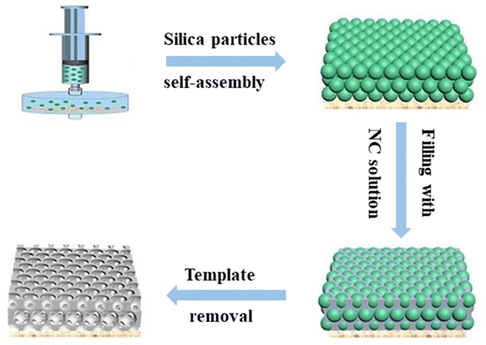
Fig. 2 illustrates the fabrication process of the inverse opal nitrocellulose. First, silica particles were purified by centrifugation for 10 min to homogenize the particles. After purification, silica particles were dispersed in ethanol to obtain a 30% (m/v) colloidal solution, filtered vertically onto the nylon filter through a syringe, and self-assembled at room temperature. After 2 h, a self-assembly template with structural color was obtained. An NC solution was prepared by dissolving NC in acetone, and DMF (1![[thin space (1/6-em)]](https://www.rsc.org/images/entities/char_2009.gif) :
:![[thin space (1/6-em)]](https://www.rsc.org/images/entities/char_2009.gif) 1, v/v) mixture and then slowly dripped onto the self-assembly template. After curing for 3 h, the NC membrane containing silica nanoparticles was carefully removed from the nylon filter with distilled water and immersed in a 4% HF solution to etch silica nanoparticles.
1, v/v) mixture and then slowly dripped onto the self-assembly template. After curing for 3 h, the NC membrane containing silica nanoparticles was carefully removed from the nylon filter with distilled water and immersed in a 4% HF solution to etch silica nanoparticles.
2.4. Preparation of the nanostructured SERS-LFIA strip
First, the goat anti-mouse IgG antibody (1 mg mL−1) was anchored on the C line of the NC membrane, dried at 37 °C for 1 h, and stored under a dry atmosphere. Bio-functioned SERS nanotags assigned to the conjugate pad, and dried and stored at room temperature.The NC membrane was first attached to the middle of the backing pad to fabricate the strip. Second, the inverse opal nitrocellulose was embedded between the NC membrane to replace the conventional T line, and a nanostructured SERS-LFIA strip was completed. Third, Aβ42 capturing antibody solution (1 mg mL−1) and Aβ40 capturing antibody solution (1 mg mL−1) were mixed and fixed on a nanostructured T line. Next, the absorption, sample, and conjugated pads were fixed to the corresponding position on the backing pad. Finally, the assembled card was cut into 3 mm-wide strips and stored at room temperature for further use.
2.5. Detection of AD biomarkers
The mixtures of Aβ42 and Aβ40 (1![[thin space (1/6-em)]](https://www.rsc.org/images/entities/char_2009.gif) :
:![[thin space (1/6-em)]](https://www.rsc.org/images/entities/char_2009.gif) 1, v/v) of different concentrations (100 fg mL−1 to 10 μg mL−1) were prepared. Then bio-functioned Au4-MBA@SiO2 SERS and bio-functioned AuDNTB@SiO2 SERS nanotags were used to detect Aβ42 and Aβ40, respectively. A nanostructured SERS-LFIA was constructed to detect Aβ42 and Aβ40 simultaneously. 100 μL Aβ solutions of different concentrations were pipetted on the sample pad. After 20 min, the naked eye could observe the color change in nanostructured T and C lines. The appearance of a red band on the C line validated the detection results. A SERS-LFIA was constructed to detect Aβ42 in the same way. The Raman signal intensity at 1079 cm−1 and 1330 cm−1 was then used for the quantitative analysis of Aβ42 and Aβ40, respectively. Each concentration gradient was tested three times.
1, v/v) of different concentrations (100 fg mL−1 to 10 μg mL−1) were prepared. Then bio-functioned Au4-MBA@SiO2 SERS and bio-functioned AuDNTB@SiO2 SERS nanotags were used to detect Aβ42 and Aβ40, respectively. A nanostructured SERS-LFIA was constructed to detect Aβ42 and Aβ40 simultaneously. 100 μL Aβ solutions of different concentrations were pipetted on the sample pad. After 20 min, the naked eye could observe the color change in nanostructured T and C lines. The appearance of a red band on the C line validated the detection results. A SERS-LFIA was constructed to detect Aβ42 in the same way. The Raman signal intensity at 1079 cm−1 and 1330 cm−1 was then used for the quantitative analysis of Aβ42 and Aβ40, respectively. Each concentration gradient was tested three times.
3. Results and discussion
3.1. Principal of the nanostructured SERS-LFIA
The schematic of the nanostructured SERS-LFIA was shown in Fig. 1. It comprises five parts: sample pad, conjugate pad, NC membrane, absorbent pad and adhesive backing. It is remarkable that the traditional T line is replaced by the inverse opal nitrocellulose. The inverse opal nitrocellulose has the following advantages: first, an ordered nanoscale structure can reduce the roughness of the membrane, which is beneficial for the dispersion of detection reagents. Second, the pore size of the inverse opal nitrocellulose can be changed to improve the coupling efficiency between excitation light and SERS nanotags. Third, inverse opal nitrocellulose with appropriate pore size can be selected to improve detection sensitivity. The inverse opal nitrocellulose is prepared by assembly and etching, which has the advantages of simple preparation and adjustable pore size.3.2. Optimization of inverse opal nitrocellulose
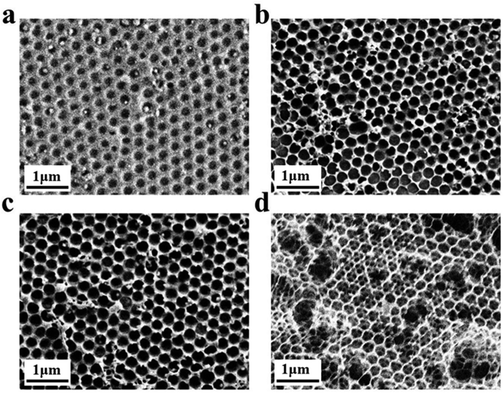
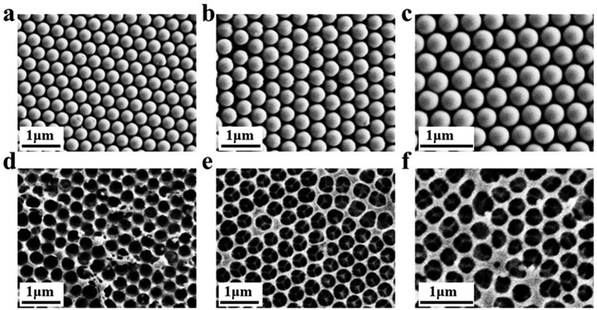
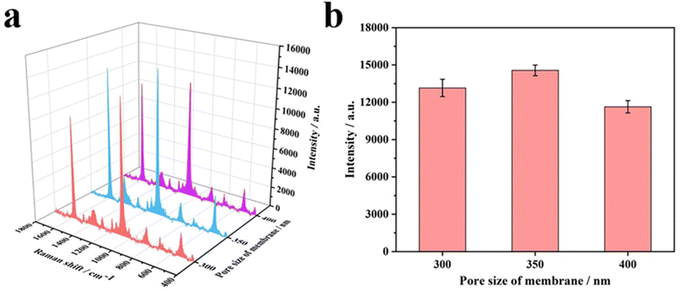
Inverse opal nitrocellulose is affected by the following three factors: nitrocellulose solution concentration, hydrofluoric acid etching time and the diameter of silica particles. In order to achieve highly sensitive AD detection, we optimized three factors separately.Fig. 5 shows that all three monodisperse silica particles successfully self-assemble into corresponding templates, and the inverse opal nitrocellulose with corresponding pore sizes is prepared finally. These results indicate that different-sized silica particles could fabricate inverse opal nitrocellulose with different pore sizes. Therefore, inverse opal nitrocellulose with pore sizes of 300, 350, and 400 nm are assembled into test strips separately and tested with Aβ42 (100 ng mL−1), the Raman signal is enhanced when the diameter increases from 300 nm to 350 nm and is decreased when the diameter increases to 400 nm (Fig. 6). This phenomenon might be attributed to two reasons: First, the self-assembly effectiveness of monodisperse silica particles with large particle size is not as good as that of small particle size, resulting in an irregular pore size of nanostructured T line. Second, the larger pore size creates a relatively lower specific surface area, which is not conducive to the immune reaction. Therefore, the number of SERS nanotags on a nanostructured T line with a pore diameter of 400 nm is less than that of 350 nm, and the Raman signal is weakened. Therefore, the nanostructured T line with an aperture of 350 nm is selected for subsequent experiments.
3.3. Comparison of nanostructured T line with conventional T line
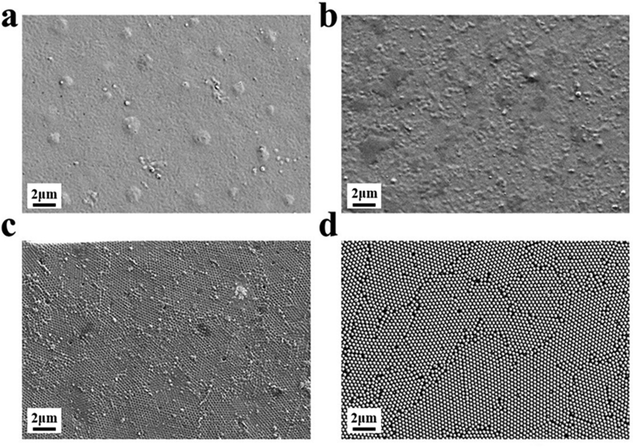
Firstly, the morphology of the nanostructured T line (350 nm) and the conventional T line is characterized by SEM. The conventional T line has an irregular porous structure at the micron level (Fig. 7a), leading to strong scattering, affecting the optical signals, and preventing homogeneous nanoparticle distribution on its surface. Inversely, the nanostructured T line overcomes these defects (Fig. 7b) and shows nano-confinement effects to favor immune reactions.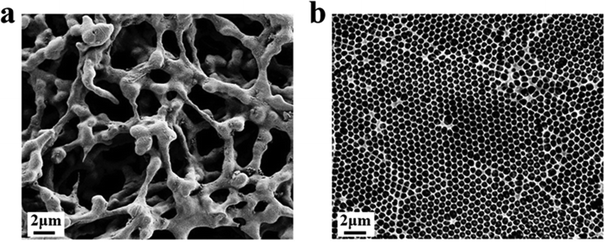 | ||
| Fig. 7 SEM images of nanostructured and conventional T lines. (a) Conventional T line; (b) nanostructured T line. | ||
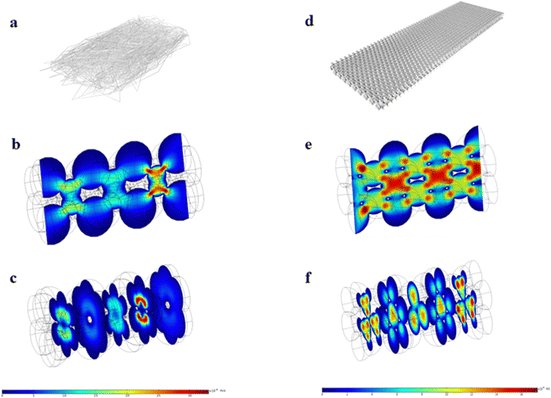
According to previous reports, the low flow rate of fluid in the NC membrane is conducive to antigens and antibodies binding.27 Peristaltic flow in the COMSOL Multiphysics package is applied to simulate the fluid flow rate in the nanostructured and conventional T lines. Fig. 8(a) and (d) show schematic diagrams of the conventional T line and nanostructured T line, respectively. During simulation, the conventional T line is modeled as a rectangular cube with alternately stacked holes of different diameters (3.5, 4, 4.5, and 6 μm). The nanostructured T line is modeled as a rectangular cube with a hexagonal tightly spaced hole, and the diameter of each hole is set to 350 nm. Boundary conditions: no-slip boundary conditions are set on the walls. Laminar flow with a mean velocity of 0.0003 m s−1 is set at the inlet, and zero pressure is set at the outlet. Fig. 8(b) and (e) show the flow velocity in the longitudinal-section of the conventional T line and nanostructured T line, respectively. Fig. 8(c) and (f) show the flow velocity in the cross-section of the conventional T line and nanostructured T line, respectively. Compared with the conventional T line, liquid travels slower to prevent more reactant delivery within a certain time in the nanostructured T line, which leads to highly efficient and uniform immune binding, meanwhile a larger specific surface area is conducive to the immune reaction. However, the time required for reactant delivery needs to be limited to reduce reactant evaporation and improve detection efficiency. So, the trade-off between the reactant delivery and specific surface area motivates structural optimization for the entire NC membrane.28
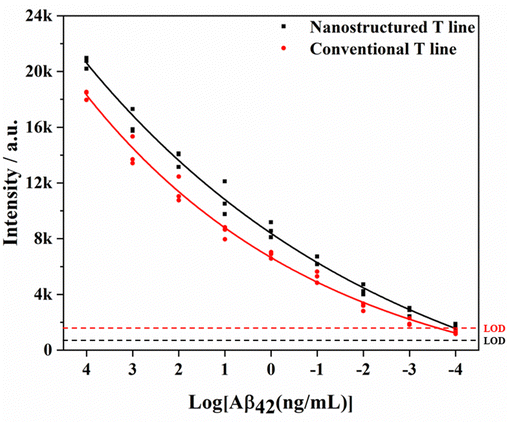
Furthermore, the nanostructured T line is assembled into LFIA to detect different concentrations of Aβ42. The comparison of test results and those of SERS-LFIA is shown in Fig. 9. For the same concentration of Aβ42, SERS-LFIA with the nanostructured T line realizes higher Raman signals. In addition, the LODs of those SERS-LFIA for the detection of Aβ42 are calculated by the following equation, LOD = γblank + 3 × SDblank, where γblank is the average signal intensity when the concentration is zero, and the SDblank represents the standard deviation. According to the standard curves (Fig. 11b),19 the LODs of SERS-LFIA and SERS-LFIA with the nanostructured T line are 134.9 fg mL−1 and 15.3 fg mL−1, respectively. The latter's LOD is about 10 times lower than the former's and exhibits better detection performance.
3.4. Detection of AD biomarkers
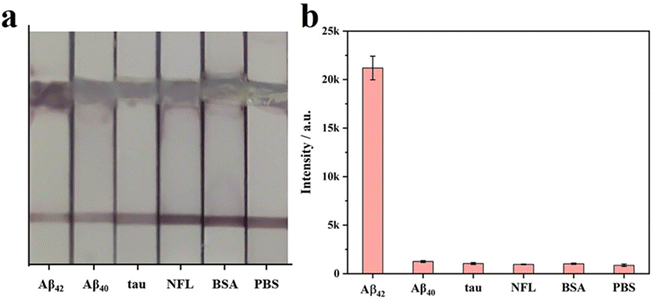
The specificity of SERS-LFIA with nanostructured T line is evaluated before AD biomarkers detection. Firstly, SERS-LFIA with a nanostructured T line is prepared for Aβ42 detections. Then 10 μg mL−1 of Aβ42, Aβ40, tau, NFL, BSA, and PBS are added dropwise to the sample pad, respectively. The photograph of six test strips is shown in Fig. 10a, and all test strips’ C lines are red, validating the test results. Only the test strips with the solution containing Aβ42 appear red on the nanostructured T line, while the other test strips without Aβ42 do not have a significant color change. The Raman signal on the nanostructured T line of each strip is also measured, and the signal intensity at 1079 cm−1 is compared. High Raman signals are detected on strips with the addition of Aβ42 only, while Raman signals are hardly observed with other solutions, as shown in Fig. 10b, suggesting that the SERS-LFIA with the nanostructured T line exhibits high specificity, providing the foundation for subsequent multiplex quantitative detection.Finally, SERS-LFIA with a nanostructured T line is used to detect Aβ42 and Aβ40 (Fig. 11). The linear dynamic range of Aβ42 and Aβ40 is 100 fg mL−1–100 ng mL−1, covering 6 orders of magnitude. In addition, the linear fitting coefficients (R2) of Aβ42 and Aβ40 are 0.965 and 0.959, respectively, indicating a very high linear correlation. LOD is calculated based on the Raman signal intensity of the blank control group and its 3-fold standard deviation. The LODs of Aβ42 and Aβ40 are 15.3 and 16.8 fg mL−1, respectively, about 10 times lower than that of conventional SERS-LFIA.19
The increase in sensitivity may be due to two aspects. On the one hand, the surface-to-volume of inverse opal nitrocellulose with an ordered structure is higher than the conventional one with a micron-sized irregular porous structure.29,30 On the other hand, the nanoconfinement of pores as immunoreaction nano-chambers also plays a key role, resembling the nanochannels array in vertical flow assays.16,31
4. Conclusions
A SERS-LFIA with a nanostructured T line is constructed and described. The concentration of NC solution and HF etching time are optimized during the preparation of inverse opal nitrocellulose. The optimal concentration of NC solution is 4%, and the optimal time for HF etching is 12 h. Inverse opal nitrocellulose with different pore diameters is successfully prepared by silica particles with different particle diameters. The best detection results are acquired with pore diameters of 350 nm. Finally, by detecting two AD biomarkers (Aβ42 and Aβ40), the LODs are 15.3 and 16.8 fg mL−1, respectively, about 10 times lower than SERS-LFIA. This is the first time the nanostructured T line and LFIA combination are proposed, providing a new idea and theoretical basis to improve the LFIA sensitivity. Compared with the existing detection technologies for AD biomarkers detection, the method proposed has the advantages of strong specificity, high sensitivity, simple operation, low cost, multiple detection, and rapid detection, offering great potential for early diagnosis and AD monitoring.Author contributions
Geng Zhu: methodology, investigation, data curation, writing – original draft. Yuanbao Zhan: methodology, investigation, data curation, writing – original draft. Yu Lu: methodology. Fei Zheng: software. Yu Wan: visualization. Bing Liu: data curation. Xi Yang: supervision. Yanhui Wan: methodology. Qingjiang Sun: methodology and resources. Jingjie Sha: formal analysis. Yan Huang: supervision, writing review and editing. Xiangwei Zhao: supervision, resources, writing review and editing. All authors read and approved the final manuscript.Conflicts of interest
There are no conflicts to declare.Acknowledgements
This work was financially supported by the Central Funds Guiding the Local Science and Technology Development of Shenzhen (2021Szvup024), Jiangsu Provincial Key Research and Development Program (BE2021664), and the Postgraduate Research & Practice Innovation Program of Jiangsu Province (KYCX22_0246).References
- Z. Qu, K. Wang, G. Alfranca, J. M. de la Fuente and D. Cui, Nanoscale Res. Lett., 2020, 15, 10 CrossRef CAS PubMed.
- A. E. Cetin, A. F. Coskun, B. C. Galarreta, M. Huang, D. Herman, A. Ozcan and H. Altug, Light: Sci. Appl., 2014, 3, e122 CrossRef CAS.
- J. Liu, Z. Geng, Z. Fan, J. Liu and H. Chen, Biosens. Bioelectron., 2019, 132, 17–37 CrossRef CAS PubMed.
- W. Yan, K. Wang, H. Xu, X. Huo, Q. Jin and D. Cui, Nanomicro Lett., 2019, 11, 7 CAS.
- M. Sajid, A.-N. Kawde and M. Daud, J. Saudi Chem. Soc., 2015, 19, 689–705 CrossRef.
- E. Eltzov, S. Guttel, A. Low Yuen Kei, P. D. Sinawang, R. E. Ionescu and R. S. Marks, Electroanalysis, 2015, 27, 2116–2130 CrossRef CAS.
- J. Tu, T. Wu, Q. Yu, J. Li, S. Zheng, K. Qi, G. Sun, R. Xiao and C. Wang, J. Hazard. Mater., 2023, 448, 130912 CrossRef CAS PubMed.
- C. Parolo, A. Sena-Torralba, J. F. Bergua, E. Calucho, C. Fuentes-Chust, L. Hu, L. Rivas, R. Alvarez-Diduk, E. P. Nguyen, S. Cinti, D. Quesada-Gonzalez and A. Merkoci, Nat. Protoc., 2020, 15, 3788–3816 CrossRef CAS PubMed.
- D. Zhang, L. Huang, B. Liu, H. Ni, L. Sun, E. Su, H. Chen, Z. Gu and X. Zhao, Biosens. Bioelectron., 2018, 106, 204–211 CrossRef CAS PubMed.
- L. Wang, X. Wang, L. Cheng, S. Ding, G. Wang, J. Choo and L. Chen, Biosens. Bioelectron., 2021, 189, 113360 CrossRef CAS PubMed.
- M. Lu, Y. Joung, C. S. Jeon, S. Kim, D. Yong, H. Jang, S. H. Pyun, T. Kang and J. Choo, Nano Converg., 2022, 9, 39 CrossRef CAS PubMed.
- O. J. Clarke, B. L. Goodall, H. P. Hui, N. Vats and C. L. Brosseau, Anal. Chem., 2017, 89, 1405–1410 CrossRef CAS PubMed.
- W. Guo, J. Hansson and W. van der Wijngaart, Anal. Chem., 2020, 92, 6194–6199 CrossRef CAS PubMed.
- J. Hansson, H. Yasuga, T. Haraldsson and W. van der Wijngaart, Lab Chip, 2016, 16, 298–304 RSC.
- W. Guo, L. Vilaplana, J. Hansson, M. P. Marco and W. van der Wijngaart, Biosens. Bioelectron., 2020, 163, 112279 CrossRef CAS PubMed.
- R. Chen, X. Du, Y. Cui, X. Zhang, Q. Ge, J. Dong and X. Zhao, Small, 2020, 16, e2002801 CrossRef PubMed.
- B. Gao, H. Liu and Z. Gu, Anal. Chem., 2016, 88, 5424–5429 CrossRef CAS PubMed.
- J. Chi, B. Ma, X. Dong, B. Gao, A. Elbaz, H. Liu and Z. Gu, Analyst, 2018, 143, 4559–4565 RSC.
- Y. Zhan, R. Fei, Y. Lu, Y. Wan, X. Wu, J. Dong, D. Meng, Q. Ge and X. Zhao, Analyst, 2022, 147, 4124–4131 RSC.
- B. Gao, X. Wang, T. Li, Z. Feng, C. Wang and Z. Gu, Adv. Mater. Technol., 2019, 4, 1800392 CrossRef.
- L. Zheng, X. Dong, J. Chi, M. Sun, C. Zhao and H. Liu, New J. Chem., 2019, 43, 4808–4814 RSC.
- B. Gao, Y. Yang, J. Liao, B. He and H. Liu, Lab Chip, 2019, 19, 3602–3608 RSC.
- Z. Gu, A. Fujishima and O. Sato, Chem. Mater., 2002, 14, 760–765 CrossRef CAS.
- J. Hou, M. Li and Y. Song, Angew. Chem., Int. Ed., 2018, 57, 2544–2553 CrossRef CAS PubMed.
- J. Chi, B. Gao, M. Sun, F. Zhang, E. Su, H. Liu and Z. Gu, Anal. Chem., 2017, 89, 7727–7733 CrossRef CAS PubMed.
- X. Zhao, J. Xue, Z. Mu, Y. Huang, M. Lu and Z. Gu, Biosens. Bioelectron., 2015, 72, 268–274 CrossRef CAS PubMed.
- C. L. A. Berli and P. A. Kler, Microfluid. Nanofluid., 2016, 20, 104 CrossRef.
- P. Jia, Z. Li, X. Wang, F. Xu, M. You and S. Feng, Int. Commun. Heat Mass Transfer, 2023, 143, 106729 CrossRef CAS.
- Z. Mu, X. Zhao, Y. Huang, M. Lu and Z. Gu, Small, 2015, 11, 6036–6043 CrossRef CAS PubMed.
- J. Chi, C. Shao, X. Du, H. Liu and Z. Gu, ACS Appl. Mater. Interfaces, 2018, 10, 39144–39150 CrossRef CAS PubMed.
- D. B. Gornowich and G. J. Blanchard, J. Phys. Chem. C, 2012, 116, 12165–12171 CrossRef CAS.
Footnote |
| † These authors contributed equally to this work. |
| This journal is © The Royal Society of Chemistry 2023 |

